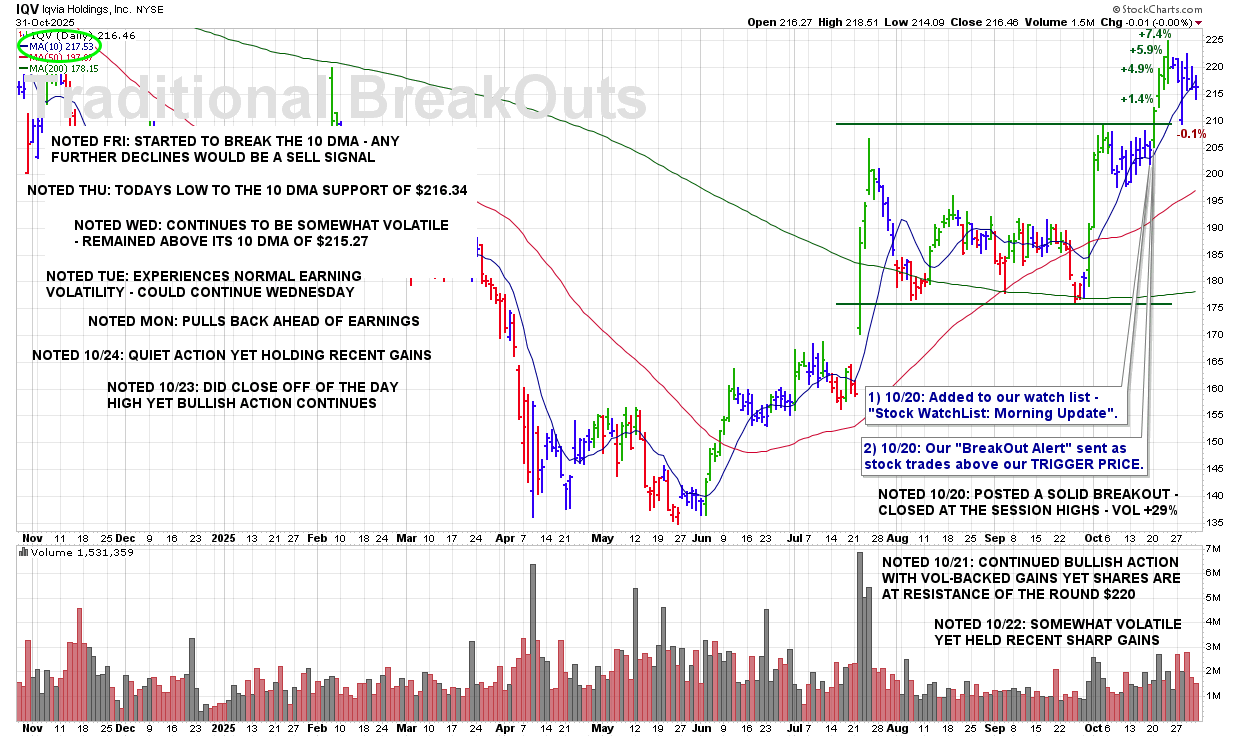
8:10 PM – Here is our latest chart update for this recent breakout from our Traditional BreakOuts Watch List.

CLICK/TAP CHART TO ZOOM
Chart services courtesy of stockcharts.com. Annotations by James Taulman.
8:10 PM – Here is our latest chart update for this recent breakout from our Traditional BreakOuts Watch List.
CLICK/TAP CHART TO ZOOM
Chart services courtesy of stockcharts.com. Annotations by James Taulman.
9:10 PM – Here is our latest chart update for this recent breakout from our Traditional BreakOuts Watch List.

CLICK/TAP CHART TO ZOOM
Chart services courtesy of stockcharts.com. Annotations by James Taulman.
8:10 PM – Here is our latest chart update for this recent breakout from our Traditional BreakOuts Watch List.
CLICK/TAP CHART TO ZOOM
Chart services courtesy of stockcharts.com. Annotations by James Taulman.
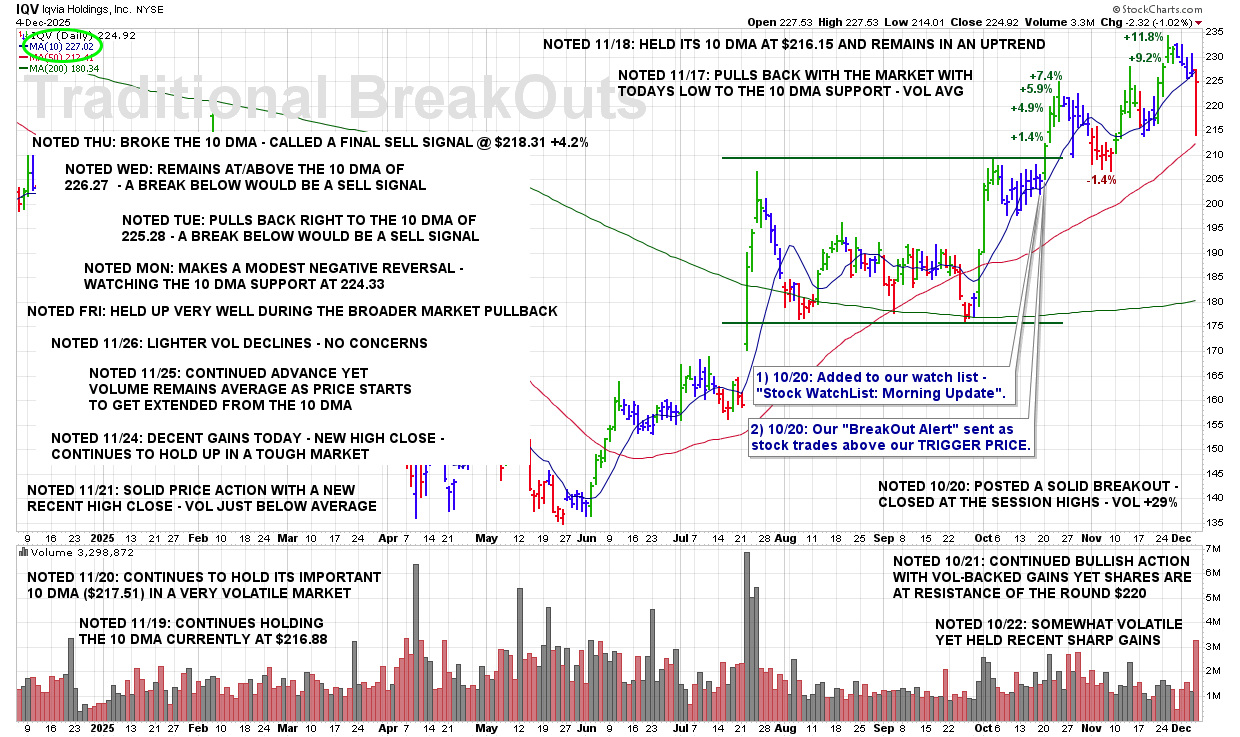
9:58 AM – Stock is breaking its 10 DMA and selling off with a sharp +344% increase in volume. Calling a FINAL SELL SIGNAL here as the chart signals clear weakness and short-term momentum rolls over.
SELL SIGNALS:
11/3 @ $210.27 +0.3%
11/5 @ $208.81 –0.4%
12/4 @ $218.31 +4.2%
OVERALL P/L: +1.4%
ULTRA Trader’s Tip: Follow the Breakdown
A surge in volume on a 10 DMA break often marks institutional selling.
Weak rebounds followed by sharp selloffs are early warnings of trend deterioration.
Exiting on confirmed technical shifts preserves gains and protects capital.

CLICK/TAP CHART TO ZOOM
Chart services courtesy of stockcharts.com. Annotations by James Taulman.

James had served as Editor-in-Chief of the first independently licensed website to offer stock reports and services based on the CAN SLIM® investment system.
Since the late 1990s, he has been analyzing growth stocks and providing investor-focused research rooted in time-tested technical strategies. Over the years, James developed a strong ability to quickly and accurately identify high-ranked trading candidates using this proven approach.
He has worked with a wide range of investors — from professional money managers to individual traders — helping them apply this disciplined system in real-world markets.
James has delivered weekly market commentary as part of the “Your Money Matters” radio program, broadcast on both ABC and CBS radio networks, and for a time was a daily guest on the Investor’s Edge radio program.
Today, he is the developer and founder of U L T R A — a robust yet easy-to-use trading system built to identify and manage high-probability stock trades based on strict technical rules and real-time alerts.
8:15 PM – Here is our latest chart update for this recent breakout from our Traditional BreakOuts Watch List.
CLICK/TAP CHART TO ZOOM
Chart services courtesy of stockcharts.com. Annotations by James Taulman.
9:15 PM – Here is our latest chart update for this recent breakout from our Traditional BreakOuts Watch List.

CLICK/TAP CHART TO ZOOM
Chart services courtesy of stockcharts.com. Annotations by James Taulman.
8:15 PM – Here is our latest chart update for this recent breakout from our Traditional BreakOuts Watch List.
CLICK/TAP CHART TO ZOOM
Chart services courtesy of stockcharts.com. Annotations by James Taulman.
11:15 PM – Here is our latest chart update for this recent breakout from our Traditional BreakOuts Watch List.

CLICK/TAP CHART TO ZOOM
Chart services courtesy of stockcharts.com. Annotations by James Taulman.
7:15 PM – Here is our latest chart update for this recent breakout from our Traditional BreakOuts Watch List.

CLICK/TAP CHART TO ZOOM
Chart services courtesy of stockcharts.com. Annotations by James Taulman.
8:35 PM – Here is our latest chart update for this recent breakout from our Traditional BreakOuts Watch List.

CLICK/TAP CHART TO ZOOM
Chart services courtesy of stockcharts.com. Annotations by James Taulman.
9:35 PM – Here is our latest chart update for this recent breakout from our Traditional BreakOuts Watch List.

CLICK/TAP CHART TO ZOOM
Chart services courtesy of stockcharts.com. Annotations by James Taulman.
8:35 PM – Here is our latest chart update for this recent breakout from our Traditional BreakOuts Watch List.

CLICK/TAP CHART TO ZOOM
Chart services courtesy of stockcharts.com. Annotations by James Taulman.
10:35 PM – Here is our latest chart update for this recent breakout from our Traditional BreakOuts Watch List.

CLICK/TAP CHART TO ZOOM
Chart services courtesy of stockcharts.com. Annotations by James Taulman.
9:35 PM – Here is our latest chart update for this recent breakout from our Traditional BreakOuts Watch List.

CLICK/TAP CHART TO ZOOM
Chart services courtesy of stockcharts.com. Annotations by James Taulman.
10:35 PM – Here is our latest chart update for this recent breakout from our Traditional BreakOuts Watch List.

CLICK/TAP CHART TO ZOOM
Chart services courtesy of stockcharts.com. Annotations by James Taulman.
11:05 PM – Here is our latest chart update for this recent breakout from our Traditional BreakOuts Watch List.

CLICK/TAP CHART TO ZOOM
Chart services courtesy of stockcharts.com. Annotations by James Taulman.
10:05 PM – Here is our latest chart update for this recent breakout from our Traditional BreakOuts Watch List.

CLICK/TAP CHART TO ZOOM
Chart services courtesy of stockcharts.com. Annotations by James Taulman.
9:05 PM – Here is our latest chart update for this recent breakout from our Traditional BreakOuts Watch List.

CLICK/TAP CHART TO ZOOM
Chart services courtesy of stockcharts.com. Annotations by James Taulman.
8:05 PM – Here is our latest chart update for this recent breakout from our Traditional BreakOuts Watch List.

CLICK/TAP CHART TO ZOOM
Chart services courtesy of stockcharts.com. Annotations by James Taulman.
9:05 PM – Here is our latest chart update for this recent breakout from our Traditional BreakOuts Watch List.

CLICK/TAP CHART TO ZOOM
Chart services courtesy of stockcharts.com. Annotations by James Taulman.
10:05 PM – Here is our latest chart update for this recent breakout from our Traditional BreakOuts Watch List.

CLICK/TAP CHART TO ZOOM
Chart services courtesy of stockcharts.com. Annotations by James Taulman.
10:05 PM – Here is our latest chart update for this recent breakout from our Traditional BreakOuts Watch List.

CLICK/TAP CHART TO ZOOM
Chart services courtesy of stockcharts.com. Annotations by James Taulman.
8:05 PM – Here is our latest chart update for this recent breakout from our Traditional BreakOuts Watch List.

CLICK/TAP CHART TO ZOOM
Chart services courtesy of stockcharts.com. Annotations by James Taulman.
8:15 PM – Here is our latest chart update for this recent breakout from our Traditional BreakOuts Watch List.

CLICK/TAP CHART TO ZOOM
Chart services courtesy of stockcharts.com. Annotations by James Taulman.
9:40 AM – Shares are making new recent lows today as the 10 DMA continues to roll over. The technical picture has weakened further, confirming a 2nd SELL SIGNAL as short-term momentum deteriorates.
SELL SIGNALS:
11/3 @ $210.27 +0.3%
11/5 @ $208.81 -0.4%
An ULTRA Trader’s Tip: Rolling Averages Tell the Story
A flattening or downward-sloping 10 DMA means momentum is shifting.
Once that line rolls, rallies often fail beneath it.
Respect the message of the moving averages — they show you what price action alone can’t.

CLICK/TAP CHART TO ZOOM
Chart services courtesy of stockcharts.com. Annotations by James Taulman.
James had served as Editor-in-Chief of the first independently licensed website to offer stock reports and services based on the CAN SLIM® investment system.
Since the late 1990s, he has been analyzing growth stocks and providing investor-focused research rooted in time-tested technical strategies. Over the years, James developed a strong ability to quickly and accurately identify high-ranked trading candidates using this proven approach.
He has worked with a wide range of investors — from professional money managers to individual traders — helping them apply this disciplined system in real-world markets.
James has delivered weekly market commentary as part of the “Your Money Matters” radio program, broadcast on both ABC and CBS radio networks, and for a time was a daily guest on the Investor’s Edge radio program.
Today, he is the developer and founder of U L T R A — a robust yet easy-to-use trading system built to identify and manage high-probability stock trades based on strict technical rules and real-time alerts.
10:15 PM – Here is our latest chart update for this recent breakout from our Traditional BreakOuts Watch List.
CLICK/TAP CHART TO ZOOM
Chart services courtesy of stockcharts.com. Annotations by James Taulman.
11:15 PM – Here is our latest chart update for this recent breakout from our Traditional BreakOuts Watch List.
CLICK/TAP CHART TO ZOOM
Chart services courtesy of stockcharts.com. Annotations by James Taulman.
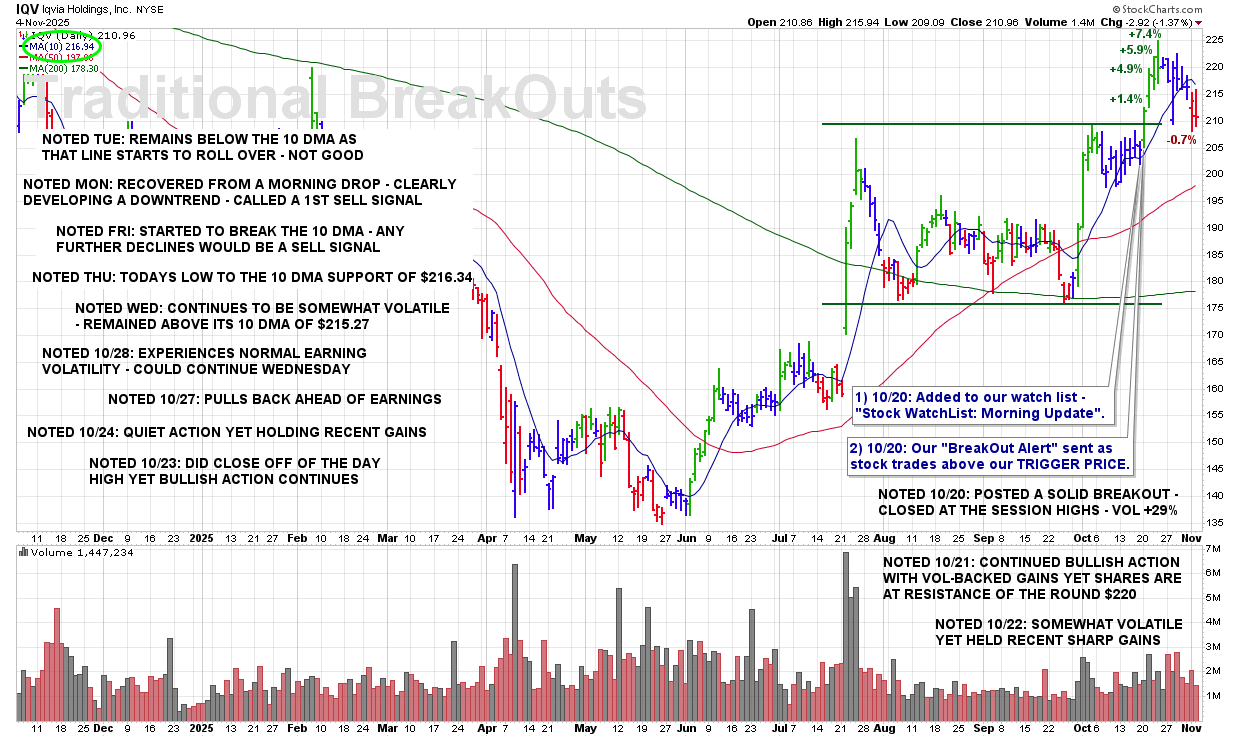
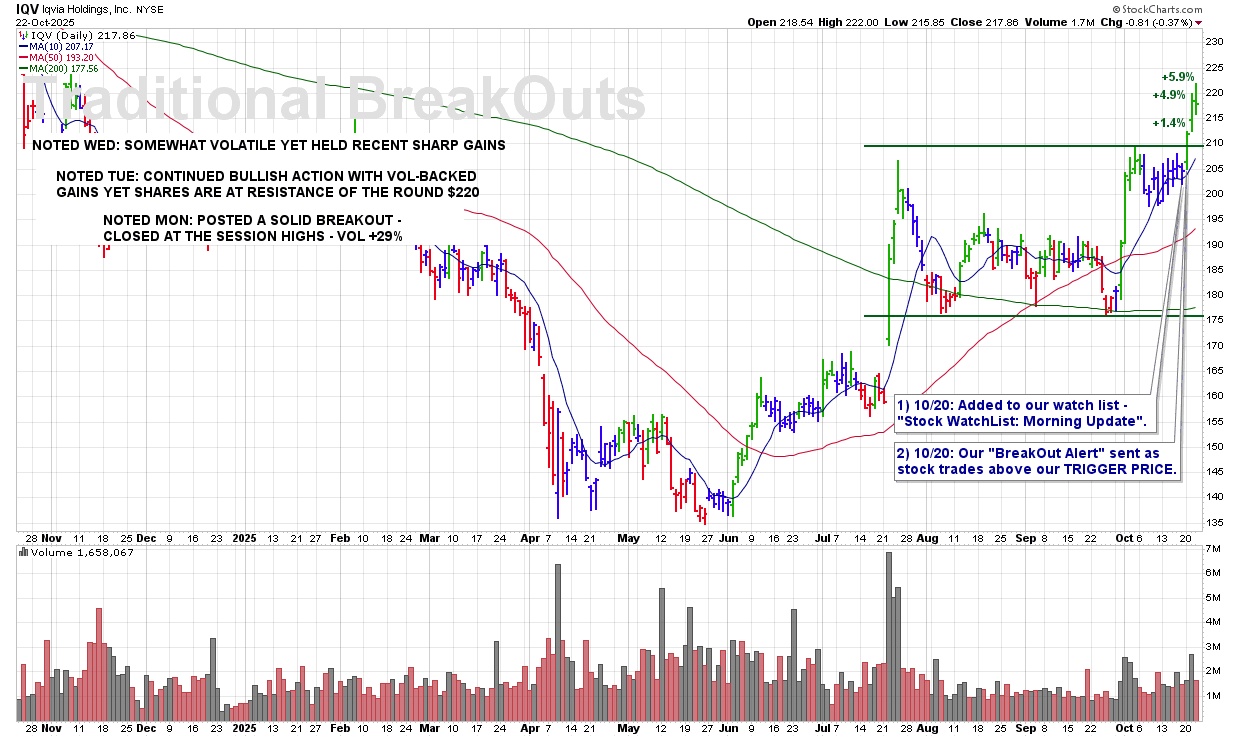
11:11 AM – Stock has clearly lost support at the 10 DMA as that line begins to roll over. Momentum has stalled, signaling short-term weakness and a likely shift in character.
SELL SIGNAL:
11/3 @ $210.27 +0.3%
ULTRA Trader’s Tip: Respect the 10 DMA
The 10-day moving average is the heartbeat of short-term momentum.
A decisive break below it often signals the start of a pullback.
When that line rolls over, strength is no longer leading — it’s fading.

CLICK/TAP CHART TO ZOOM
Chart services courtesy of stockcharts.com. Annotations by James Taulman.
James had served as Editor-in-Chief of the first independently licensed website to offer stock reports and services based on the CAN SLIM® investment system.
Since the late 1990s, he has been analyzing growth stocks and providing investor-focused research rooted in time-tested technical strategies. Over the years, James developed a strong ability to quickly and accurately identify high-ranked trading candidates using this proven approach.
He has worked with a wide range of investors — from professional money managers to individual traders — helping them apply this disciplined system in real-world markets.
James has delivered weekly market commentary as part of the “Your Money Matters” radio program, broadcast on both ABC and CBS radio networks, and for a time was a daily guest on the Investor’s Edge radio program.
Today, he is the developer and founder of U L T R A — a robust yet easy-to-use trading system built to identify and manage high-probability stock trades based on strict technical rules and real-time alerts.
11:05 PM – Here is our latest chart update for this recent breakout from our Traditional BreakOuts Watch List.
CLICK/TAP CHART TO ZOOM
Chart services courtesy of stockcharts.com. Annotations by James Taulman.
7:05 PM – Here is our latest chart update for this recent breakout from our Traditional BreakOuts Watch List.

CLICK/TAP CHART TO ZOOM
Chart services courtesy of stockcharts.com. Annotations by James Taulman.
10:05 PM – Here is our latest chart update for this recent breakout from our Traditional BreakOuts Watch List.

CLICK/TAP CHART TO ZOOM
Chart services courtesy of stockcharts.com. Annotations by James Taulman.
10:05 PM – Here is our latest chart update for this recent breakout from our Traditional BreakOuts Watch List.

CLICK/TAP CHART TO ZOOM
Chart services courtesy of stockcharts.com. Annotations by James Taulman.
9:35 PM – Here is our latest chart update for this recent breakout from our Traditional BreakOuts Watch List.

CLICK/TAP CHART TO ZOOM
Chart services courtesy of stockcharts.com. Annotations by James Taulman.
8:35 PM – Here is our latest chart update for this recent breakout from our Traditional BreakOuts Watch List.

CLICK/TAP CHART TO ZOOM
Chart services courtesy of stockcharts.com. Annotations by James Taulman.
9:30 PM – Here is our latest chart update for this recent breakout from our Traditional BreakOuts Watch List.

CLICK/TAP CHART TO ZOOM
Chart services courtesy of stockcharts.com. Annotations by James Taulman.
9:40 PM – Here is our latest chart update for this recent breakout from our Traditional BreakOuts Watch List.
CLICK/TAP CHART TO ZOOM
Chart services courtesy of stockcharts.com. Annotations by James Taulman.
8:35 PM – Here is our latest chart update for this recent breakout from our Traditional BreakOuts Watch List.

CLICK/TAP CHART TO ZOOM
Chart services courtesy of stockcharts.com. Annotations by James Taulman.
10:50 AM – Here is our latest chart update for this recent breakout from our Traditional BreakOuts Watch List.

CLICK/TAP CHART TO ZOOM
Chart services courtesy of stockcharts.com. Annotations by James Taulman.
BreakOut Alert: IQV traded above its TRIGGER PRICE of $209.58. The security is currently trading at $209.58.
Mon, 20 Oct 2025 10:50:00 +0000
PRIVACY POLICY | TERMS & CONDITIONS