Ongoing updates for DSGX will be posted at the link below, as soon as each one is made available.
https://buyingbreakouts.com/category/dsgx/
You can bookmark the page for future reference.
Ongoing updates for DSGX will be posted at the link below, as soon as each one is made available.
https://buyingbreakouts.com/category/dsgx/
You can bookmark the page for future reference.
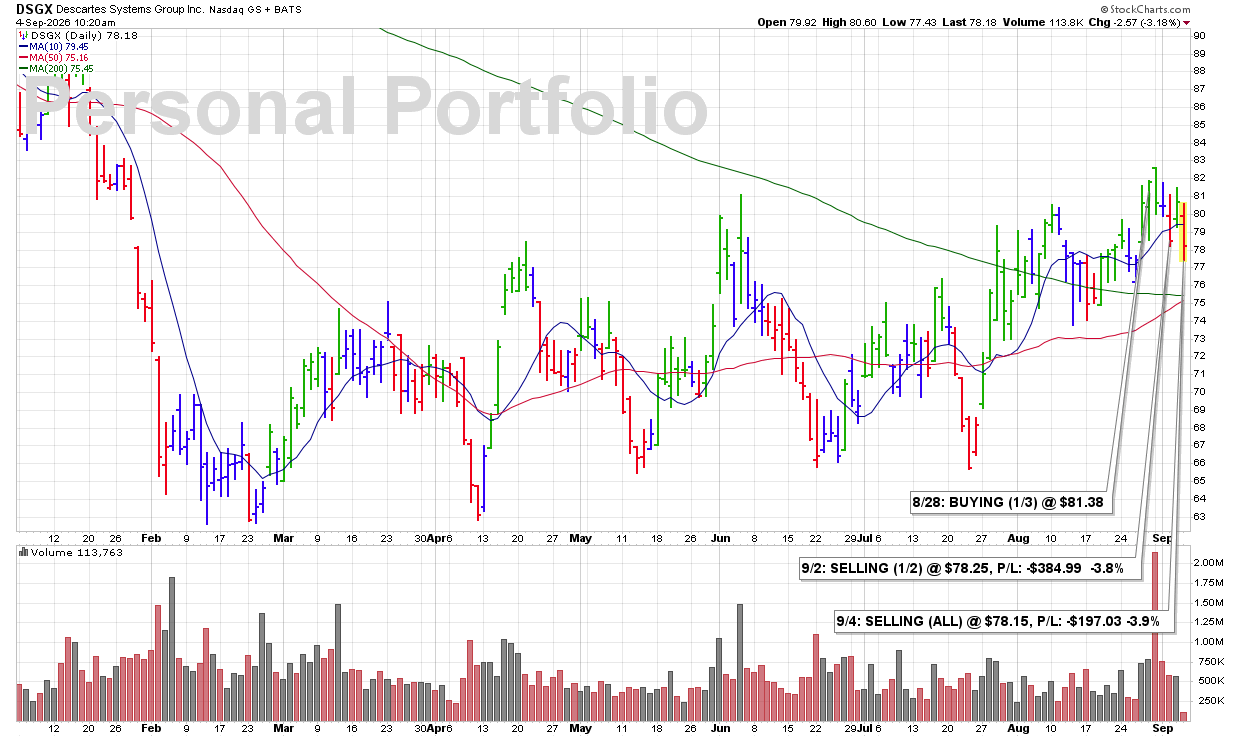
10:10 AM – Selling the last of my DSGX position here as shares break below the 10 DMA with a sharp increase in volume. The combination of a key support violation and heavy selling volume is a clear SELL SIGNAL under our rules, so I’m exiting the position completely.
James’ Trader’s Tip: Volume Confirms the Breakdown
• A break below the 10 DMA is an important technical violation.
• A sharp increase in volume makes the weakness more meaningful by confirming stronger selling pressure.
• When price and volume turn bearish together, follow the rules and protect capital.
CLICK/TAP CHART TO ZOOM
Chart services courtesy of stockcharts.com. Annotations by James Taulman.
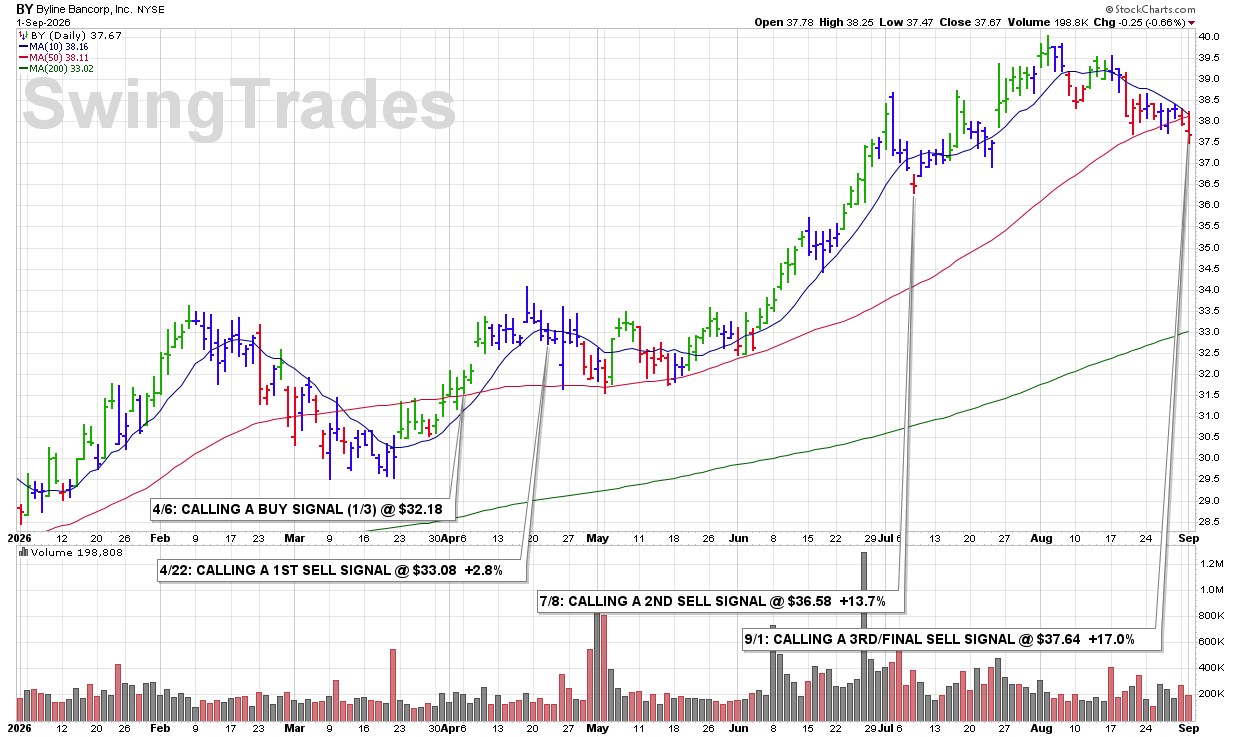
10:05 PM – Calling a FINAL SELL SIGNAL on Byline Bancorp as bearish technical action continues to mount. The 10 DMA has repeatedly weighed on the stock and acted as resistance, while a clear downtrend has developed from the early-August highs near $40.00. Today’s move to a new recent closing low adds another bearish sign and confirms the continued deterioration.
ULTRA Trader’s Tip: Repeated Resistance Can Define the Trend
• When a stock repeatedly fails at the 10 DMA, that line can shift from support to resistance.
• A pattern of lower prices developing from prior highs is evidence that a downtrend is taking shape.
• New recent lows add confirmation that weakness is continuing and support taking the final SELL SIGNAL.
CLICK/TAP CHART TO ZOOM
Chart services courtesy of stockcharts.com. Annotations by James Taulman.
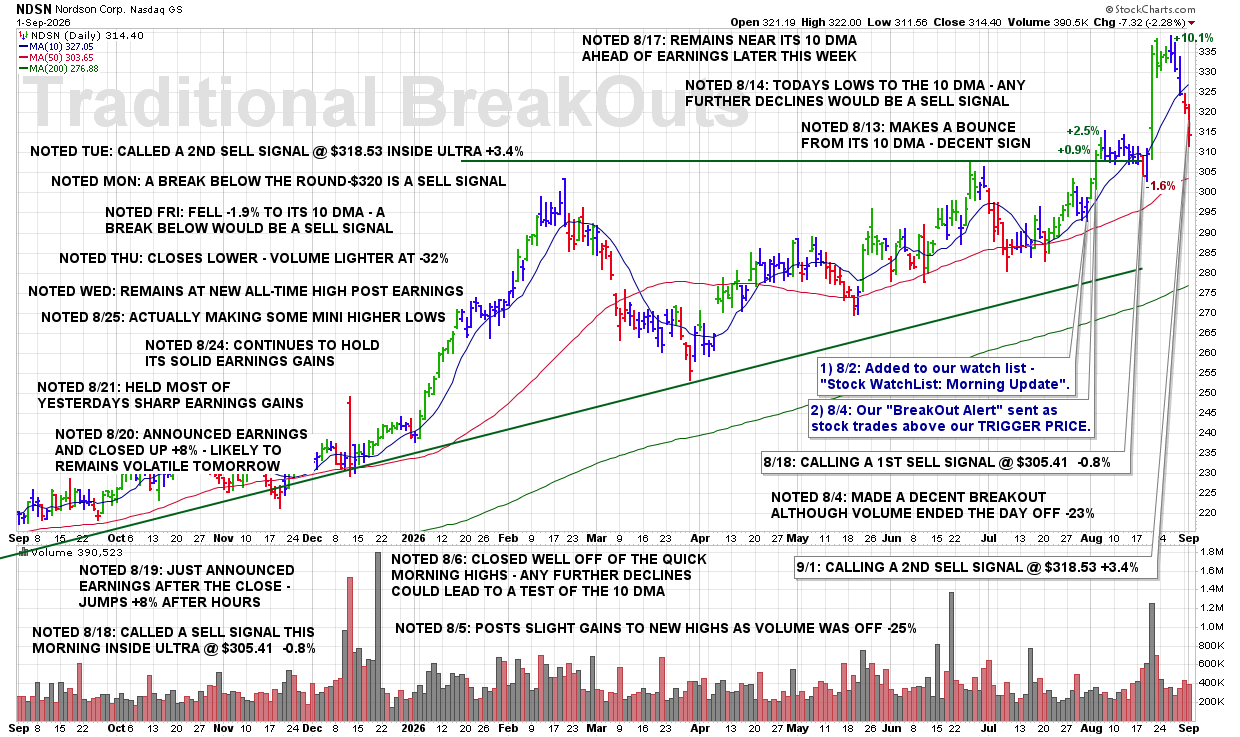
9:27 PM – Called a 2ND SELL SIGNAL this morning as shares broke below the ROUND-$320 level with what was, at the time, an increase in volume. This follows Monday’s bearish action when the stock closed below its 10 DMA. We are now seeing mounting technical weakness with multiple support violations developing.
Longer term, NDSN does remain in an overall uptrend, but the shorter-term deterioration is enough to warrant this second SELL SIGNAL. Under the guidelines, and 1/3 position remains.
As noted just in last evenings Nighty Chart Updates – A Break Below the Round-$320 Is a Sell Signal
ULTRA Trader’s Tip: Separate the Short-Term Signal From the Long-Term Trend
• A stock can remain in a longer-term uptrend while still developing meaningful short-term weakness.
• Losing the 10 DMA followed by a break below ROUND-$320 shows that the bearish evidence is building.
• Scaling out as technical violations accumulate allows us to protect gains without ignoring the stock’s broader trend.
CLICK/TAP CHART TO ZOOM
Chart services courtesy of stockcharts.com. Annotations by James Taulman.
8:50 PM – Here is our latest chart update for this recent breakout from our Traditional BreakOuts Watch List
CLICK/TAP CHART TO ZOOM
Chart services courtesy of stockcharts.com. Annotations by James Taulman.
We are currently reporting on this stock as an active holding and continue to monitor the stock closely for any technical SELL SIGNALS.
The focus always remains on price/volume action around key support levels, including the 10 DMA, 50 DMA, and any nearby trendline or ROUND-$ support.
Ongoing updates for BY will be posted at the link below, as soon as each one is made available.
https://buyingbreakouts.com/category/by/
You can bookmark the page for future reference.
1:05 PM – Calling a 3RD and FINAL SELL SIGNAL this afternoon as shares clearly break below their 50 DMA support while volume is on pace to finish above the daily average. That is a significant technical violation and completes all three SELL SIGNALS on this selection.
With each SELL SIGNAL locking in more than a +30% gain, MYE finishes as a clear winning ULTRA swing trade.
ULTRA Trader’s Tip: Scale Out and Protect a Big Winner
• The 50 DMA is an important support level, and a decisive break below it is a major technical warning.
• Scaling out through multiple SELL SIGNALS allows us to systematically protect gains as a stock weakens.
• Completing all three SELL SIGNALS with gains above +30% shows the value of letting strength work while still respecting technical violations.

CLICK/TAP CHART TO ZOOM
Chart services courtesy of stockcharts.com. Annotations by James Taulman.
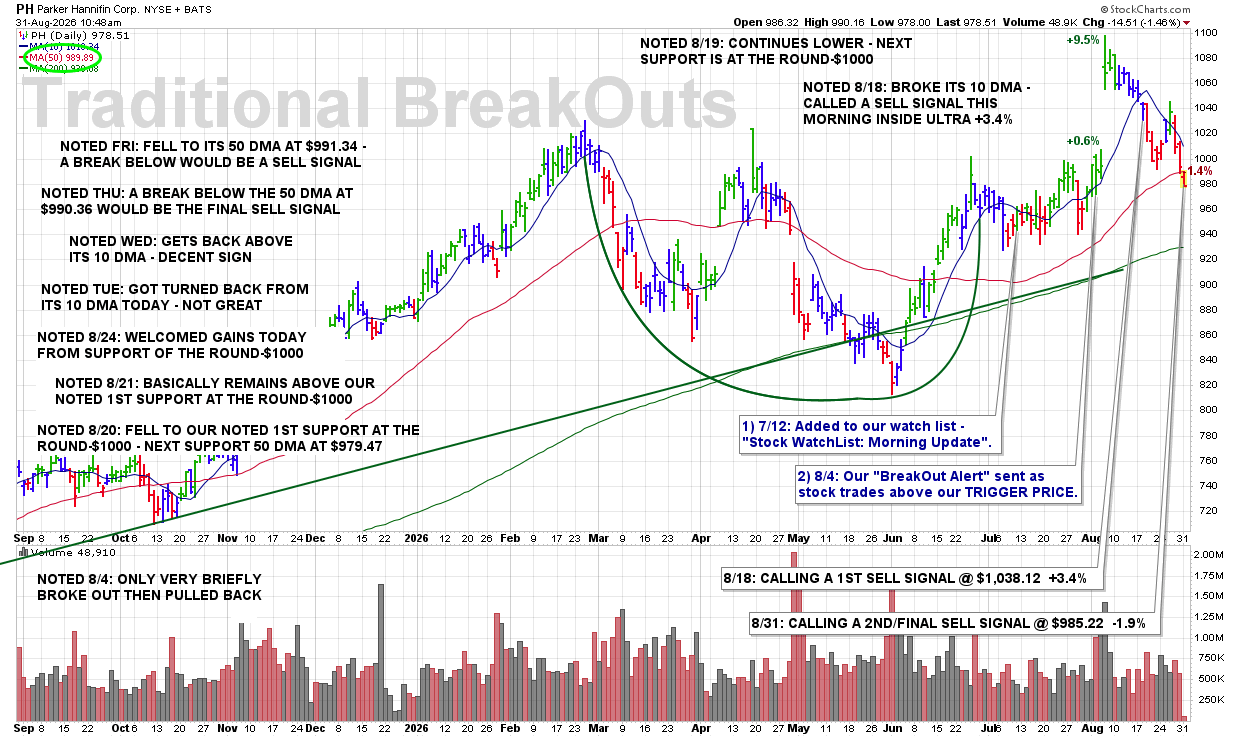
10:11 AM – Calling a 2ND and FINAL SELL SIGNAL here this morning as shares clearly break below their 50 DMA support. As noted on Friday, a break below the 50 DMA would trigger another SELL SIGNAL. That technical violation has now occurred, closing out the selection under our rules.
ULTRA Trader’s Tip: Major Support Breaks Require Action
• The 50 DMA is an important intermediate-term support level and a key line we monitor closely.
• Identifying the SELL level in advance removes emotion from the decision when that level is eventually broken.
• When the stock triggers the predetermined rule, follow the signal and move on.
CLICK/TAP CHART TO ZOOM
Chart services courtesy of stockcharts.com. Annotations by James Taulman.
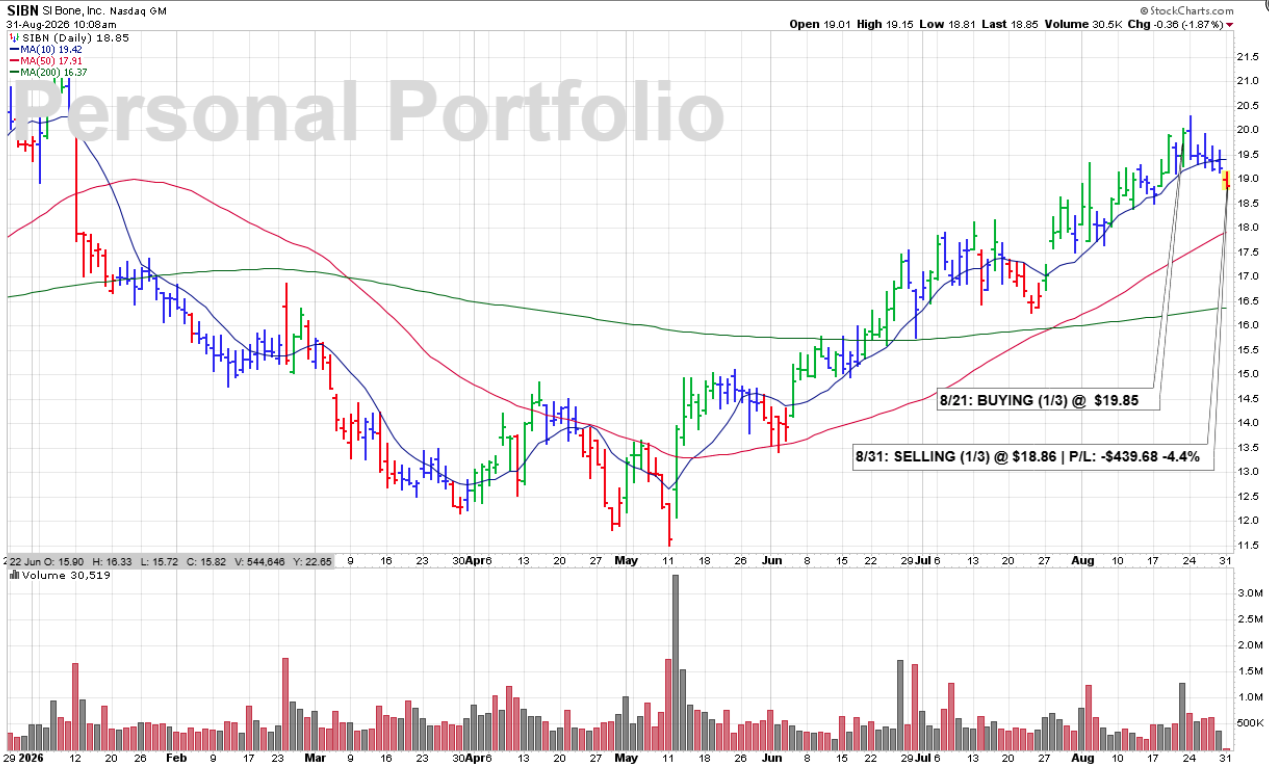
10:01 AM – Selling the last of my SIBN position here this morning as shares have been forming a series of lower highs and have now clearly broken below their 10 DMA support. The developing downtrend combined with the loss of our key short-term support is enough bearish technical evidence for me to exit the position completely.
James’ Trader’s Tip: Lower Highs Warn of Deteriorating Strength
• A series of lower highs can be an early indication that a stock is beginning to trend lower.
• A subsequent break below the 10 DMA confirms that short-term support has weakened.
• When multiple bearish signs begin stacking up, follow the technical evidence and protect capital.
CLICK/TAP CHART TO ZOOM
Chart services courtesy of stockcharts.com. Annotations by James Taulman.
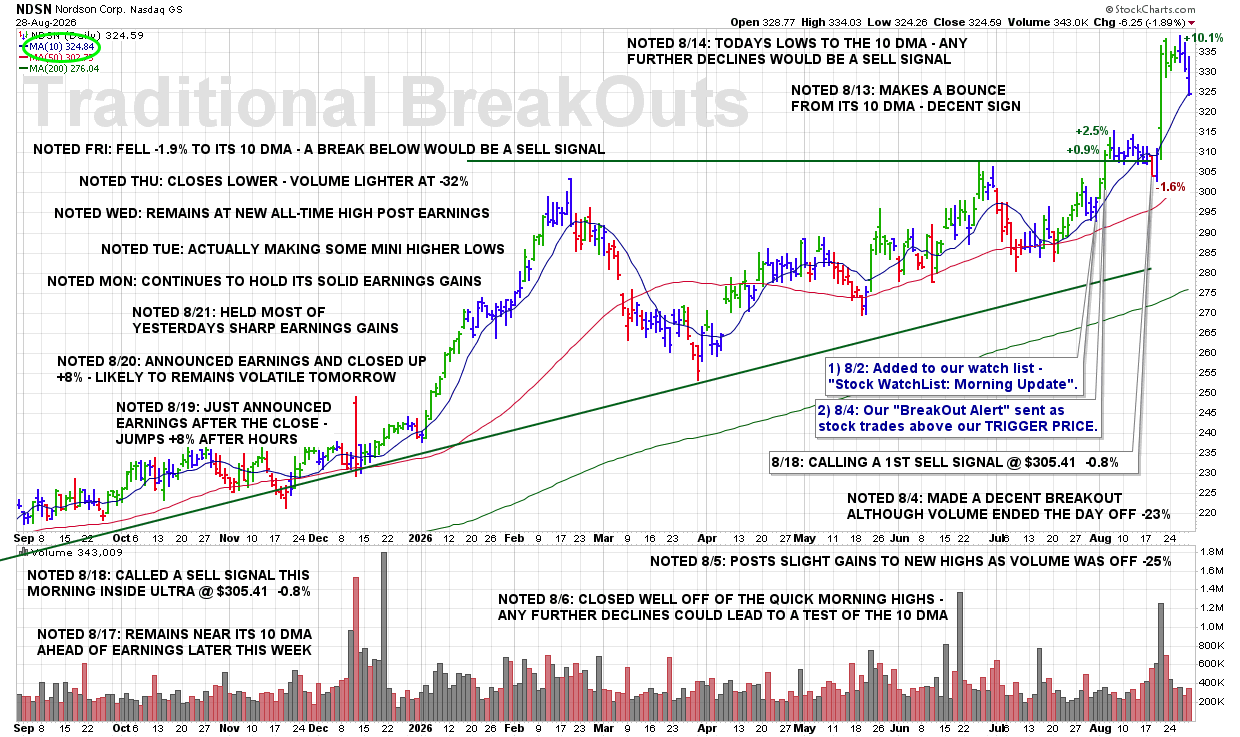
8:50 PM – Here is our latest chart update for this recent breakout from our Traditional BreakOuts Watch List
CLICK/TAP CHART TO ZOOM
Chart services courtesy of stockcharts.com. Annotations by James Taulman.
We are currently reporting on this stock as an active holding and continue to monitor the stock closely for any technical SELL SIGNALS.
The focus always remains on price/volume action around key support levels, including the 10 DMA, 50 DMA, and any nearby trendline or ROUND-$ support.
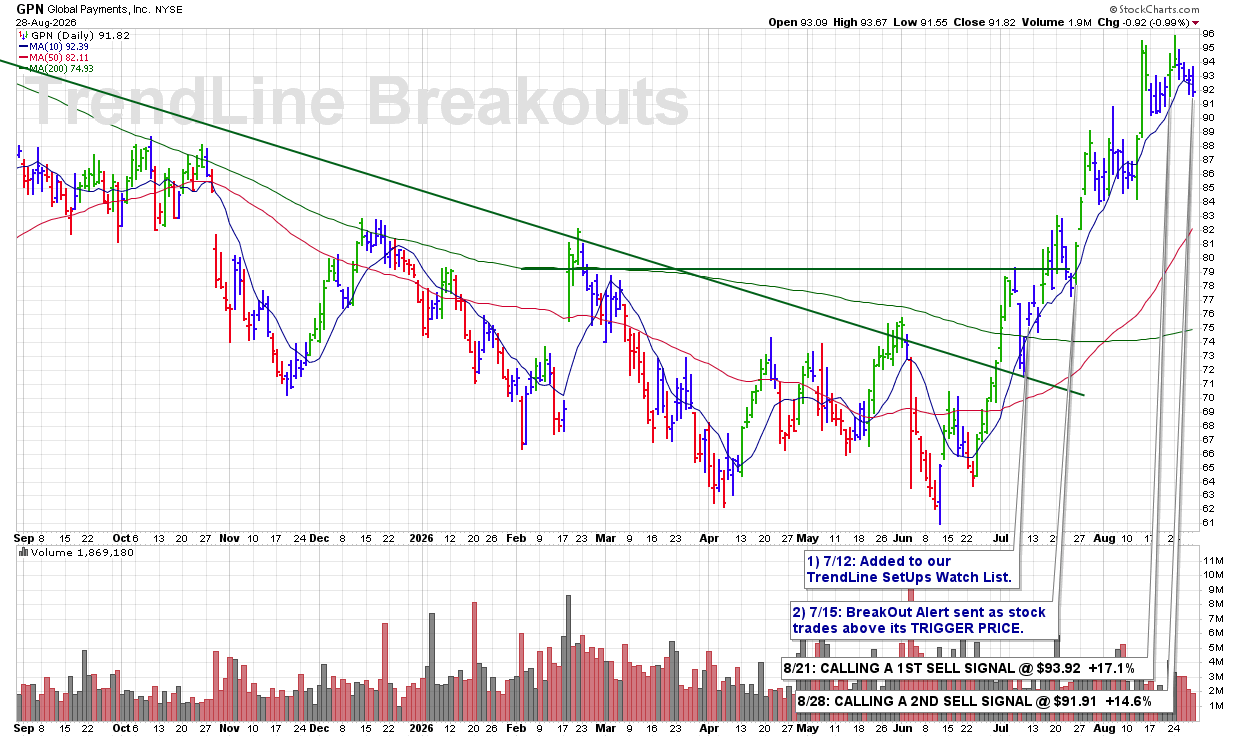
3:26 PM – Calling a 2ND SELL SIGNAL as shares are now clearly breaking below the 10 DMA while also forming a series of lower highs. That combination is a bearish technical development and can mark the beginning of a developing downtrend. With the position still showing a +14.6% gain, this is the type of weakness we want to respect rather than ignore.
ULTRA Trader’s Tip: Lower Highs Can Signal a Trend Change
• A series of lower highs shows that buyers are becoming less willing to push the stock back to previous levels.
• A break below the 10 DMA adds another important technical violation.
• When weakening price structure and a support break occur together, protect profits and follow the SELL rules.
CLICK/TAP CHART TO ZOOM
Chart services courtesy of stockcharts.com. Annotations by James Taulman.
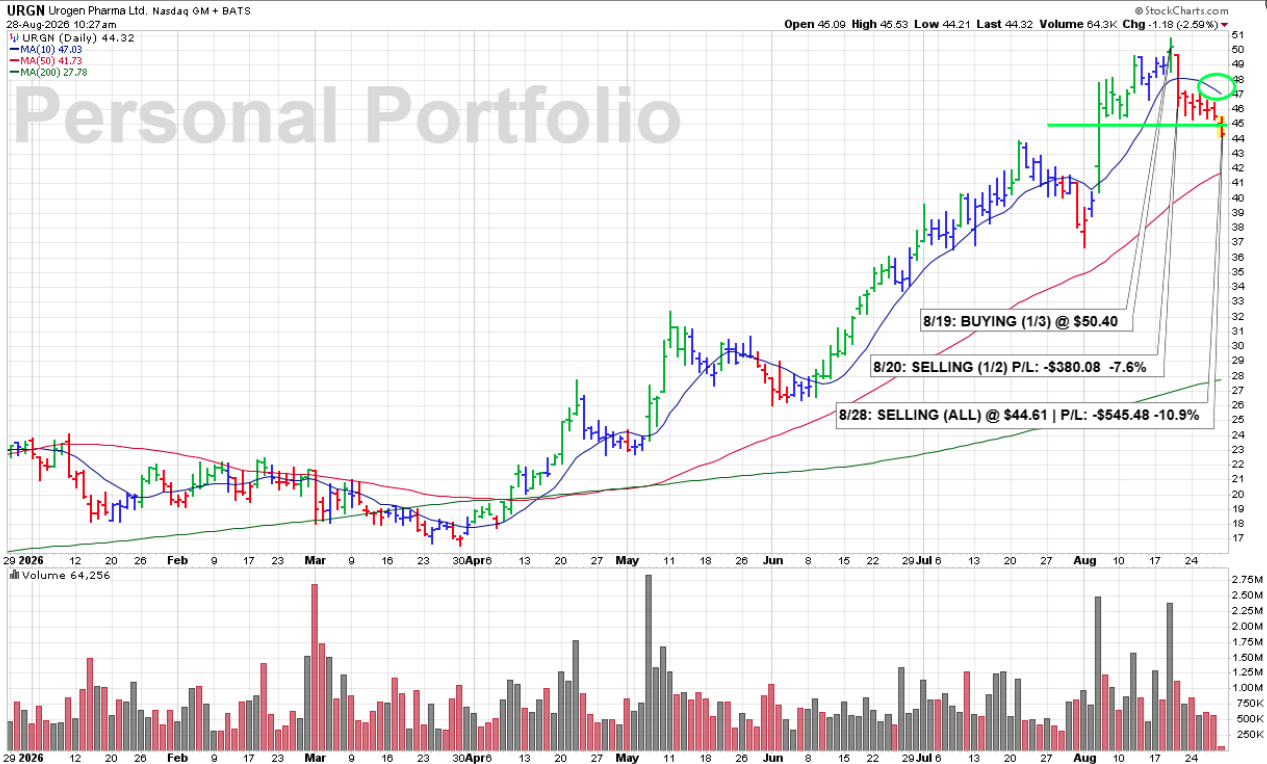
9:44 AM – Selling the back half of my URGN position here this morning and exiting the stock completely. After first breaking below the 10 DMA on 8/20, which triggered our 1ST SELL SIGNAL, shares are now falling below the ROUND-$45 level while the 10 DMA continues to roll over. Those are additional bearish technical signs, and I’m not willing to ignore the continued deterioration.
James’ Trader’s Tip: Weakness Often Builds in Stages
• The initial break below the 10 DMA was the first warning that short-term momentum had changed.
• Losing the ROUND-$45 level adds another technical violation.
• A rolling-over 10 DMA reinforces the bearish trend and supports getting completely out when weakness continues to build.
CLICK/TAP CHART TO ZOOM
Chart services courtesy of stockcharts.com. Annotations by James Taulman.
8:25 PM – Here is our latest chart update for this recent breakout from our Traditional BreakOuts Watch List.
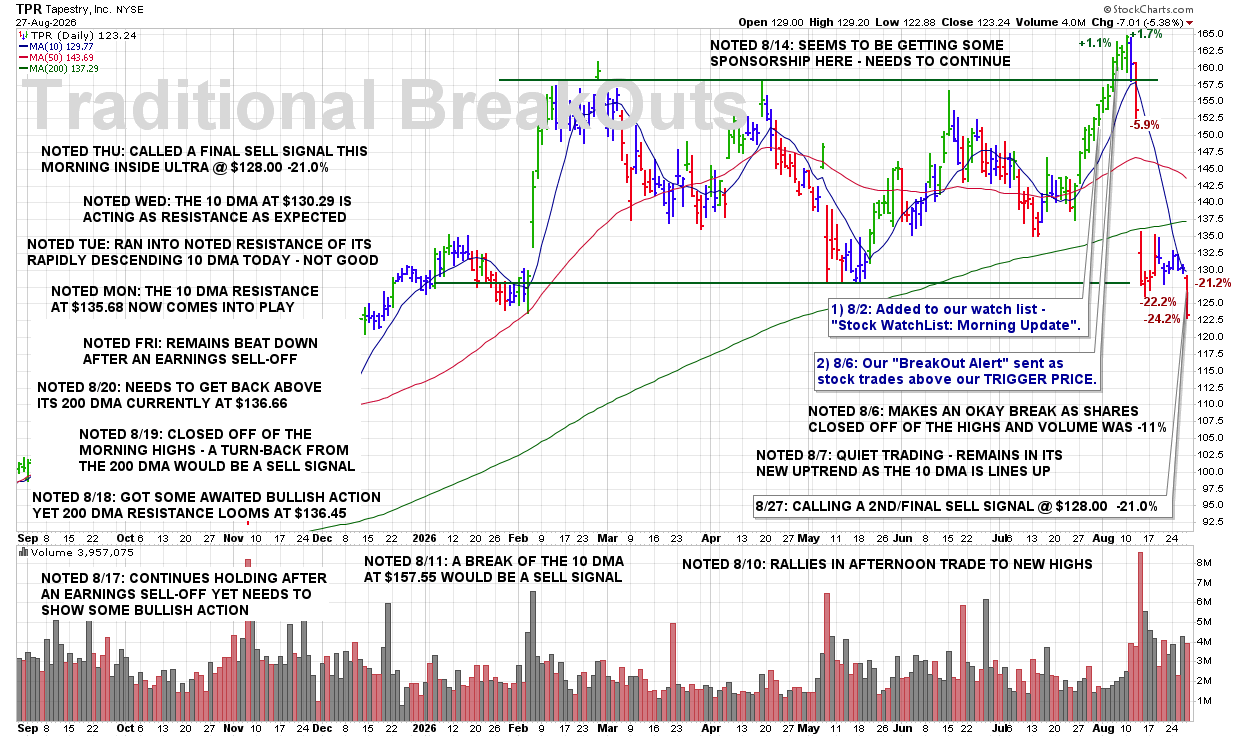
CLICK/TAP CHART TO ZOOM
Chart services courtesy of stockcharts.com. Annotations by James Taulman.
We are currently reporting on this stock as an active holding and continue to monitor the stock closely for any technical SELL SIGNALS.
The focus always remains on price/volume action around key support levels, including the 10 DMA, 50 DMA, and any nearby trendline or ROUND-$ support.
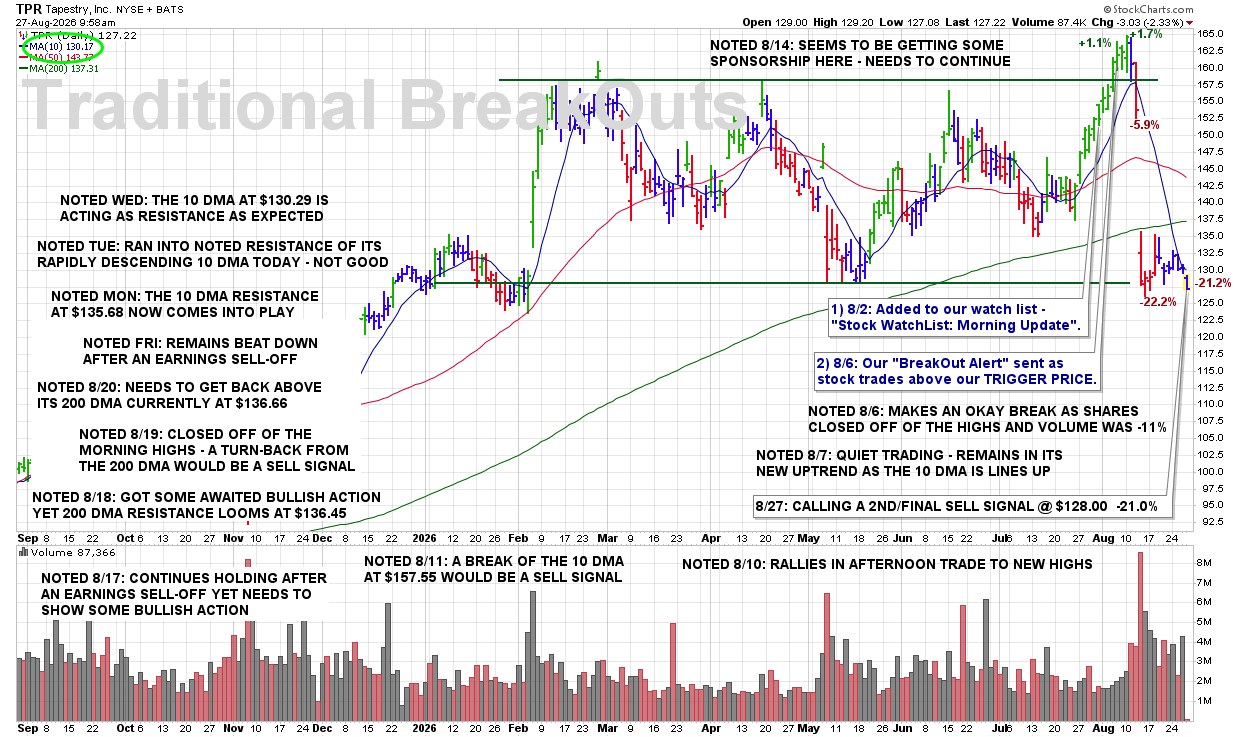
9:41 AM – Calling a 2ND and FINAL SELL SIGNAL after the stock was hit roughly 20% on earnings and has failed to develop any meaningful recovery. Shares are now being turned back from the 10 DMA, which has become the first level of resistance. Additional overhead resistance remains at the 200 DMA near $132.64, followed by the ROUND-$140 level and then the 50 DMA near $144.63. With significant technical damage and multiple layers of resistance overhead, we’re closing out coverage on this selection.
ULTRA Trader’s Tip: Former Support Can Become Resistance
• After a major breakdown, the 10 DMA can shift from support to the stock’s first resistance level.
• Multiple layers of overhead resistance make a meaningful recovery increasingly difficult.
• When a damaged stock repeatedly fails to recover, respect the technical evidence and move on.
CLICK/TAP CHART TO ZOOM
Chart services courtesy of stockcharts.com. Annotations by James Taulman.
8:30 PM – Here is our latest chart update for this recent breakout from our Traditional BreakOuts Watch List.
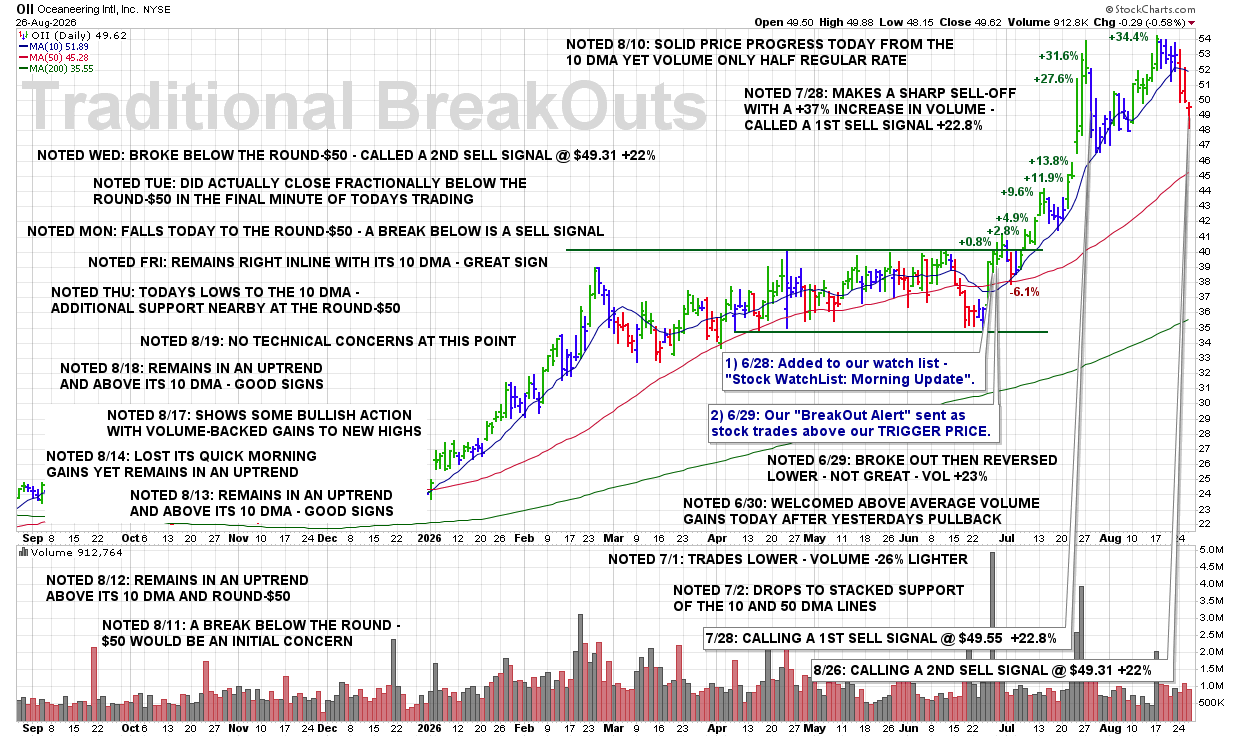
CLICK/TAP CHART TO ZOOM
Chart services courtesy of stockcharts.com. Annotations by James Taulman.
We are currently reporting on this stock as an active holding and continue to monitor the stock closely for any technical SELL SIGNALS.
The focus always remains on price/volume action around key support levels, including the 10 DMA, 50 DMA, and any nearby trendline or ROUND-$ support.
3:35 PM – Calling a 2ND SELL SIGNAL here before the close as shares continue to deteriorate technically. After recently breaking below the 10 DMA, the stock is now falling below our previously noted support at the ROUND-$50 level. That represents another technical violation under our rules.
ULTRA Trader’s Tip: One Violation Can Lead to the Next
• Losing the 10 DMA is often the first indication that short-term momentum is weakening.
• A subsequent break of another identified support level confirms that the weakness is continuing.
• Scaling out as technical violations accumulate allows you to systematically protect a substantial winner like this +22.2% gain.
CLICK/TAP CHART TO ZOOM
Chart services courtesy of stockcharts.com. Annotations by James Taulman.
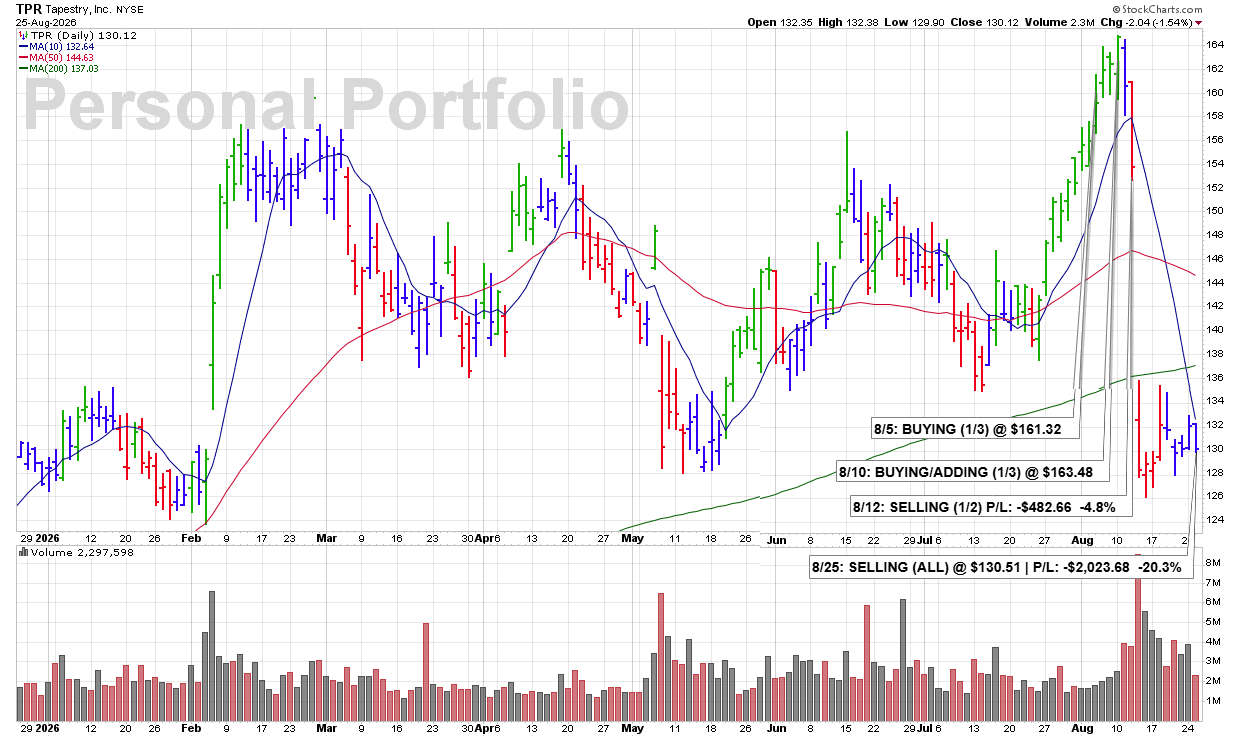
3:34 PM – Selling all my TPR here after getting hit roughly 20% on earnings and seeing no meaningful recovery develop. Shares are currently being turned back from the 10 DMA, which is now the first level of resistance. Additional resistance sits just overhead at the 200 DMA near $132.64, followed by the ROUND-$140 level and then the 50 DMA near $144.63.
At this point, there is simply too much technical damage and too much overhead resistance. I would rather redeploy this capital into a fresh breakout or BUY SIGNAL showing substantially better technical conditions.
James’ Trader’s Tip: Capital Has an Opportunity Cost
• A deeply damaged stock may require significant time just to work through multiple layers of overhead resistance.
• Even if a recovery eventually develops, that capital may be tied up while stronger opportunities emerge elsewhere.
• Sometimes the best decision is not waiting for a damaged position to recover—it is moving the money into a stock with a cleaner technical setup.
CLICK/TAP CHART TO ZOOM
Chart services courtesy of stockcharts.com. Annotations by James Taulman.
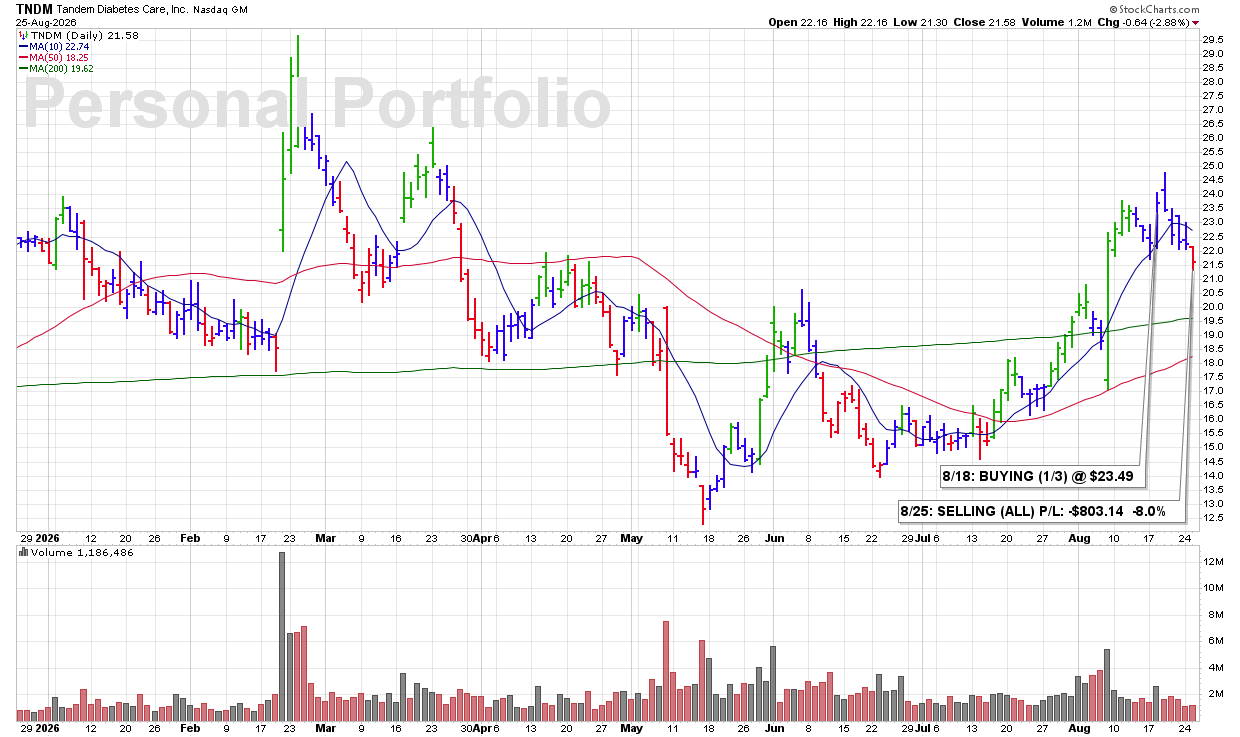
10:06 AM – Getting out of TNDM this morning as the technical picture continues to deteriorate. Shares have been (1) posting a series of lower highs, (2) making new recent lows, and (3) trading with the 10 DMA now clearly rolling over. At the same time, my loss has reached roughly 8%, which is about as far as I generally allow a position to move against me under my risk-management guidelines. I’m exiting here and protecting capital.
ULTRA Trader’s Tip: Respect Your Maximum Loss
• Lower highs and new lows show that the stock is moving in the wrong direction.
• A rolling-over 10 DMA confirms that short-term momentum is deteriorating.
• Once a loss reaches your predetermined threshold, discipline matters more than hope—take the loss and move on.
CLICK/TAP CHART TO ZOOM
Chart services courtesy of stockcharts.com. Annotations by James Taulman.
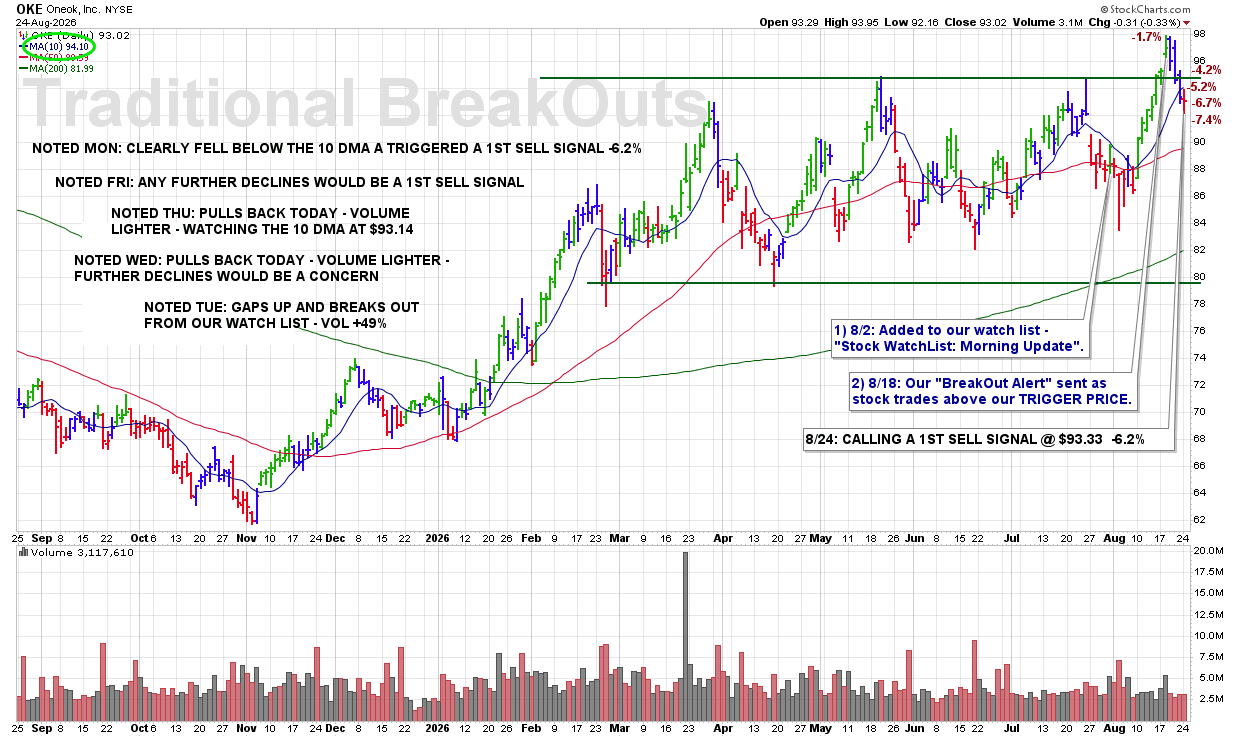
8:30 PM – Here is our latest chart update for this recent breakout from our Traditional BreakOuts Watch List.
CLICK/TAP CHART TO ZOOM
Chart services courtesy of stockcharts.com. Annotations by James Taulman.
We are currently reporting on this stock as an active holding and continue to monitor the stock closely for any technical SELL SIGNALS.
The focus always remains on price/volume action around key support levels, including the 10 DMA, 50 DMA, and any nearby trendline or ROUND-$ support.
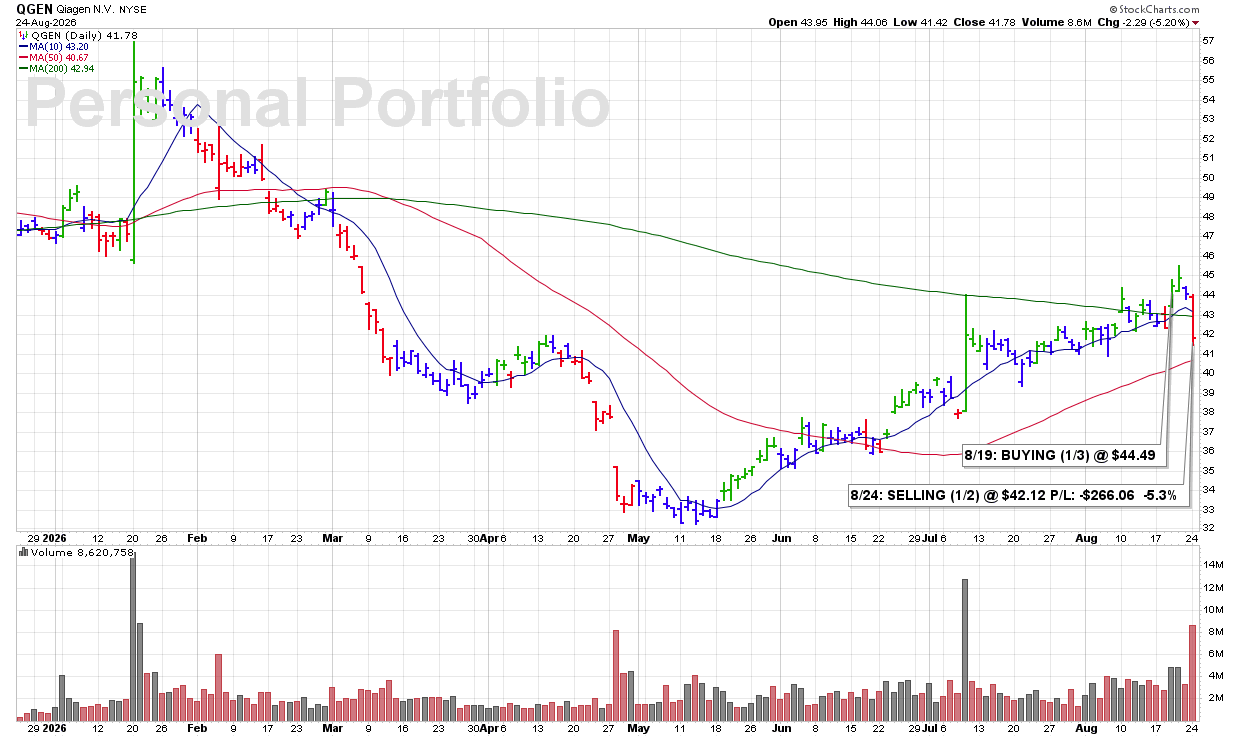
3:27 PM – Selling half my QGEN position here as shares break below the 10 DMA while volume runs 177% above average. That combination of a key support violation and extremely heavy selling volume represents bearish technical action I cannot ignore, so I’m reducing the position here.
James’ Trader’s Tip: Heavy Volume Makes Weakness More Meaningful
• A break below the 10 DMA is already a technical warning.
• When that break occurs on dramatically increased volume, it suggests much stronger selling pressure.
• Reducing exposure quickly when price and volume both turn bearish helps keep risk under control.
CLICK/TAP CHART TO ZOOM
Chart services courtesy of stockcharts.com. Annotations by James Taulman.
3:17 PM – Calling a 1ST SELL SIGNAL as the stock has clearly broken below its 10 DMA. That loss of our key short-term support level is a technical violation and a default SELL SIGNAL under our rules.
ULTRA Trader’s Tip: Follow the Rule, Not the Emotion
• The 10 DMA is one of our primary technical guideposts.
• A clear break below that line tells us the technical condition has changed.
• Predetermined SELL rules eliminate guesswork—when the violation occurs, respect the signal.
CLICK/TAP CHART TO ZOOM
Chart services courtesy of stockcharts.com. Annotations by James Taulman.
3:14 PM – Calling a 3RD and FINAL SELL SIGNAL here before the close as shares dip into their 50 DMA support after already showing several bearish technical signs. With weakness continuing to build and major support now being tested, I’m closing out this selection under our rules.
ULTRA Trader’s Tip: Multiple Weakness Signals Add Up
• One bearish sign may be manageable, but several technical violations together deserve more attention.
• A test of the 50 DMA becomes more significant when the stock has already been showing ongoing weakness.
• When bearish evidence continues to stack up, follow the rules and reduce exposure.

CLICK/TAP CHART TO ZOOM
Chart services courtesy of stockcharts.com. Annotations by James Taulman.
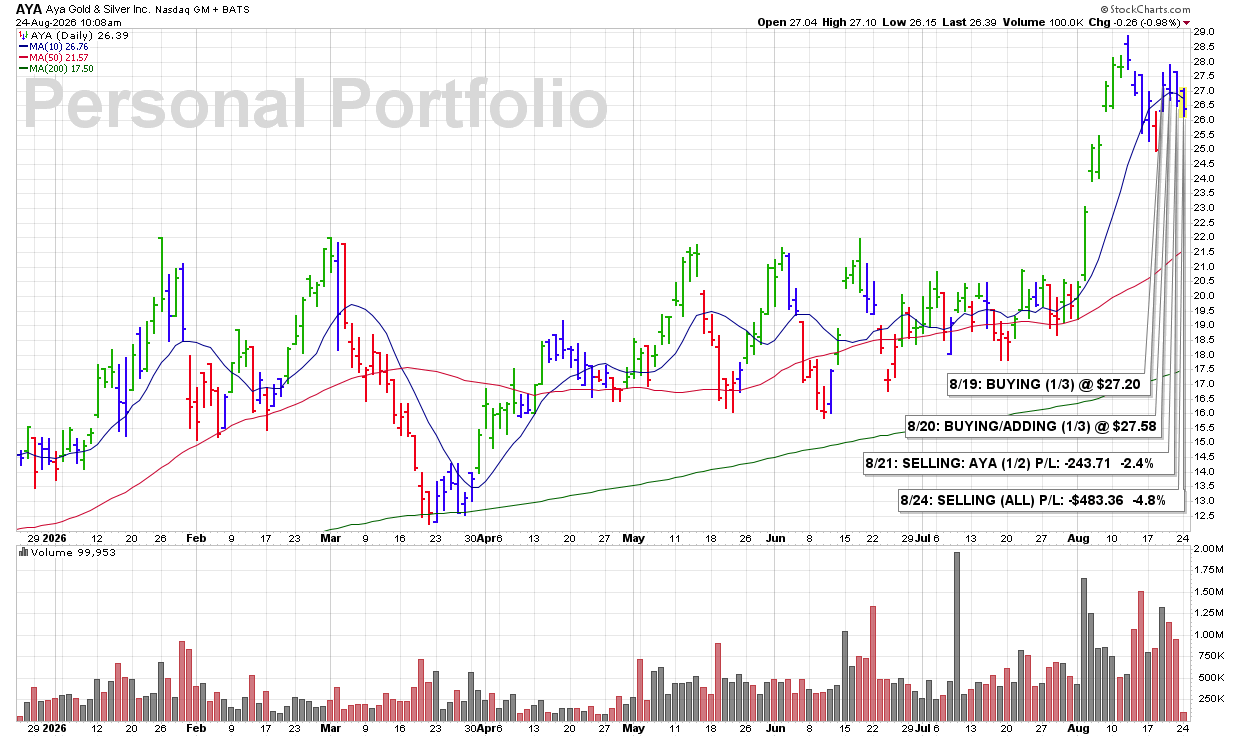
10:03 AM – Selling my remaining 1/2 position in AYA as the stock continues to exhibit bearish technical action. Today’s move is essentially another turnback from the 10 DMA, with shares printing new recent lows while trading lower on increased volume. With multiple signs of weakness continuing to stack up, I’m fully exiting the position here.
James’ Trader’s Tip: Ongoing Weakness Is a Sell Signal
• Repeated rejection at the 10 DMA shows that former support has become resistance.
• New recent lows confirm that downside pressure remains in control.
• When bearish price action continues on increasing volume, the technical evidence is telling you to reduce exposure.
CLICK/TAP CHART TO ZOOM
Chart services courtesy of stockcharts.com. Annotations by James Taulman.
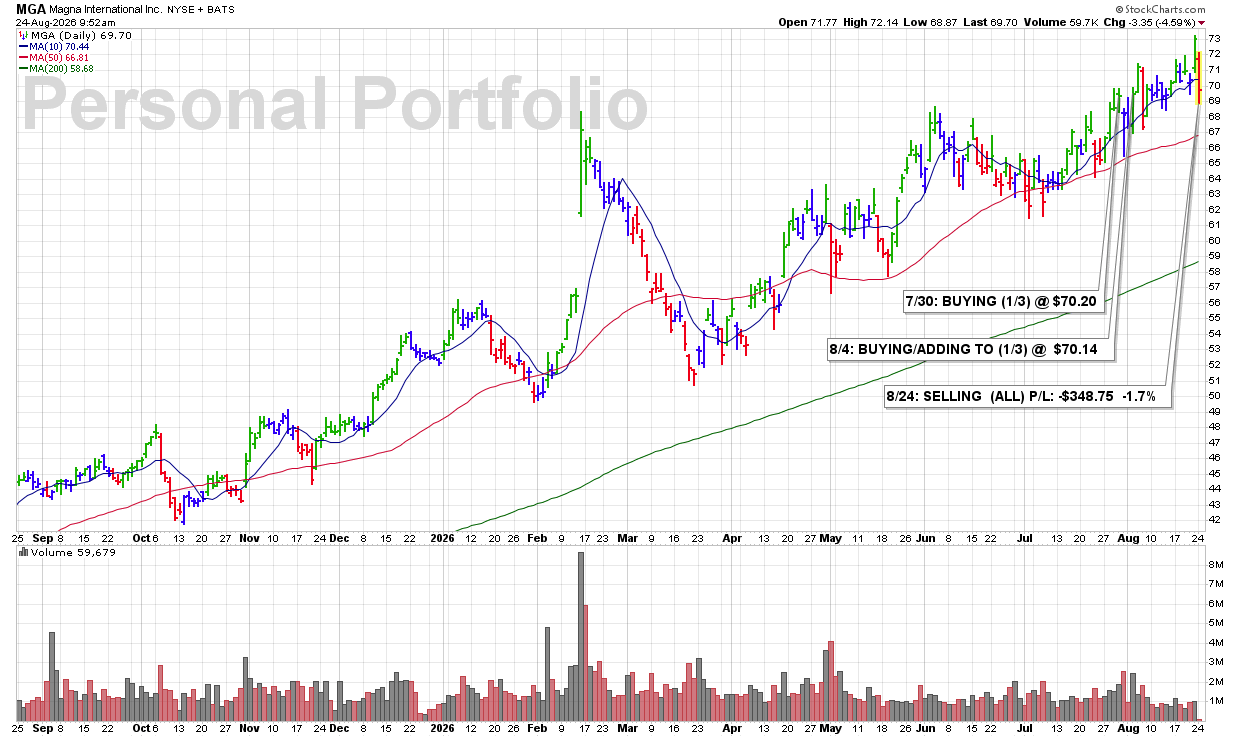
9:41 AM – Selling all my MGA shares quickly this morning as the stock sells off sharply on a huge increase in volume and breaks below the ROUND-$70 support level. The combination of heavy selling pressure, a key support violation, and expanding volume is enough technical deterioration for me to exit the position and move on.
James’ Trader’s Tip: Sharp Selling on Heavy Volume Demands Action
• A break below a key support level is already a technical warning.
• When that break comes with a major increase in volume, the signal becomes much more meaningful.
• Heavy-volume weakness should be respected quickly before a manageable loss has the chance to become something larger.
CLICK/TAP CHART TO ZOOM
Chart services courtesy of stockcharts.com. Annotations by James Taulman.
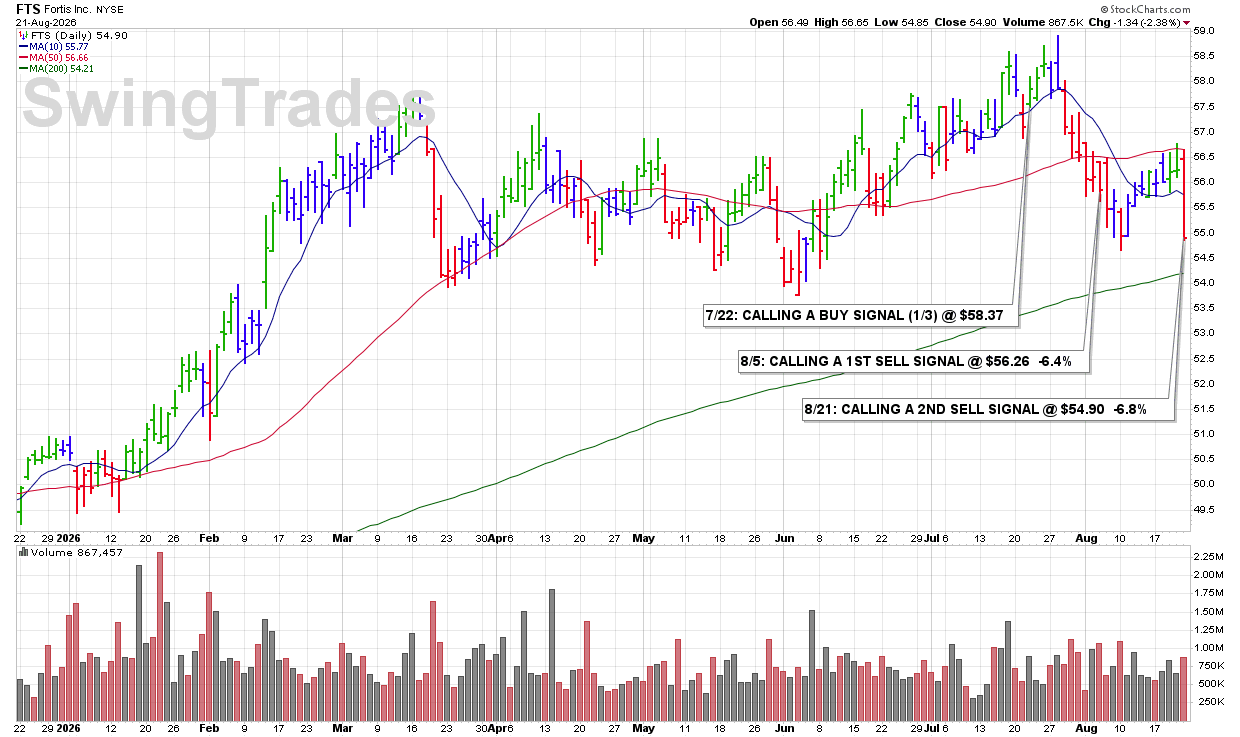
3:59 PM – Calling a 2ND and FINAL SELL SIGNAL just before the close as shares sell off this afternoon and break below the ROUND-$55 support level while volume runs 28% above average. The combination of continued price weakness, a loss of support, and increased selling volume confirms further technical deterioration and closes out coverage on this selection.
ULTRA Trader’s Tip: Increased Volume Confirms the Weakness
• Breaking a previously identified support level is an important technical violation.
• When that break occurs on above-average volume, it adds conviction to the bearish action.
• When price and volume confirm continued weakness, follow the signal and move on.
CLICK/TAP CHART TO ZOOM
Chart services courtesy of stockcharts.com. Annotations by James Taulman.
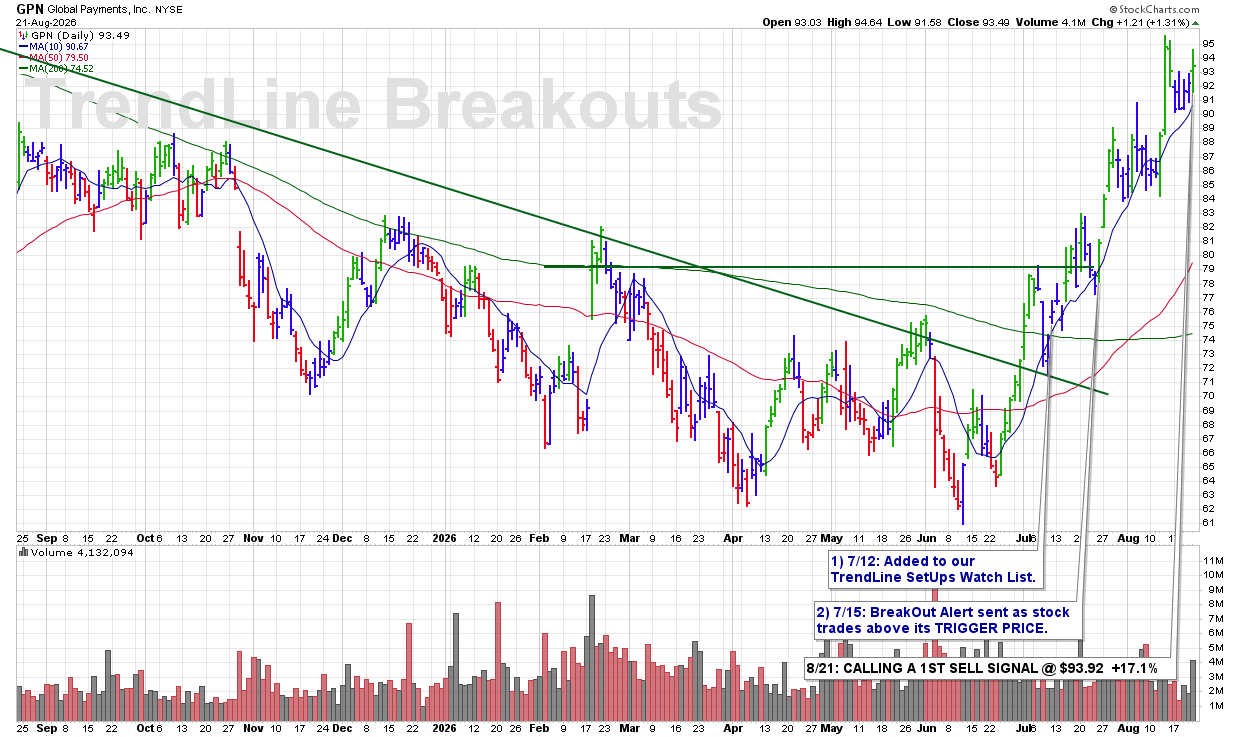
8/21 FRI: GPN – CALLING A 1ST SELL SIGNAL @ $93.92 +17.1%
3:58 PM – XXXX
CLICK/TAP CHART TO ZOOM
Chart services courtesy of stockcharts.com. Annotations by James Taulman.
3:55 PM – Selling the remainder of my GPN position as we head into the close. Shares are trading higher this afternoon, but volume is running below average, which takes some conviction out of the move. With a solid +16.6% gain still intact, I’m locking in the rest of the profit and moving on.
James’ Trader’s Tip: Price Strength Is Better When Volume Confirms It
• A stock can move higher on light volume, but the move carries less technical conviction.
• When volume fails to confirm a price advance, it can be a good opportunity to protect profits.
• Strong gains are worth protecting—especially when the technical evidence begins to lose some strength.

CLICK/TAP CHART TO ZOOM
Chart services courtesy of stockcharts.com. Annotations by James Taulman.
3:38 PM – Selling half of my AYA position here before the close as shares fall below the 10 DMA on a 38% increase in volume. That combination of a key support violation and heavier selling volume is bearish technical action I do not want to ignore, so I’m reducing exposure here.
James’ Trader’s Tip: Reduce Risk When Price and Volume Turn Bearish
• A break below the 10 DMA is an important technical warning.
• Increased volume on the decline gives the weakness more significance.
• Selling part of the position allows you to reduce risk while still leaving room for the stock to recover.

CLICK/TAP CHART TO ZOOM
Chart services courtesy of stockcharts.com. Annotations by James Taulman.
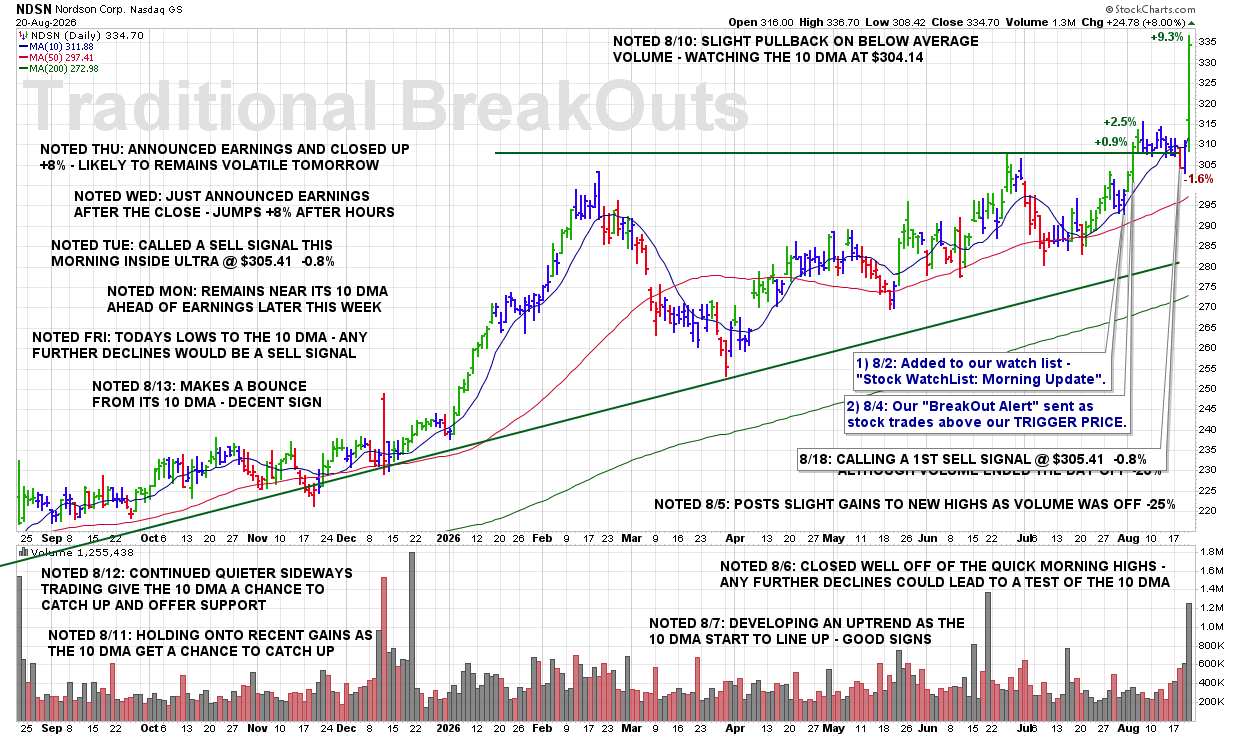
8:20 PM – Here is our latest chart update for this recent breakout from our Traditional BreakOuts Watch List
CLICK/TAP CHART TO ZOOM
Chart services courtesy of stockcharts.com. Annotations by James Taulman.
We are currently reporting on this stock as an active holding and continue to monitor the stock closely for any technical SELL SIGNALS.
The focus always remains on price/volume action around key support levels, including the 10 DMA, 50 DMA, and any nearby trendline or ROUND-$ support.
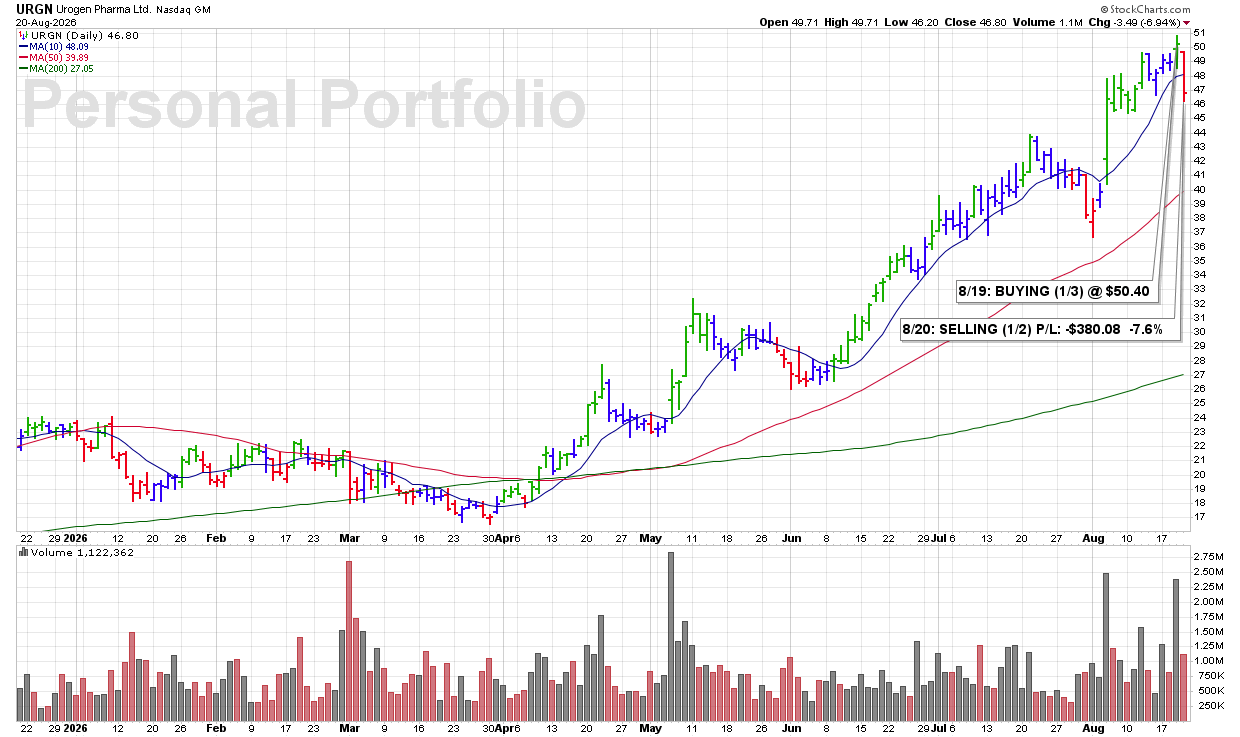
3:44 PM – Selling half of my URGN position here as shares have clearly broken below their 10 DMA support. That is a technical violation and a SELL SIGNAL under our rules. I’m reducing the position here rather than ignoring the weakness.
James’ Trader’s Tip: Respect the Technical Violation
• A clear break below the 10 DMA tells us that important short-term support has failed.
• Once a stock violates a key technical level, the rules—not hope—should determine our response.
• Selling part of the position immediately reduces risk while giving the remaining shares an opportunity to recover.
CLICK/TAP CHART TO ZOOM
Chart services courtesy of stockcharts.com. Annotations by James Taulman.
3:44 PM – Selling half of my ECPG position here as shares gap lower and break below the 10 DMA. That loss of our key short-term support is a clear technical violation and a SELL SIGNAL under our rules.
James’ Trader’s Tip: Respect the 10 DMA
• The 10 DMA is our primary technical indicator for identifying changes in short-term price strength.
• A decisive break below the line signals that the stock’s technical condition is weakening.
• Scaling out allows us to reduce risk immediately while leaving part of the position in place if the stock recovers.

CLICK/TAP CHART TO ZOOM
Chart services courtesy of stockcharts.com. Annotations by James Taulman.
9:20 PM – Here is our latest chart update for this recent breakout from our Traditional BreakOuts Watch List

CLICK/TAP CHART TO ZOOM
Chart services courtesy of stockcharts.com. Annotations by James Taulman.
We are currently reporting on this stock as an active holding and continue to monitor the stock closely for any technical SELL SIGNALS.
The focus always remains on price/volume action around key support levels, including the 10 DMA, 50 DMA, and any nearby trendline or ROUND-$ support.
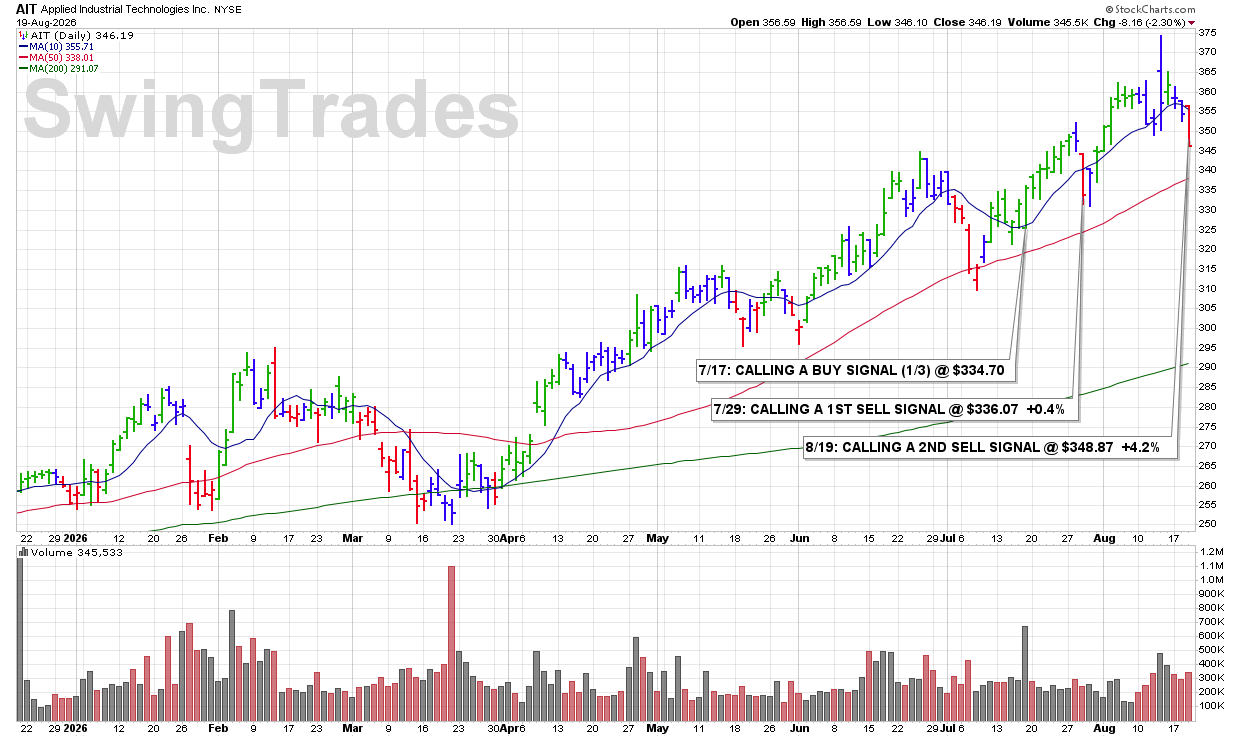
3:36 PM – Calling a 2ND SELL SIGNAL as shares break below our noted 1st SUPPORT at the ROUND-$350 level and appear set to close near the session lows. The next significant support is the 50 DMA, currently at $338.46, approximately 2.3% below the current price. A break of that level would represent another significant technical violation.
ULTRA Trader’s Tip: Support Levels Give Us a Roadmap
• Identifying support levels in advance removes guesswork when a stock begins weakening.
• When one level fails, immediately know where the next important technical support lies.
• If weakness continues and the next major support level also breaks, that provides additional evidence to reduce exposure.
CLICK/TAP CHART TO ZOOM
Chart services courtesy of stockcharts.com. Annotations by James Taulman.
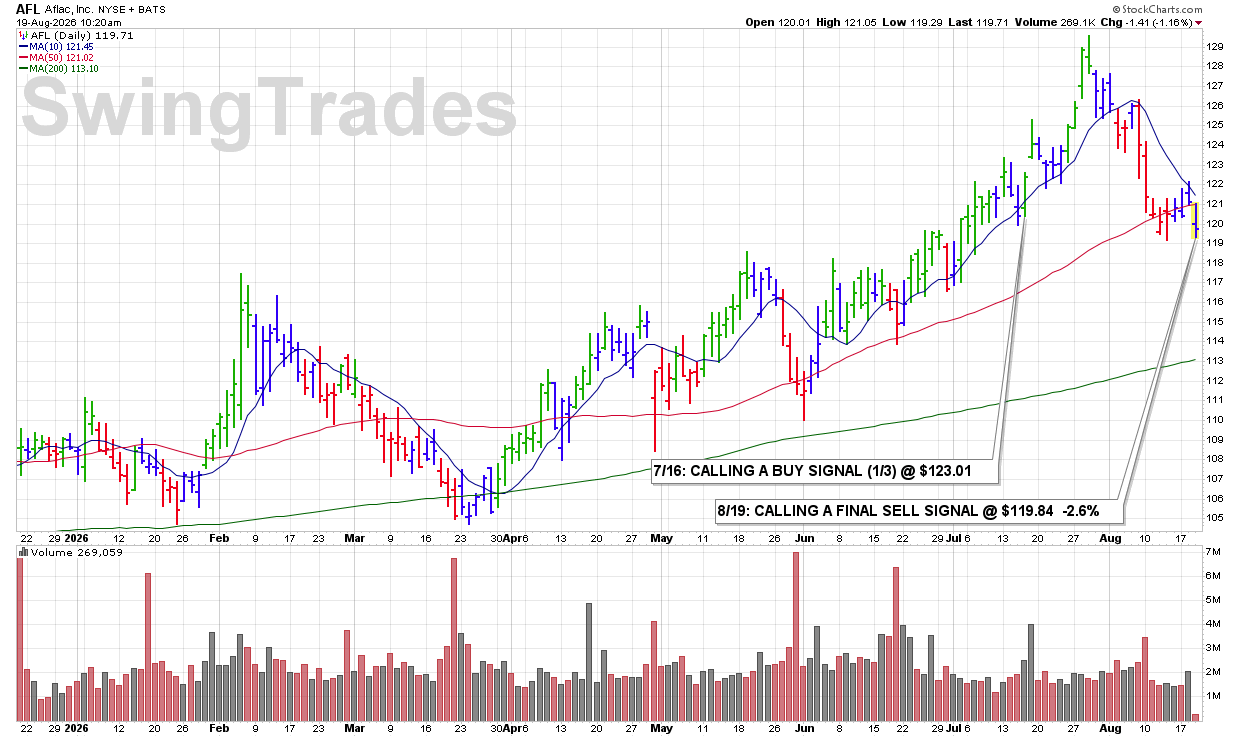
10:11 AM – The stock is gapping down this morning and breaking below our previously noted ROUND-$120 support on increased volume. The combination of a gap lower, loss of support, and expanding selling volume represents multiple bearish technical violations. Calling a 2ND yet FINAL SELL SIGNAL here and to close out coverage on this selection.
ULTRA Trader’s Tip: Multiple Violations Strengthen the Signal
• A gap lower immediately shows increased selling pressure.
• Breaking a previously identified support level adds another bearish technical violation.
• When weakness is accompanied by increased volume, the evidence becomes even stronger—respect the signal and move on.
CLICK/TAP CHART TO ZOOM
Chart services courtesy of stockcharts.com. Annotations by James Taulman.
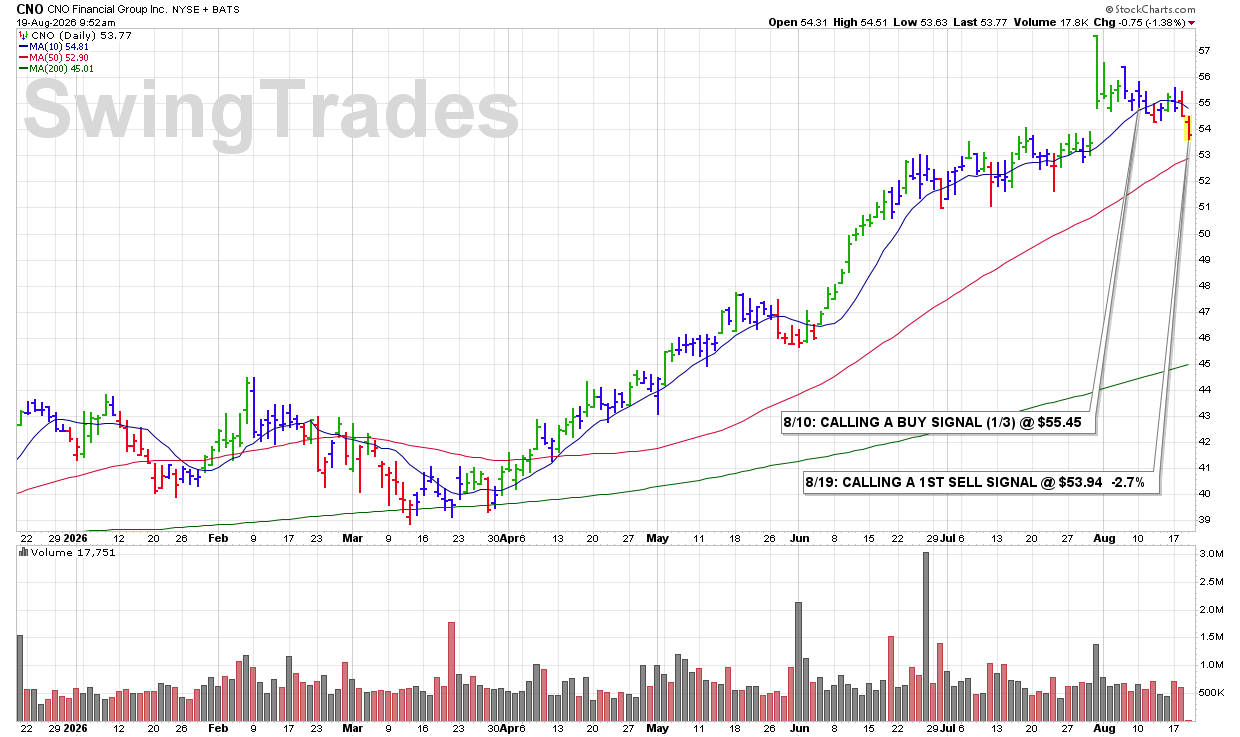
9:37 AM – Calling a 1ST SELL SIGNAL this morning as shares sell off on increased volume and clearly lose support at the 10 DMA. That combination of declining price, expanding volume, and a break of our primary technical support level represents a standard SELL SIGNAL under our rules.
ULTRA Trader’s Tip: Price and Volume Should Confirm Each Other
• A break below the 10 DMA is an important technical warning.
• When that break occurs with increased selling volume, the violation carries greater significance.
• Responding to weakness early helps keep a manageable loss from developing into something larger.
CLICK/TAP CHART TO ZOOM
Chart services courtesy of stockcharts.com. Annotations by James Taulman.
9:20 PM – Here is our latest chart update for this recent breakout from our Traditional BreakOuts Watch List

CLICK/TAP CHART TO ZOOM
Chart services courtesy of stockcharts.com. Annotations by James Taulman.
We are currently reporting on this stock as an active holding and continue to monitor the stock closely for any technical SELL SIGNALS.
The focus always remains on price/volume action around key support levels, including the 10 DMA, 50 DMA, and any nearby trendline or ROUND-$ support.
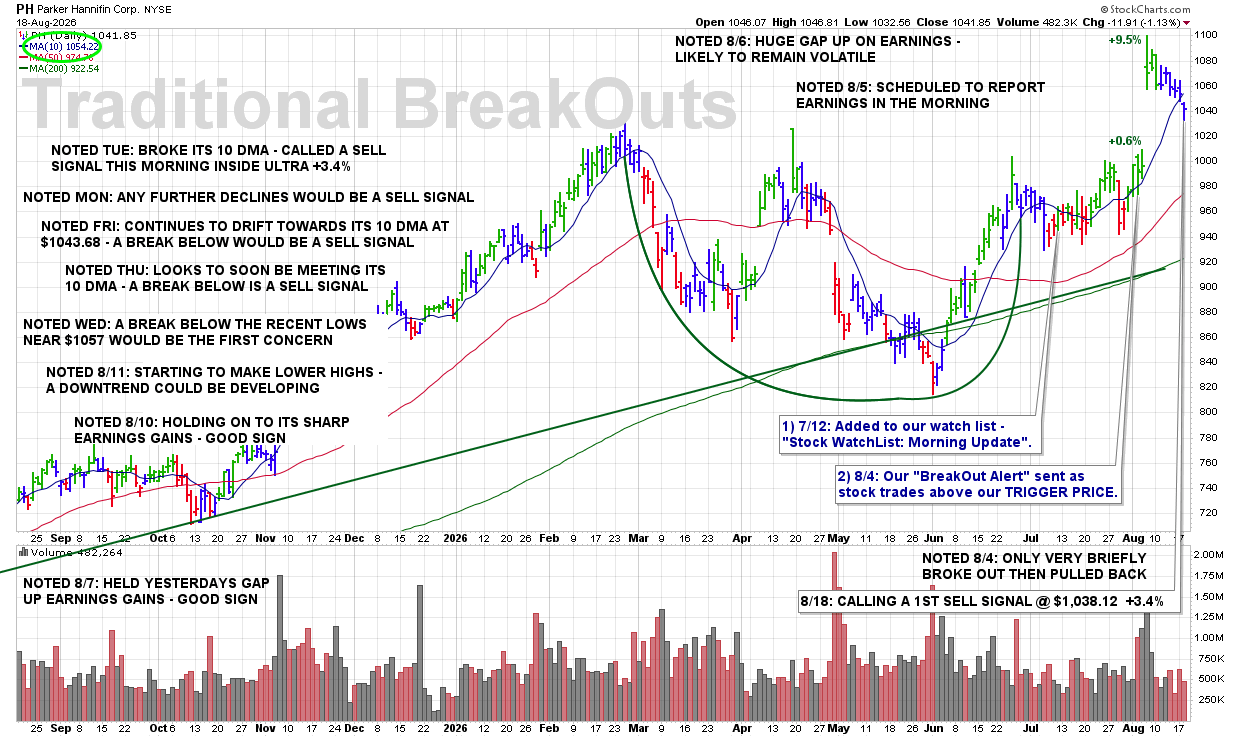
9:15 PM – Here is our latest chart update for this recent breakout from our Traditional BreakOuts Watch List
CLICK/TAP CHART TO ZOOM
Chart services courtesy of stockcharts.com. Annotations by James Taulman.
We are currently reporting on this stock as an active holding and continue to monitor the stock closely for any technical SELL SIGNALS.
The focus always remains on price/volume action around key support levels, including the 10 DMA, 50 DMA, and any nearby trendline or ROUND-$ support.
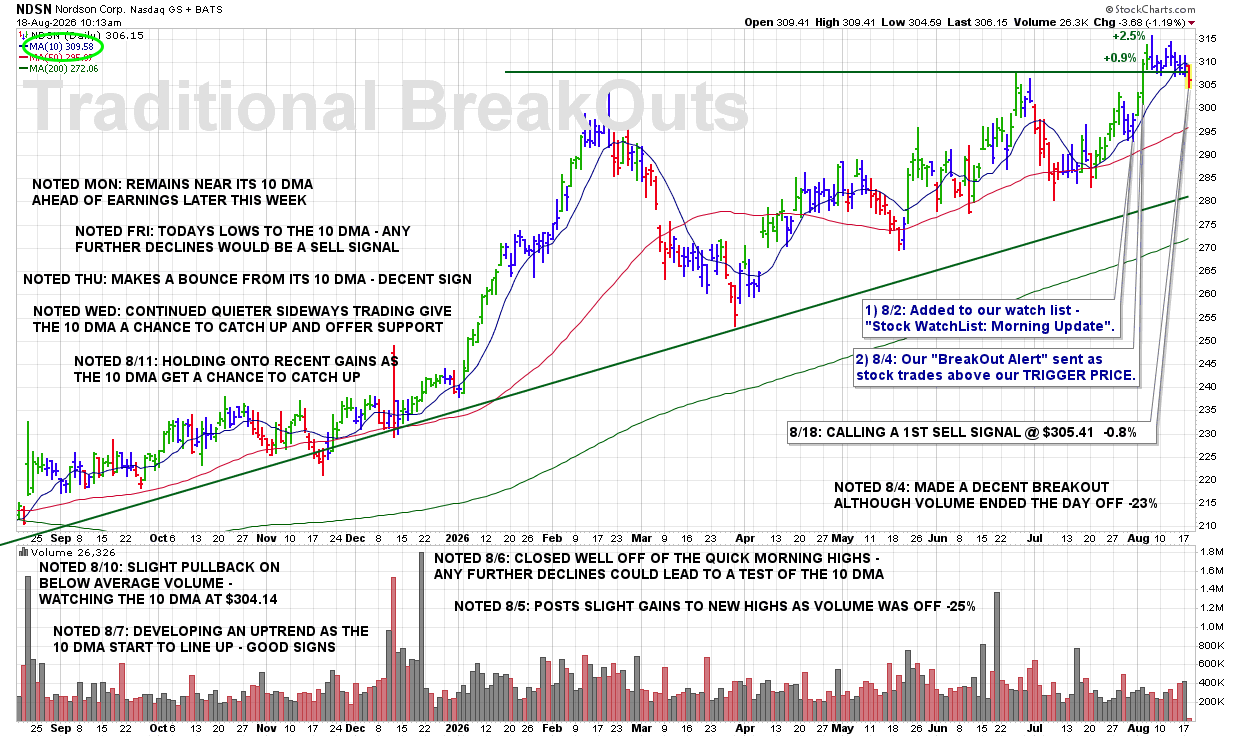
10:05 AM – Calling a 1ST SELL SIGNAL this morning on NDSN as shares have been developing a series of lower highs and are now clearly breaking below the 10 DMA. That break represents a technical violation and triggers a standard SELL SIGNAL under our rules.
ULTRA Trader’s Tip: Lower Highs Often Warn Before the Break
• A series of lower highs shows that each rally attempt is losing strength.
• Once price then breaks below the 10 DMA, the weakening pattern becomes more significant.
• Recognizing deterioration early allows you to reduce exposure before additional technical damage develops.
CLICK/TAP CHART TO ZOOM
Chart services courtesy of stockcharts.com. Annotations by James Taulman.
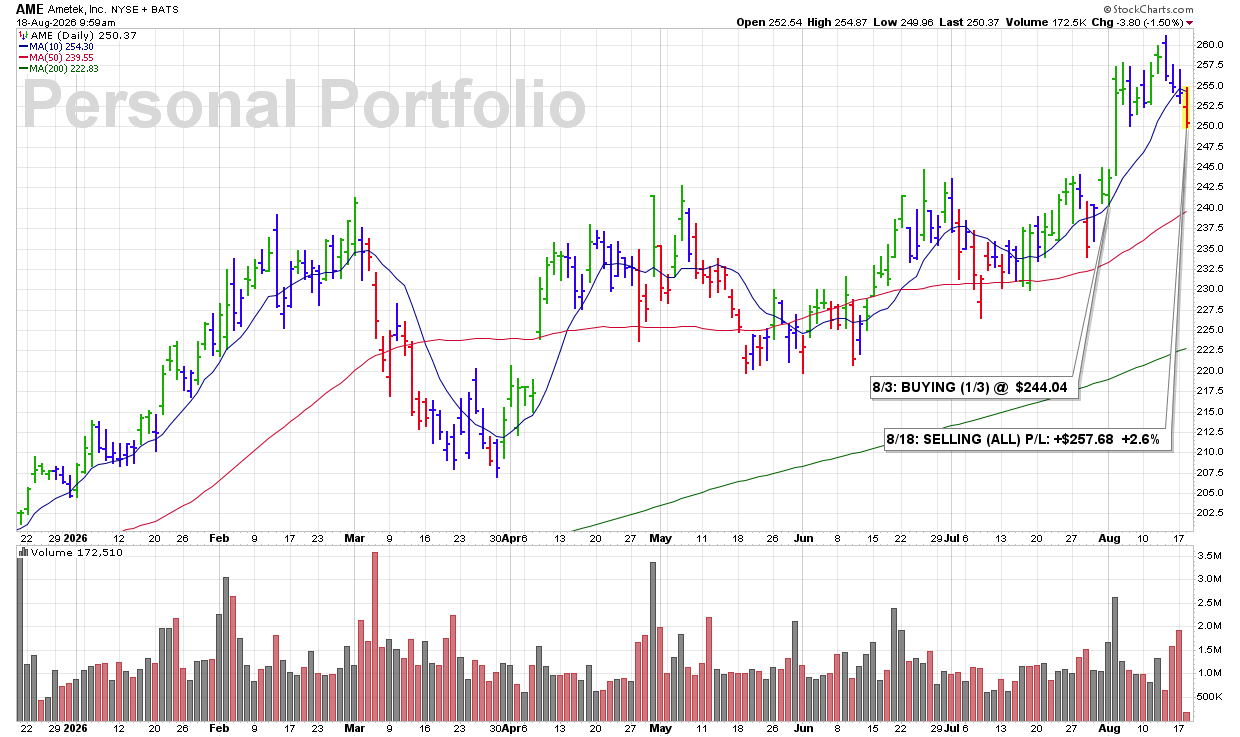
9:56 AM – Selling all my AME shares this morning as the stock is clearly breaking below the 10 DMA. That loss of short-term support is a technical violation, and with a modest profit still intact, I’m locking in the gain and moving on.
James’ Trader’s Tip: Protect Even Small Profits
• A profit does not have to be large to be worth protecting.
• When a stock breaks a key support level like the 10 DMA, the technical picture has changed.
• Taking a small gain and freeing up capital is better than allowing a winning trade to turn into a loss.
CLICK/TAP CHART TO ZOOM
Chart services courtesy of stockcharts.com. Annotations by James Taulman.
9:56 AM – Selling all of my NDSN here this morning as shares have been developing a series of lower highs and are now clearly breaking below the 10 DMA. With bearish technical action continuing to build, I’m taking this very small loss and moving on rather than waiting for possible additional deterioration.
James’ Trader’s Tip: Small Losses Are Part of the System
• Not every BUY SIGNAL will develop into a winning trade.
• When the technical evidence changes, there is no reason to stay committed to the original decision.
• Taking a small loss quickly keeps capital available for the next opportunity and prevents an insignificant loss from becoming significant.

CLICK/TAP CHART TO ZOOM
Chart services courtesy of stockcharts.com. Annotations by James Taulman.
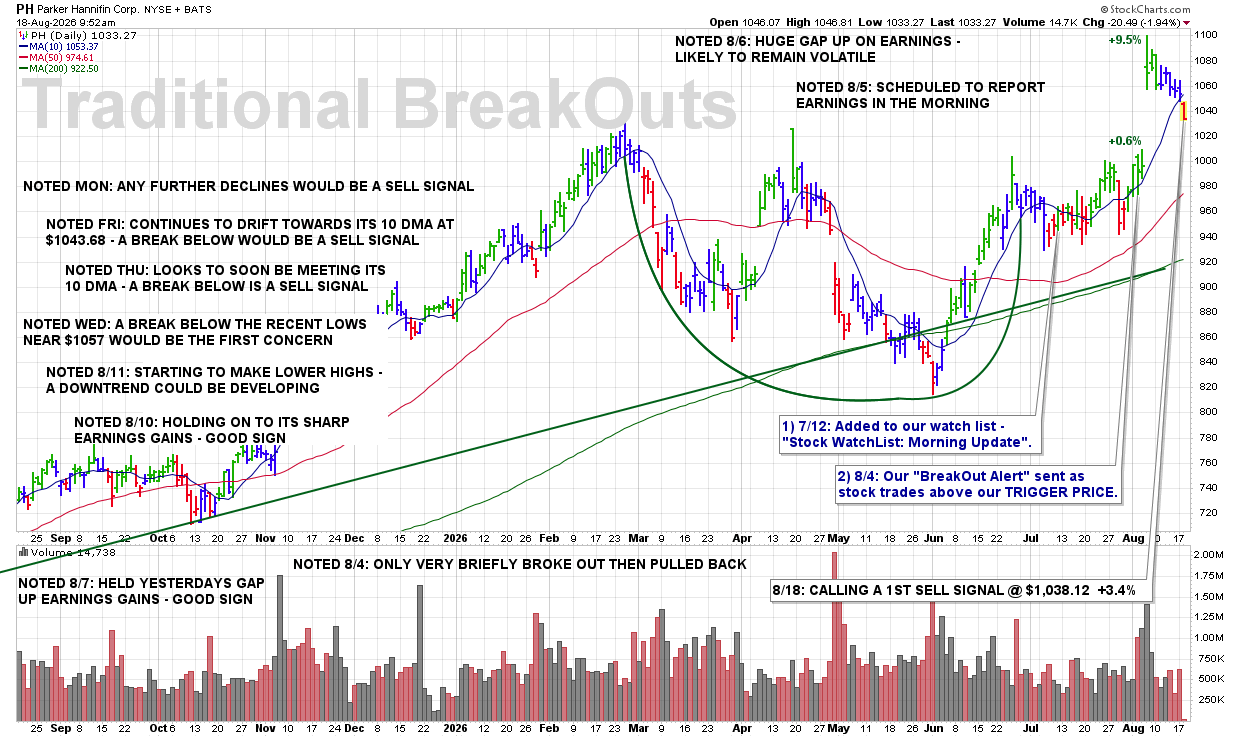
9:42 AM – As noted last night, “Any further declines would be a SELL SIGNAL.” Shares are clearly breaking below the 10 DMA this morning on a sharp increase in volume. That combination of a key technical support violation and increased selling volume warrants calling a 1ST SELL SIGNAL under our rules.
ULTRA Trader’s Tip: Increased Volume Makes a Violation More Meaningful
• A break below the 10 DMA is a standard technical warning under our rules.
• When that break occurs on sharply increased volume, it adds conviction to the bearish action.
• Predetermined rules remove emotion from the decision—when the violation occurs, respect the signal.
CLICK/TAP CHART TO ZOOM
Chart services courtesy of stockcharts.com. Annotations by James Taulman.
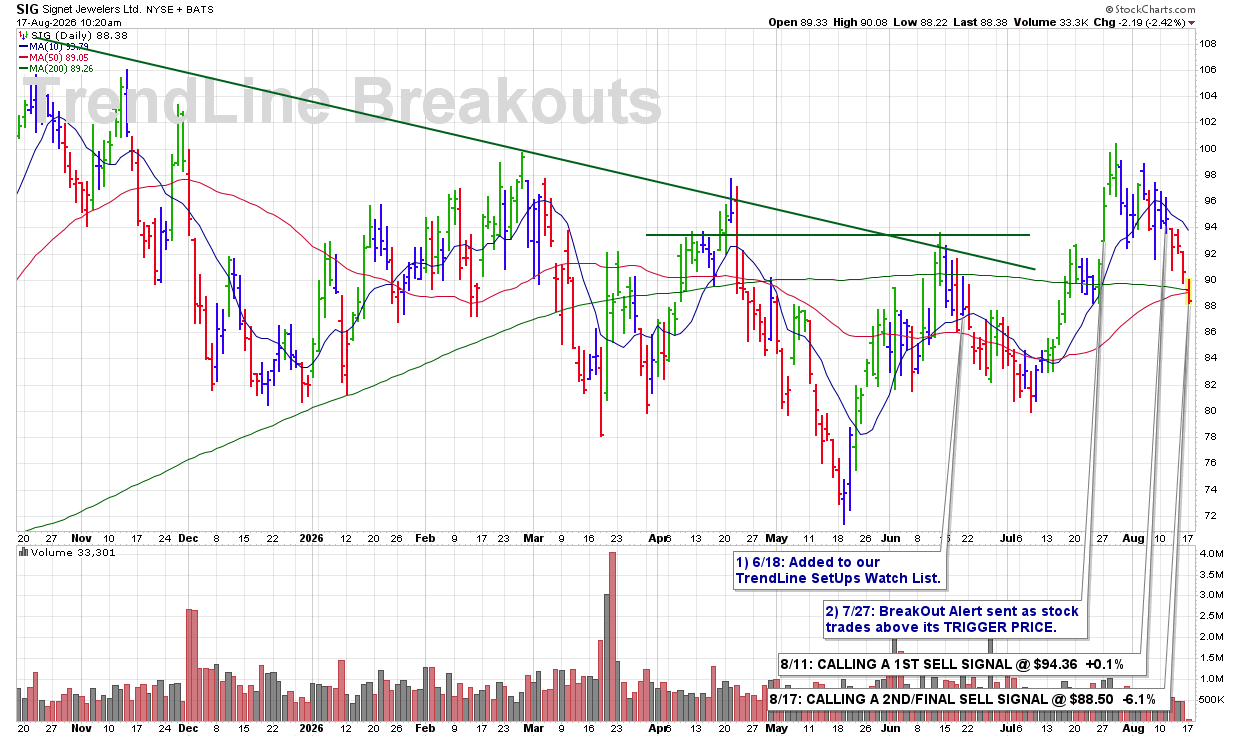
10:04 AM – Calling a 2ND and FINAL SELL SIGNAL this morning as shares break below the 50 DMA. That loss of a major technical support level is a standard SELL SIGNAL under our rules and warrants fully closing out this selection.
ULTRA Trader’s Tip: Major Support Breaks End the Debate
• The 50 DMA is one of the most important intermediate-term support levels we track.
• A clear break below that line confirms that technical weakness has progressed beyond a short-term pullback.
• When a major support level fails, follow the rule and move on.
CLICK/TAP CHART TO ZOOM
Chart services courtesy of stockcharts.com. Annotations by James Taulman.
8:00 PM – Here is our latest chart update for this recent breakout from our Traditional BreakOuts Watch List.

CLICK/TAP CHART TO ZOOM
Chart services courtesy of stockcharts.com. Annotations by James Taulman.
We are currently reporting on this stock as an active holding and continue to monitor the stock closely for any technical SELL SIGNALS.
The focus always remains on price/volume action around key support levels, including the 10 DMA, 50 DMA, and any nearby trendline or ROUND-$ support.
3:29 PM – Selling half my GPN position here as shares have made a solid price advance, but volume is running only around the daily average. At the same time, price has become extended from the 10 DMA, currently at $87.52. I’m locking in some decent +17.5% profits here while continuing to hold the remaining half of my position.
James’ Trader’s Tip: Take Some Profits Into Strength
• A strong price advance can provide an opportunity to lock in gains before any technical weakness develops.
• When price becomes extended from the 10 DMA, the probability of a normal pullback toward that line increases.
• Selling part of a winning position allows you to bank profits while maintaining exposure if the stock continues higher.

CLICK/TAP CHART TO ZOOM
Chart services courtesy of stockcharts.com. Annotations by James Taulman.
10:07 AM – Calling a 3RD and FINAL SELL SIGNAL this morning as shares have once again fallen below the 10 DMA and are now beginning to break below the 50 DMA as well. With short-term support failing again and a more significant intermediate-term support level now under pressure, the technical deterioration warrants fully closing out this selection.
ULTRA Trader’s Tip: Multiple Support Breaks Confirm the Trend
• Repeated failures at the 10 DMA show that short-term momentum remains weak.
• A developing break below the 50 DMA adds another significant technical violation.
• When multiple support levels begin failing together, the evidence is telling you the trend is deteriorating—respect it.

CLICK/TAP CHART TO ZOOM
Chart services courtesy of stockcharts.com. Annotations by James Taulman.
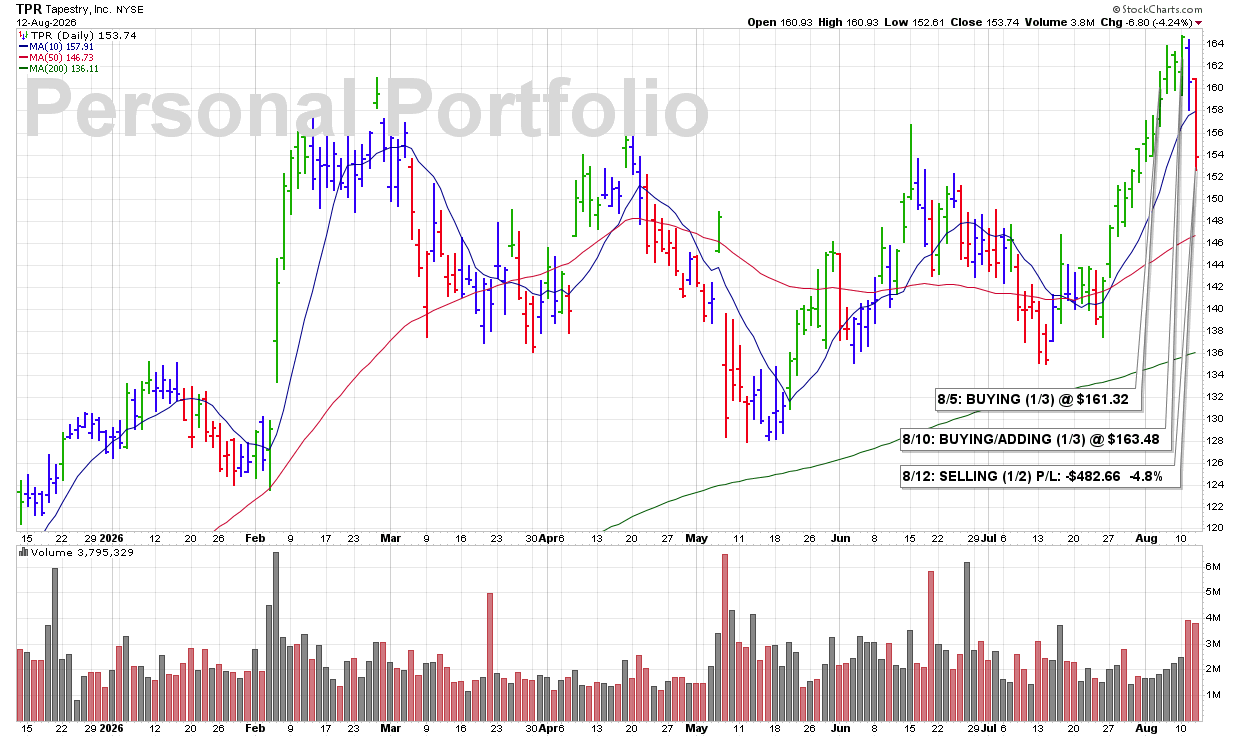
3:46 PM – Selling half of my 2/3 position here as shares break below the 10 DMA. The exception here is that the company is scheduled to report earnings tomorrow morning, so today’s weakness may at least partially be influenced by the upcoming announcement. I’m reducing my risk ahead of the report, but after having some recent success with earnings plays, I’m willing to accept the added risk and hold the remaining 1/3 position through tomorrow morning’s announcement.
James’ Trader’s Tip: Reduce Risk Without Eliminating Opportunity
• A break below the 10 DMA is a technical violation and should not simply be ignored because earnings are approaching.
• Earnings can produce significant gaps in either direction, making position size especially important.
• Selling half allows you to reduce exposure while maintaining a smaller position if you deliberately choose to accept the overnight earnings risk.
CLICK/TAP CHART TO ZOOM
Chart services courtesy of stockcharts.com. Annotations by James Taulman.
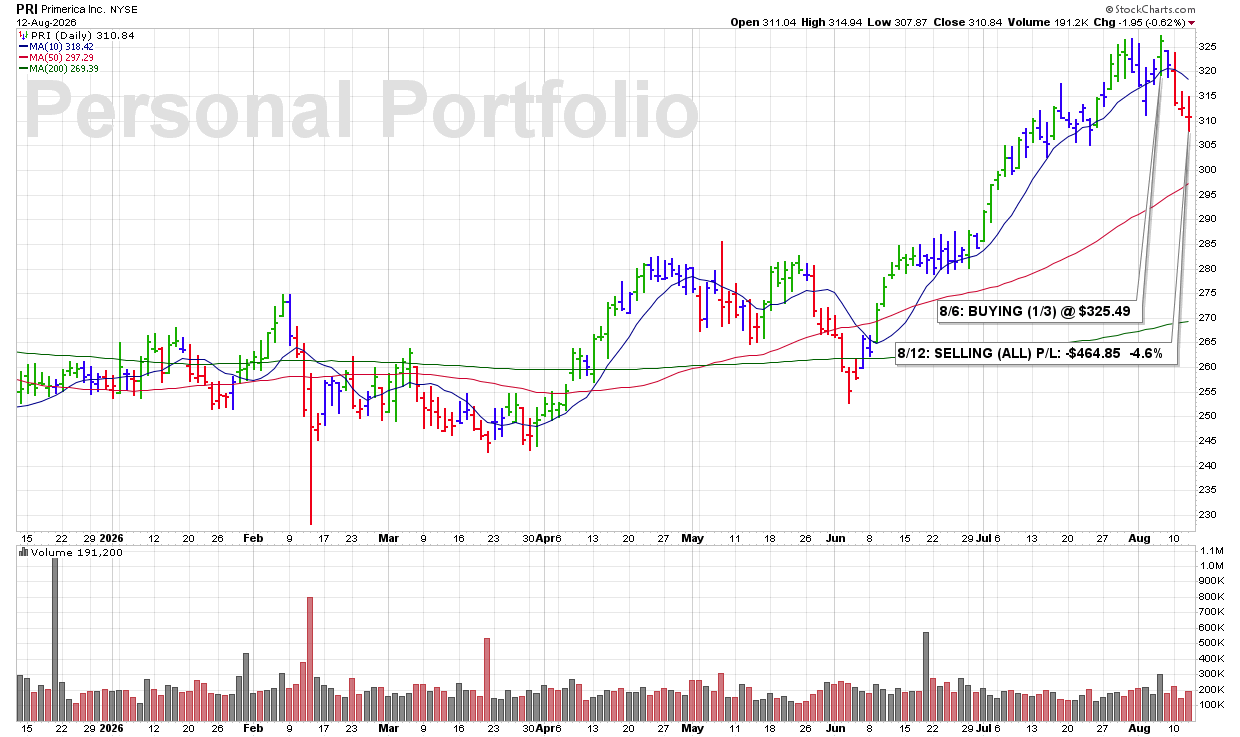
3:34 PM – Selling all my PRI shares as we head into today’s close. After Monday’s break below the 10 DMA, the stock has continued to exhibit bearish technical action, and the loss is now approaching my acceptable threshold. Rather than allow additional weakness to develop, I’m exiting the position and protecting capital.
James’ Trader’s Tip: Know Your Loss Threshold
• A technical violation such as a break below the 10 DMA is an early warning that momentum may be deteriorating.
• When weakness continues and the loss begins approaching your predetermined limit, discipline becomes more important than hope.
• Taking a manageable loss protects both capital and flexibility for the next stronger opportunity.
CLICK/TAP CHART TO ZOOM
Chart services courtesy of stockcharts.com. Annotations by James Taulman.
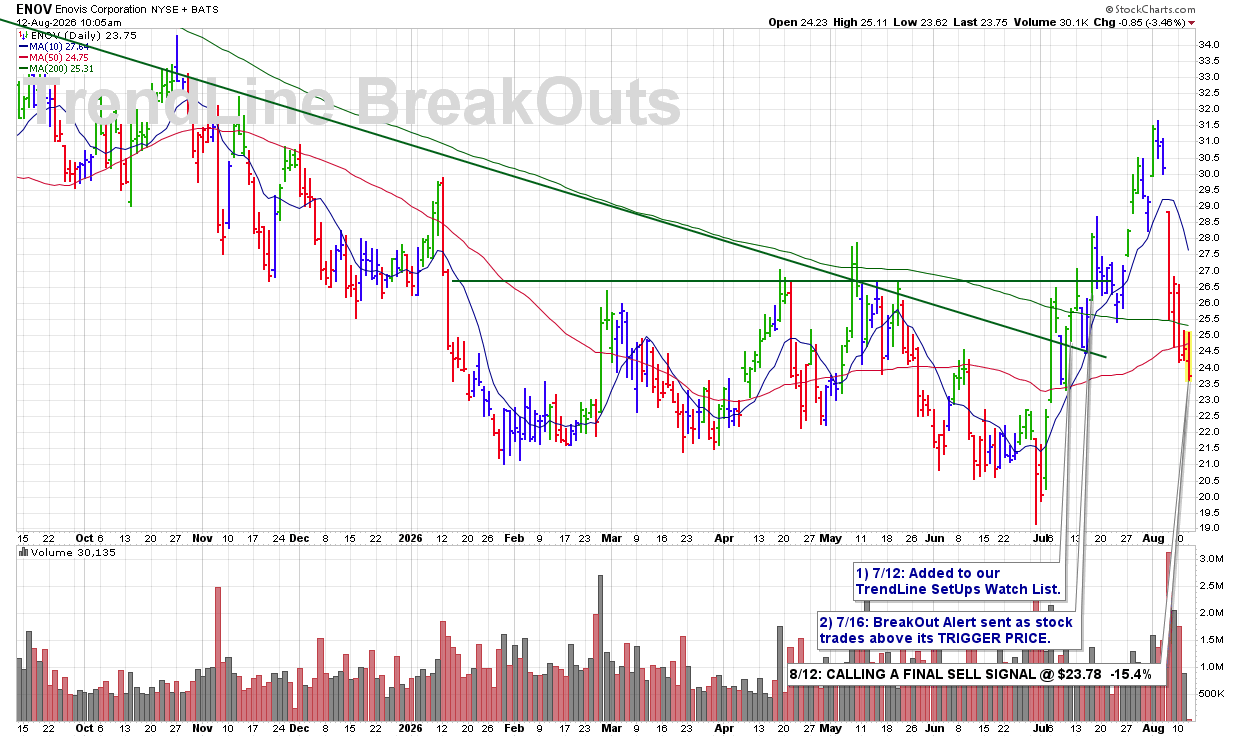
9:47 AM – Calling a FINAL SELL SIGNAL this morning as the stock has failed to recover from its earnings sell-off and is making new lows today. The continued inability to rebound following the sharp decline confirms the ongoing technical weakness and warrants fully closing out this selection.
ULTRA Trader’s Tip: Failure to Recover Is Technical Weakness
• After a sharp sell-off, a healthy stock should begin showing signs of stabilization or recovery.
• Continued weakness and new lows indicate that sellers remain in control.
• When a stock repeatedly fails to recover after a major technical breakdown, respect the weakness and move on.
CLICK/TAP CHART TO ZOOM
Chart services courtesy of stockcharts.com. Annotations by James Taulman.
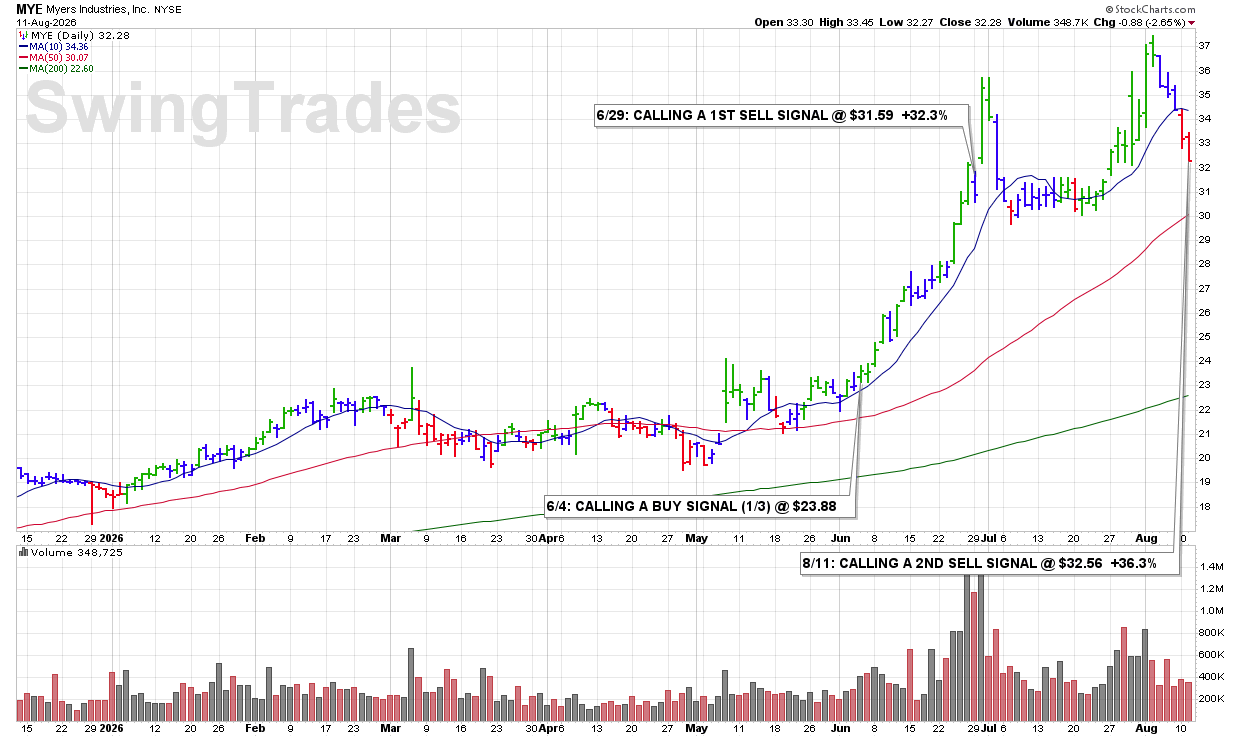
3:44 PM – Calling a 2ND SELL SIGNAL as we head into today’s close. The stock has clearly lost its 10 DMA (blue line) and has continued to exhibit bearish technical action with a string of down days from its recent high. With a substantial +36.3% gain still intact, the continued deterioration is another signal to take additional profits and reduce exposure.
ULTRA Trader’s Tip: Protect Big Winners as Weakness Develops
• A strong previous gain does not override current bearish technical action.
• A string of declining sessions followed by a clear 10 DMA violation signals that momentum has changed.
• Scaling out allows you to systematically protect profits as technical weakness develops rather than waiting for the entire gain to disappear.
CLICK/TAP CHART TO ZOOM
Chart services courtesy of stockcharts.com. Annotations by James Taulman.
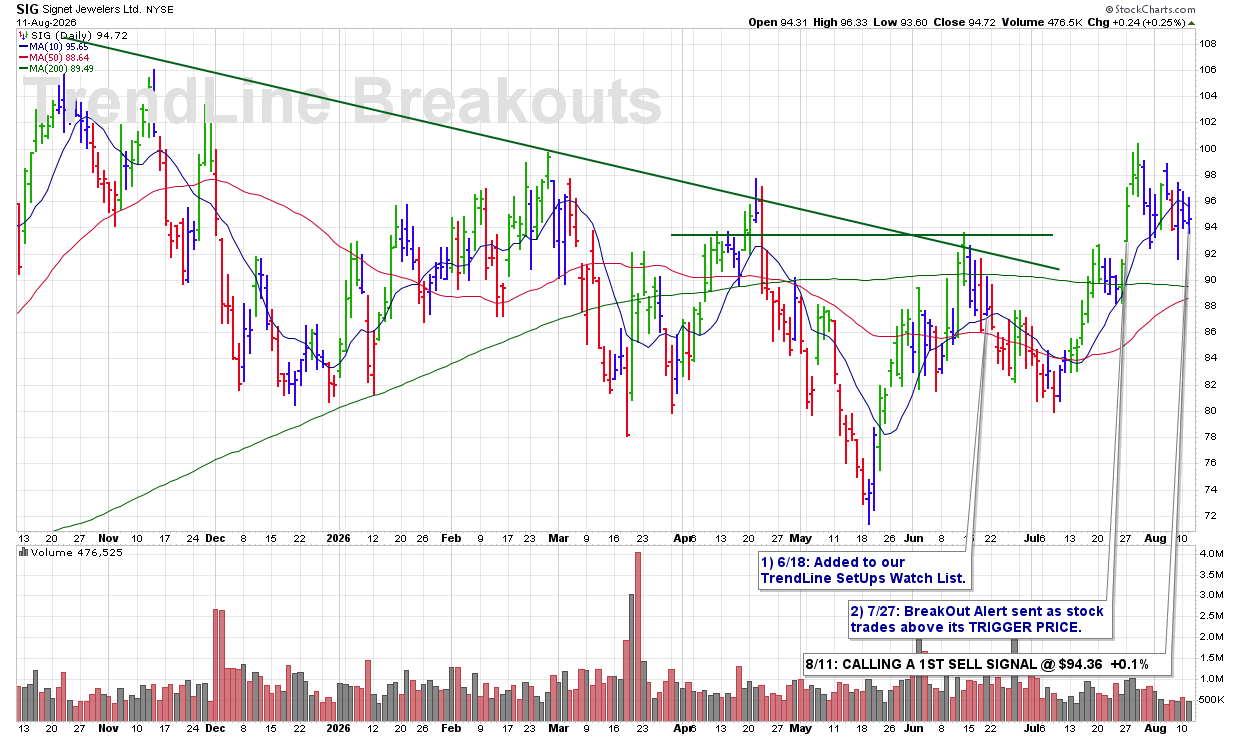
3:38 PM – Calling a 1ST SELL SIGNAL as shares continue to exhibit bearish technical action after running into resistance near the previous high at the ROUND-$100 level. The stock has now developed a series of lower highs, fallen back below its 10 DMA, and appears to be developing a short-term downtrend. With multiple signs of technical weakness beginning to stack up, I’m calling the first SELL SIGNAL here.
ULTRA Trader’s Tip: Watch for a Pattern of Lower Highs
• A series of lower highs shows that buyers are becoming less aggressive with each rally attempt.
• When that pattern is accompanied by a break below the 10 DMA, the technical picture becomes increasingly bearish.
• Recognizing a developing downtrend early allows you to reduce exposure before additional technical damage occurs.
CLICK/TAP CHART TO ZOOM
Chart services courtesy of stockcharts.com. Annotations by James Taulman.
10:08 AM – Bearish technical action continues this morning as shares dip to new recent lows. I’m calling a 3RD and FINAL SELL SIGNAL as the stock continues to get turned back from its 10 DMA, which has now acted as resistance since late July. The repeated failure to reclaim that line confirms the ongoing technical weakness.
ULTRA Trader’s Tip: Repeated Resistance Confirms Weakness
• When a stock repeatedly gets turned back from the 10 DMA, former support has effectively become resistance.
• New recent lows confirm that sellers remain in control.
• Ongoing technical weakness is itself a SELL SIGNAL—especially when recovery attempts continue to fail.

CLICK/TAP CHART TO ZOOM
Chart services courtesy of stockcharts.com. Annotations by James Taulman.
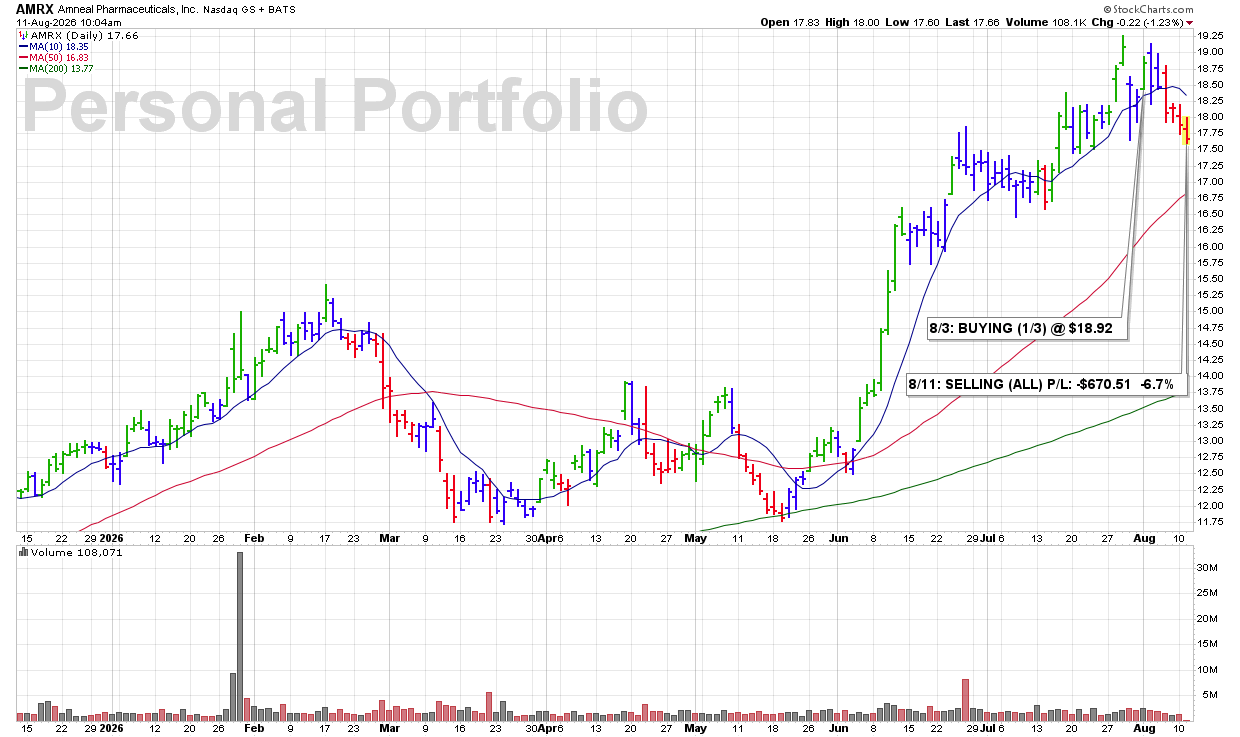
9:58 AM – Selling all my AMRX shares this morning, and here’s why. The stock recently broke below its 10 DMA, which was the first technical violation. It then fell below our noted ROUND-$18 support, and shares are continuing lower this morning while the 10 DMA is now clearly rolling over. With multiple signs of technical deterioration stacking up, I’m exiting the position and moving on.
James’ Trader’s Tip: Ongoing Technical Weakness Is a Signal
• A break below the 10 DMA is often the first warning that momentum is deteriorating.
• Losing additional support levels confirms that the weakness is continuing—not improving.
• When the 10 DMA begins rolling over while price continues lower, the stock is telling you the technical trend is weakening. Listen to it.
CLICK/TAP CHART TO ZOOM
Chart services courtesy of stockcharts.com. Annotations by James Taulman.
10:00 PM – Here is our latest chart update for this recent breakout from our Traditional BreakOuts Watch List.

CLICK/TAP CHART TO ZOOM
Chart services courtesy of stockcharts.com. Annotations by James Taulman.
We are currently reporting on this stock as an active holding and continue to monitor the stock closely for any technical SELL SIGNALS.
The focus always remains on price/volume action around key support levels, including the 10 DMA, 50 DMA, and any nearby trendline or ROUND-$ support.
9:15 PM – Here is our latest chart update for this recent breakout from our Traditional BreakOuts Watch List
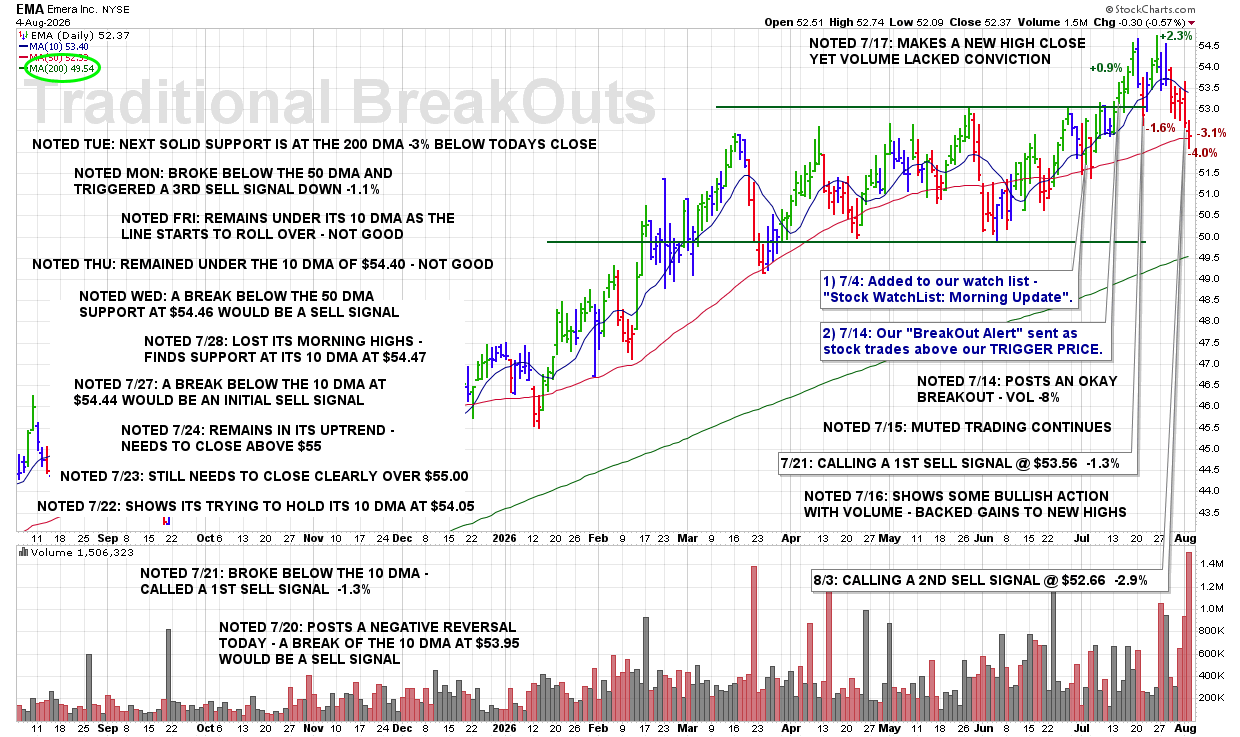
CLICK/TAP CHART TO ZOOM
Chart services courtesy of stockcharts.com. Annotations by James Taulman.
We are currently reporting on this stock as an active holding and continue to monitor the stock closely for any technical SELL SIGNALS.
The focus always remains on price/volume action around key support levels, including the 10 DMA, 50 DMA, and any nearby trendline or ROUND-$ support.
1:48 PM – Selling all my ITGR shares here after learning the company is being acquired for approximately $127.00 per share. With the stock now trading around the announced buyout value, I’m locking in this strong +23.9% gain and moving on.
James’ Trader’s Tip: Take the Win When the Catalyst Changes
• A buyout can quickly change the technical setup and limit the stock’s remaining upside.
• Once the primary move has been captured, there is little reason to keep capital tied up waiting for a small additional gain.
• Locking in a strong profit and redeploying that capital into a fresh opportunity keeps the portfolio working.

CLICK/TAP CHART TO ZOOM
Chart services courtesy of stockcharts.com. Annotations by James Taulman.
1:48 PM – Selling all my CBZ shares after the stock recently gapped sharply higher on buyout news. I’m taking these windfall profits here, locking in a strong +24% gain, and moving on to the next opportunity.
James’ Trader’s Tip: Take the Windfall and Move On
• Buyout news can create an immediate jump in price and dramatically change the original technical setup.
• When a stock delivers a sudden outsized gain, there is nothing wrong with taking the profit rather than waiting for incremental upside.
• Bank the win, free up the capital, and look for the next strong setup.

CLICK/TAP CHART TO ZOOM
Chart services courtesy of stockcharts.com. Annotations by James Taulman.
8:50 PM – Here is our latest chart update for this recent breakout from our Traditional BreakOuts Watch List.

CLICK/TAP CHART TO ZOOM
Chart services courtesy of stockcharts.com. Annotations by James Taulman.
We are currently reporting on this stock as an active holding and continue to monitor the stock closely for any technical SELL SIGNALS.
The focus always remains on price/volume action around key support levels, including the 10 DMA, 50 DMA, and any nearby trendline or ROUND-$ support.
3:44 PM – Selling all of my FTS position this afternoon as we head into the close. After recently losing support at the 10 DMA, shares are now clearly breaking below the 50 DMA while the 10 DMA is rolling over. With multiple signs of technical deterioration stacking up, I’m closing out the position and protecting capital.
James’ Trader’s Tip: Technical Weakness Often Builds in Stages
• Losing the 10 DMA is often the first warning that short-term momentum is weakening.
• A subsequent break below the 50 DMA confirms more serious technical deterioration.
• When weakness continues to build and key moving averages begin rolling over, respect the message and reduce exposure.

CLICK/TAP CHART TO ZOOM
Chart services courtesy of stockcharts.com. Annotations by James Taulman.
9:37 AM – Calling a 2ND SELL SIGNAL this morning (correction: the earlier email incorrectly stated a 1st SELL SIGNAL) as shares are clearly breaking below the 50 DMA. This loss of a major support level represents a meaningful technical violation and warrants further reducing the position.
ULTRA Trader’s Tip: Major Support Levels Matter
• The 50 DMA often serves as an important line of institutional support.
• When a stock decisively breaks below that level, the probability of continued weakness increases.
• Respecting major technical violations early helps preserve capital and keeps small losses from becoming much larger ones.
CLICK/TAP CHART TO ZOOM
Chart services courtesy of stockcharts.com. Annotations by James Taulman.
7:40 PM – Here is our latest chart update for this recent breakout from our Traditional BreakOuts Watch List.
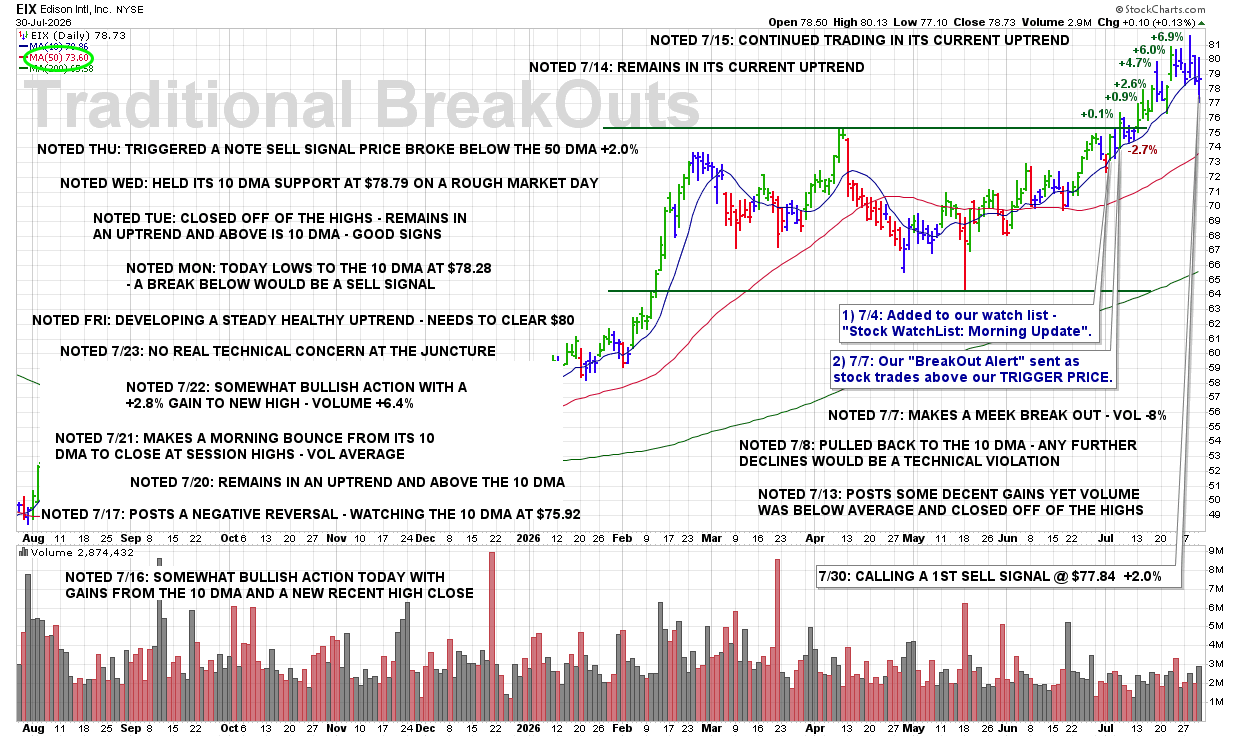
CLICK/TAP CHART TO ZOOM
Chart services courtesy of stockcharts.com. Annotations by James Taulman.
We are currently reporting on this stock as an active holding and continue to monitor the stock closely for any technical SELL SIGNALS.
The focus always remains on price/volume action around key support levels, including the 10 DMA, 50 DMA, and any nearby trendline or ROUND-$ support.
7:30 PM – Here is our latest chart update for this recent breakout from our Traditional BreakOuts Watch List.
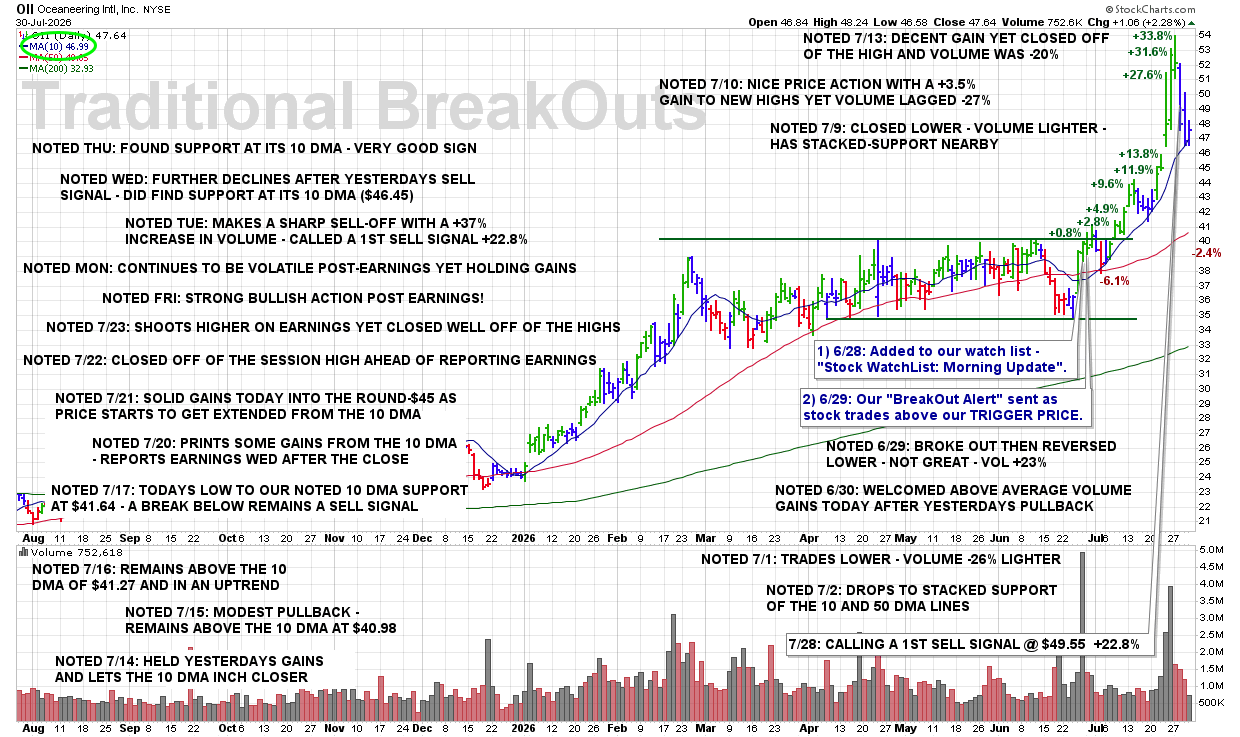
CLICK/TAP CHART TO ZOOM
Chart services courtesy of stockcharts.com. Annotations by James Taulman.
We are currently reporting on this stock as an active holding and continue to monitor the stock closely for any technical SELL SIGNALS.
The focus always remains on price/volume action around key support levels, including the 10 DMA, 50 DMA, and any nearby trendline or ROUND-$ support.
7:25 PM – Here is our latest chart update for this recent breakout from our Traditional BreakOuts Watch List.
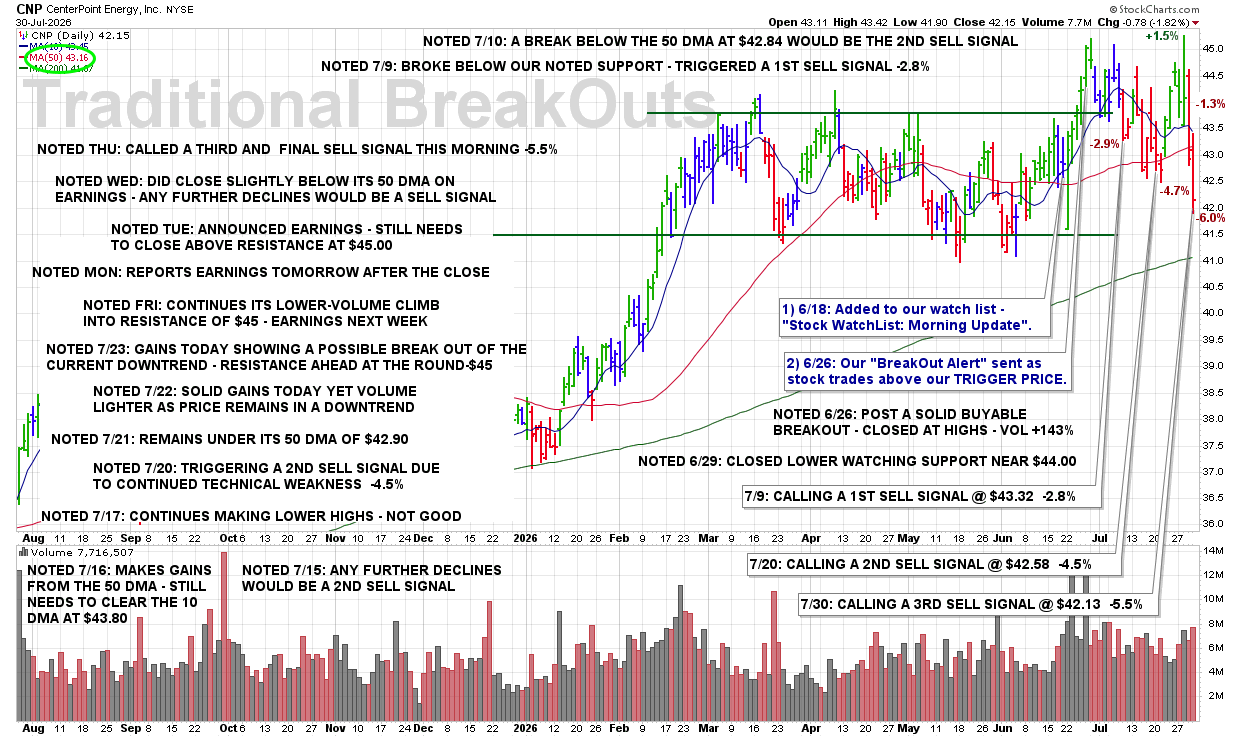
CLICK/TAP CHART TO ZOOM
Chart services courtesy of stockcharts.com. Annotations by James Taulman.
We are currently reporting on this stock as an active holding and continue to monitor the stock closely for any technical SELL SIGNALS.
The focus always remains on price/volume action around key support levels, including the 10 DMA, 50 DMA, and any nearby trendline or ROUND-$ support.
7:15 PM – Here is our latest chart update for this recent breakout from our Traditional BreakOuts Watch List.
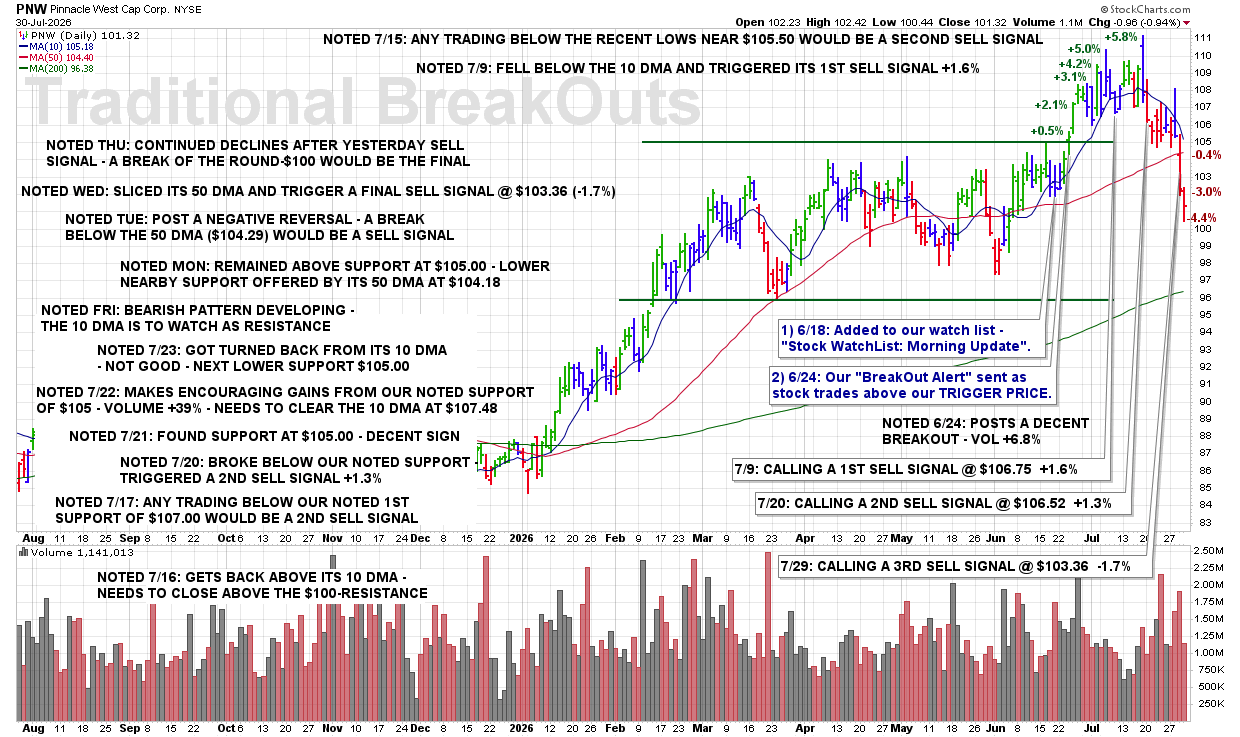
CLICK/TAP CHART TO ZOOM
Chart services courtesy of stockcharts.com. Annotations by James Taulman.
We are currently reporting on this stock as an active holding and continue to monitor the stock closely for any technical SELL SIGNALS.
The focus always remains on price/volume action around key support levels, including the 10 DMA, 50 DMA, and any nearby trendline or ROUND-$ support.
7:10 PM – Here is our latest chart update for this recent breakout from our Traditional BreakOuts Watch List.
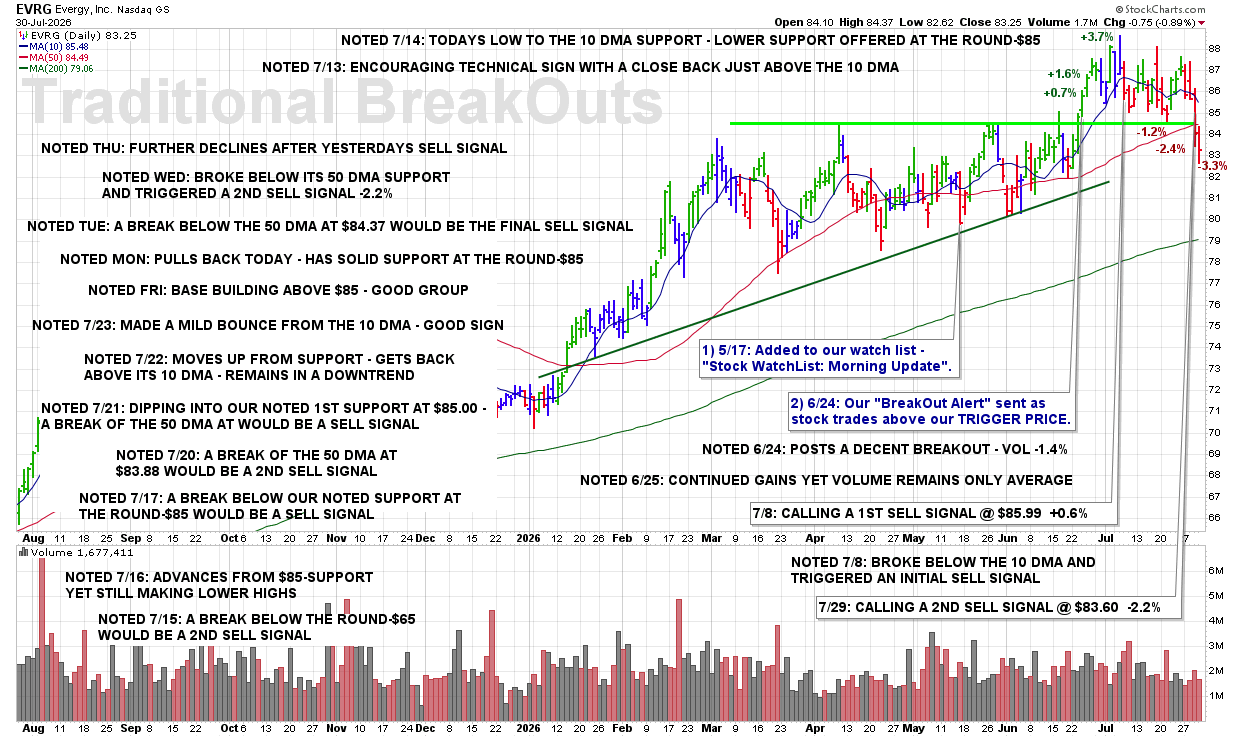
CLICK/TAP CHART TO ZOOM
Chart services courtesy of stockcharts.com. Annotations by James Taulman.
We are currently reporting on this stock as an active holding and continue to monitor the stock closely for any technical SELL SIGNALS.
The focus always remains on price/volume action around key support levels, including the 10 DMA, 50 DMA, and any nearby trendline or ROUND-$ support.
7:05 PM – Here is our latest chart update for this recent breakout from our Traditional BreakOuts Watch List.
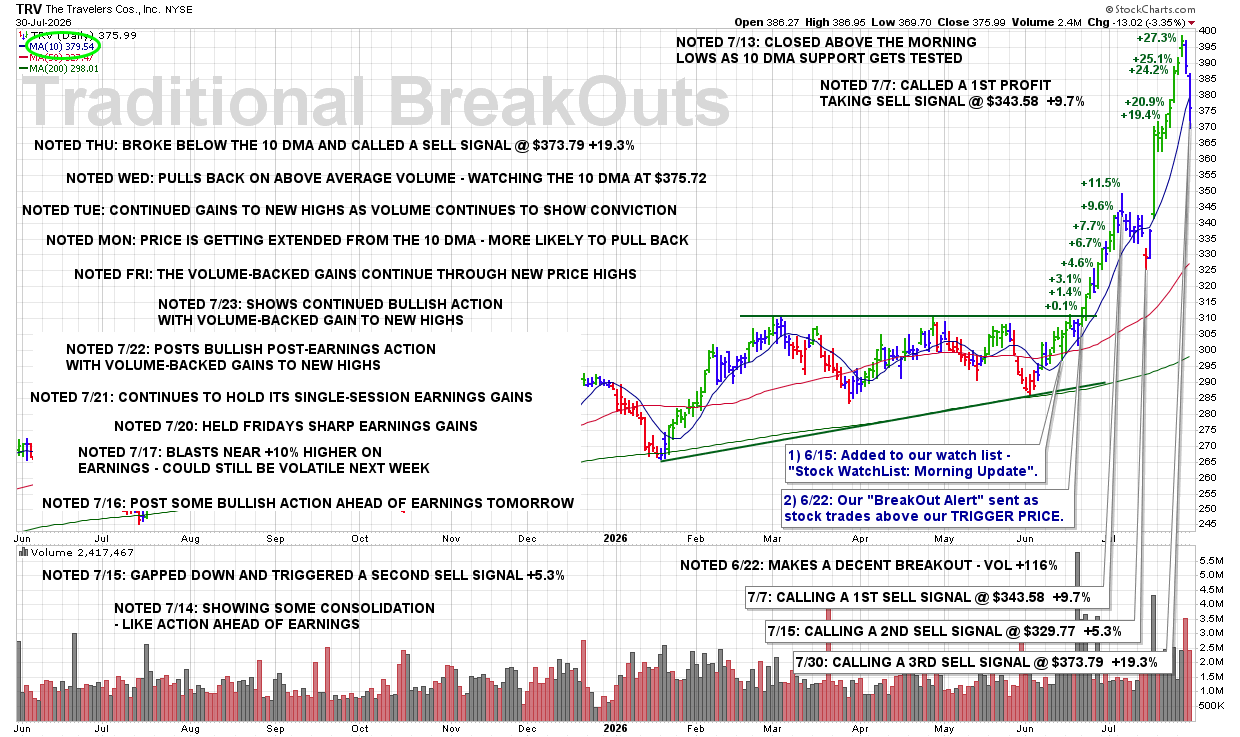
CLICK/TAP CHART TO ZOOM
Chart services courtesy of stockcharts.com. Annotations by James Taulman.
We are currently reporting on this stock as an active holding and continue to monitor the stock closely for any technical SELL SIGNALS.
The focus always remains on price/volume action around key support levels, including the 10 DMA, 50 DMA, and any nearby trendline or ROUND-$ support.
7/30 THU: GLAD – CALLING A 2ND SELL SIGNAL @ $18.64 -7.3%
11:14 AM – Calling a 2ND SELL SIGNAL as shares continue to trade lower on above-average volume and exhibit persistent technical weakness. The continued decline, combined with elevated selling volume, indicates that downside pressure remains in control and warrants further reducing the position.
ULTRA Trader’s Tip: Respect Weakness When Selling Persists
• Continued price deterioration after an initial sell signal confirms that the stock has not stabilized.
• Above-average volume during a decline can indicate sustained institutional distribution.
• Reducing exposure as weakness progresses helps contain losses and preserve capital for stronger opportunities.
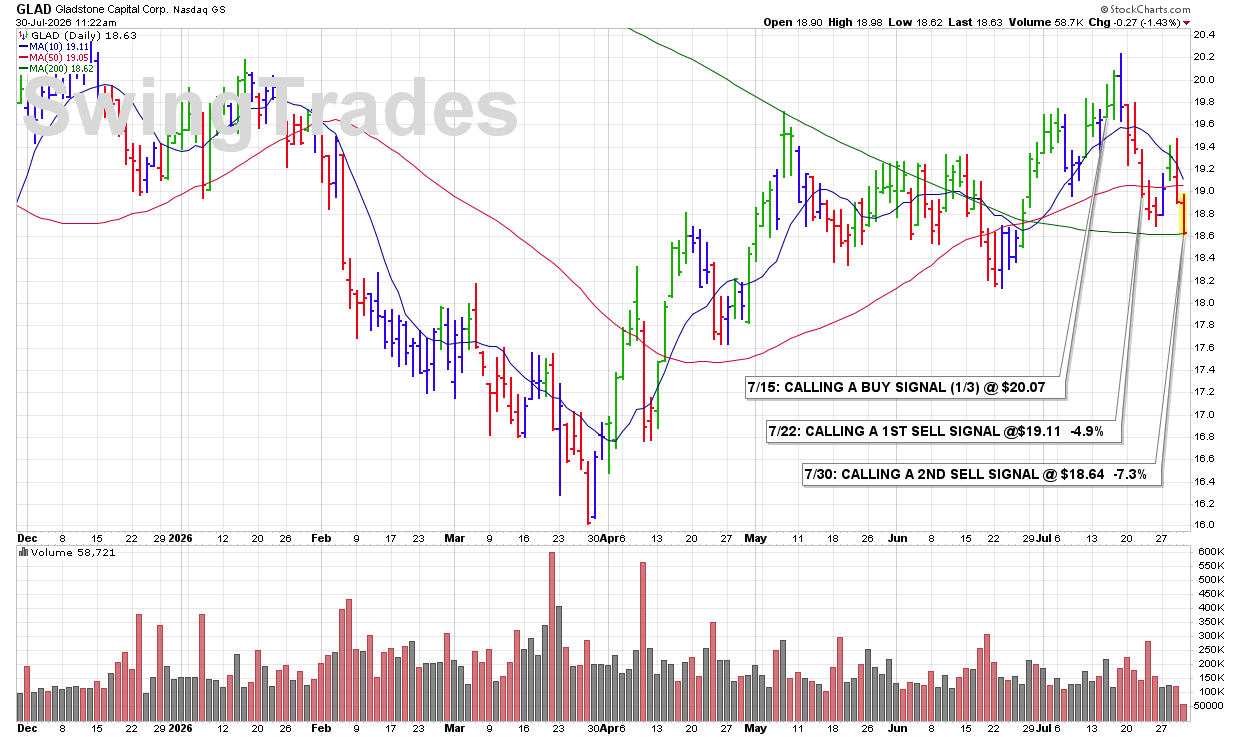
CLICK/TAP CHART TO ZOOM
Chart services courtesy of stockcharts.com. Annotations by James Taulman.
11:06 AM – Calling a 3RD and FINAL SELL SIGNAL this morning after shares briefly reclaimed the 50 DMA yesterday but have now clearly lost that support. As noted yesterday, any further decline below this key level would represent an additional technical violation and trigger the final exit.
ULTRA Trader’s Tip: Failed Recoveries Often Confirm Weakness
• Reclaiming the 50 DMA is only constructive if the stock can hold above it.
• A quick reversal back below major support signals that the recovery attempt has failed.
• Completing the exit after a failed recovery helps prevent a manageable loss from becoming more damaging.
CLICK/TAP CHART TO ZOOM
Chart services courtesy of stockcharts.com. Annotations by James Taulman.
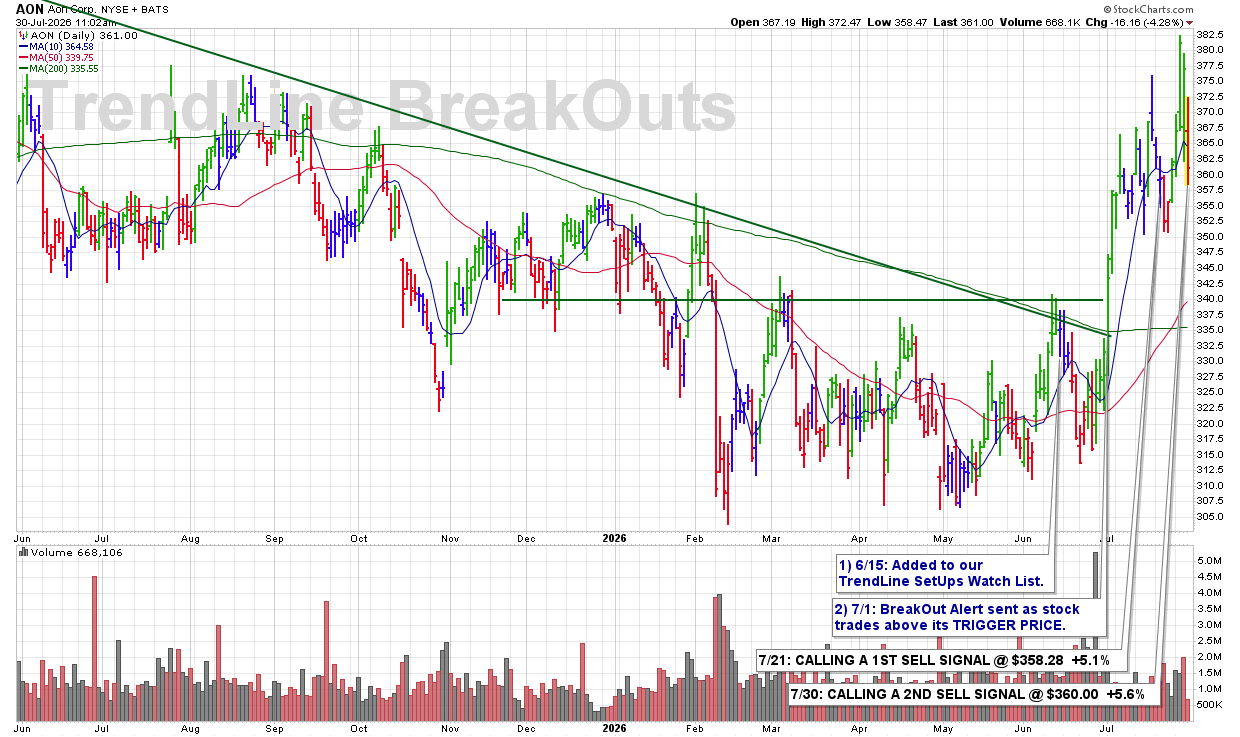
10:55 AM – Calling a 2ND SELL SIGNAL this morning as shares break below the 10 DMA on a sharp increase in trading volume. The combination of a key technical violation and expanding volume suggests institutional selling pressure is increasing and supports further reducing the position.
ULTRA Trader’s Tip: Volume Confirms the Technical Breakdown
• A break below the 10 DMA becomes more meaningful when accompanied by above-average volume.
• Increasing volume often reflects institutional distribution rather than routine profit-taking.
• Scaling out as technical weakness develops helps preserve gains while reducing portfolio risk.
CLICK/TAP CHART TO ZOOM
Chart services courtesy of stockcharts.com. Annotations by James Taulman.
10:44 AM – Calling a 1ST SELL SIGNAL this morning as shares break below the 10 DMA on increased trading volume. While this represents the first technical violation, the stock does remain in an overall uptrend with today’s intraday lows currently defining trend support. Any additional weakness from here would likely break that uptrend and trigger further defensive action.
ULTRA Trader’s Tip: Respect the First Signs of Weakness
• An initial break below the 10 DMA serves as an early warning that momentum may be changing.
• Increased volume on the decline suggests institutional selling should be monitored closely.
• Preserving flexibility with an initial sell allows you to reduce exposure while giving the stock an opportunity to recover its uptrend.
CLICK/TAP CHART TO ZOOM
Chart services courtesy of stockcharts.com. Annotations by James Taulman.
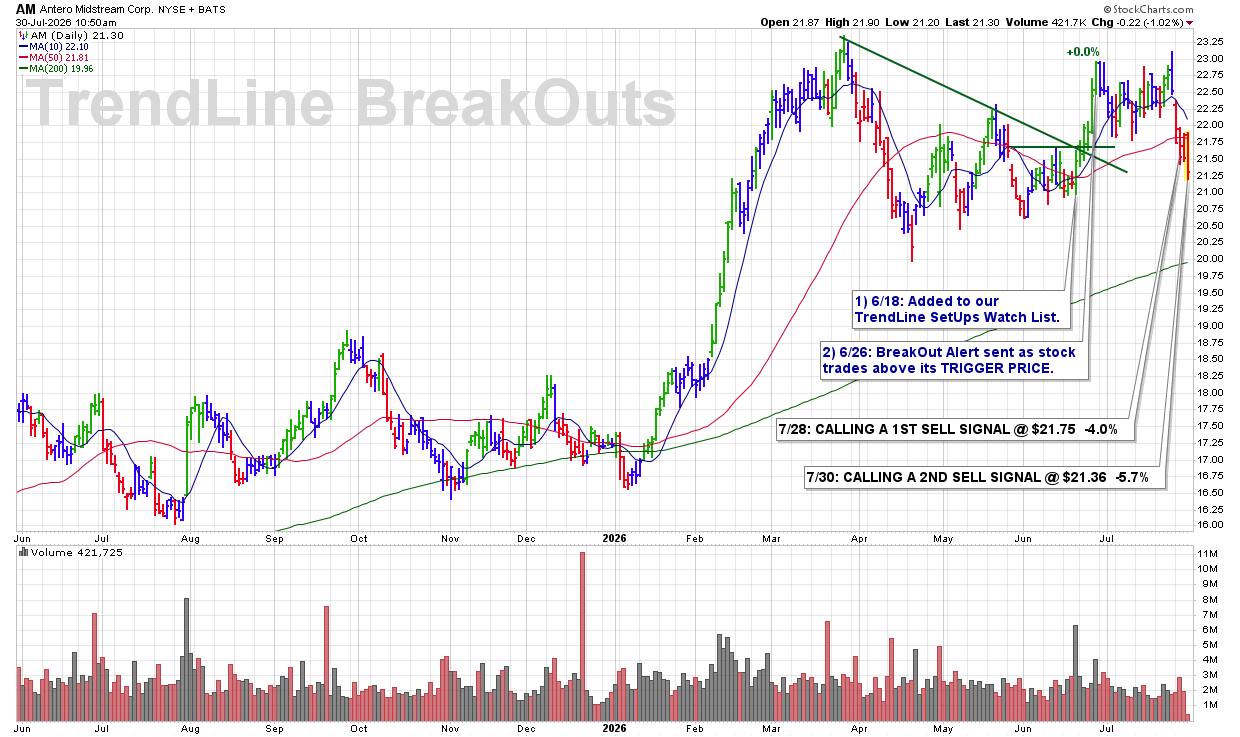
10:39 AM – Calling a 2ND and FINAL SELL SIGNAL as the stock continues to trade below its 50 DMA and displays persistent technical weakness. The failure to reclaim this key support level confirms the deterioration in the stock’s technical condition coupled with the near -6% decline warrants completing the exit.
ULTRA Trader’s Tip: Do Not Wait for Weakness to Become Worse
• Continued trading below the 50 DMA confirms that an important support level has been lost.
• A stock’s failure to recover after a major technical violation is often a signal to reduce the remaining exposure.
• Completing the exit protects capital and keeps losses from becoming more difficult to manage.
CLICK/TAP CHART TO ZOOM
Chart services courtesy of stockcharts.com. Annotations by James Taulman.
10:32 AM – Calling a 3RD and FINAL SELL SIGNAL on the insurance leader this morning as shares break below the 10 DMA on approximately twice normal trading volume. The expanding volume adds significance to the technical violation and signals increased institutional selling pressure.
ULTRA Trader’s Tip: Complete the Exit When Weakness Is Confirmed
• A decisive break below the 10 DMA becomes more significant when accompanied by sharply higher volume.
• Heavy-volume selling can signal that institutional investors are reducing their positions.
• A final sell protects the remaining gain and frees capital for stronger opportunities.
CLICK/TAP CHART TO ZOOM
Chart services courtesy of stockcharts.com. Annotations by James Taulman.
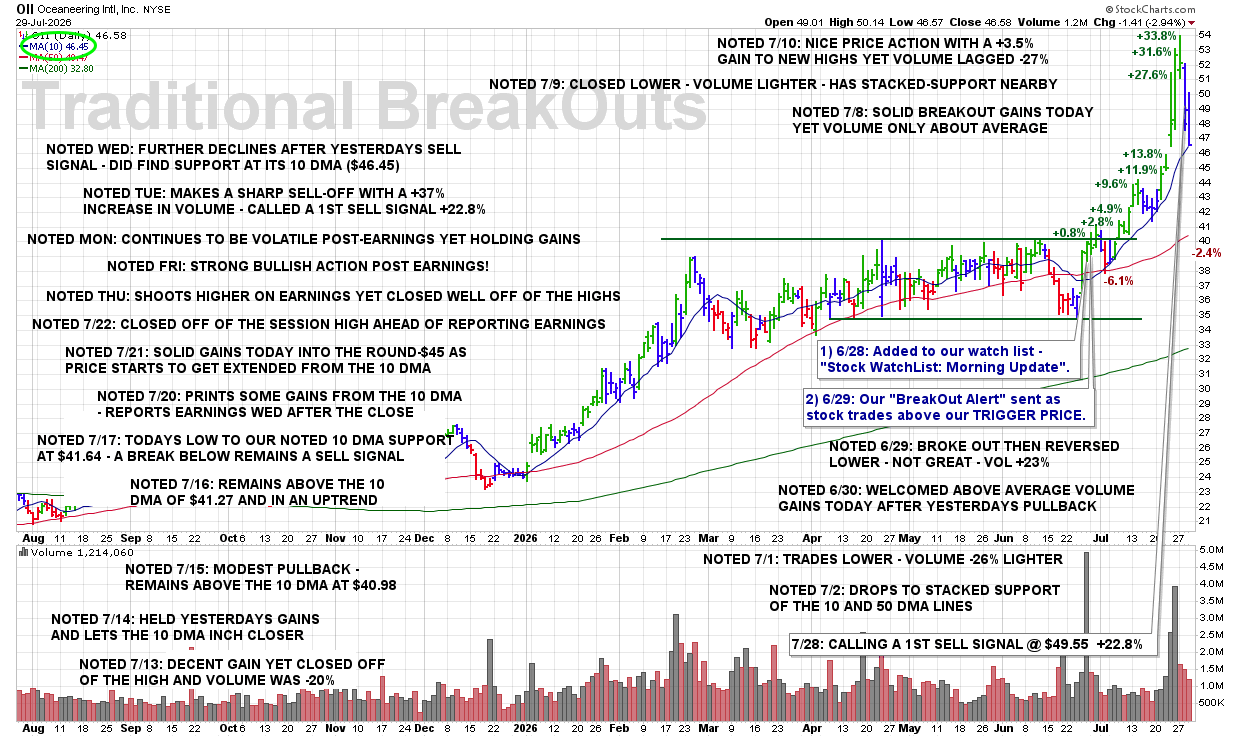
8:40 PM – Here is our latest chart update for this recent breakout from our Traditional BreakOuts Watch List.
CLICK/TAP CHART TO ZOOM
Chart services courtesy of stockcharts.com. Annotations by James Taulman.
We are currently reporting on this stock as an active holding and continue to monitor the stock closely for any technical SELL SIGNALS.
The focus always remains on price/volume action around key support levels, including the 10 DMA, 50 DMA, and any nearby trendline or ROUND-$ support.
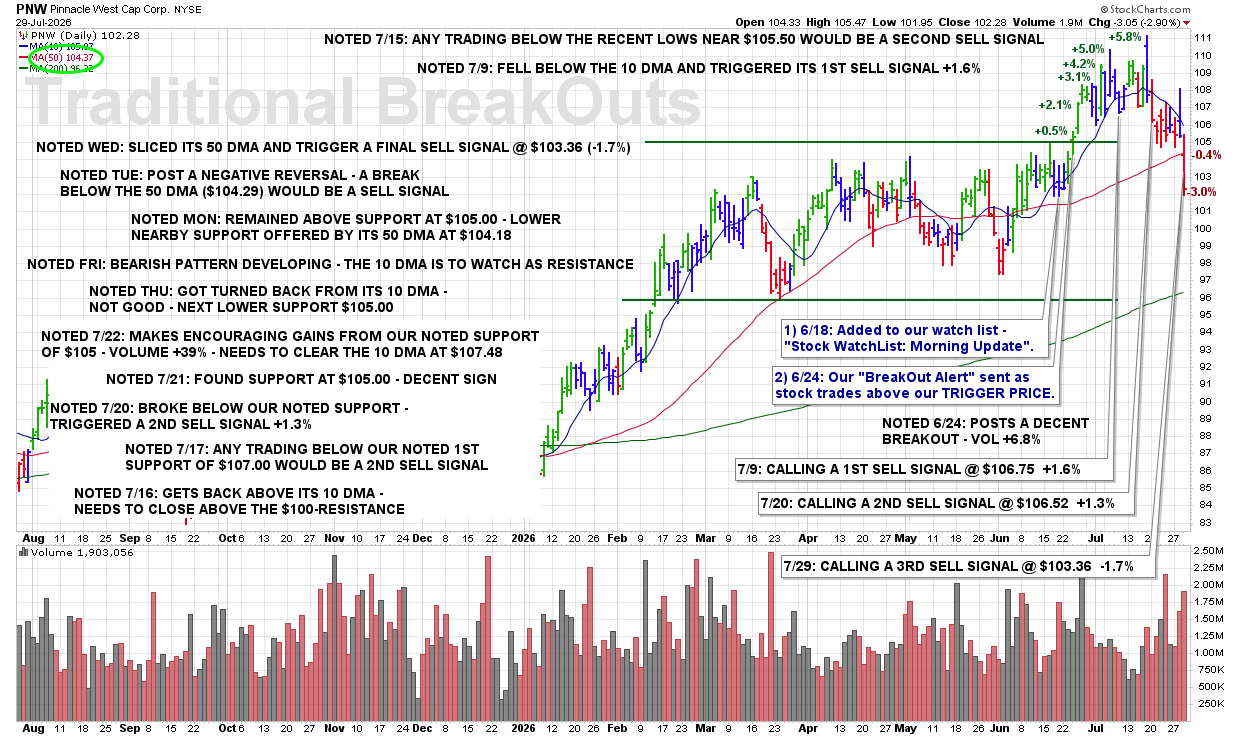
8:25 PM – Here is our latest chart update for this recent breakout from our Traditional BreakOuts Watch List.
CLICK/TAP CHART TO ZOOM
Chart services courtesy of stockcharts.com. Annotations by James Taulman.
We are currently reporting on this stock as an active holding and continue to monitor the stock closely for any technical SELL SIGNALS.
The focus always remains on price/volume action around key support levels, including the 10 DMA, 50 DMA, and any nearby trendline or ROUND-$ support.
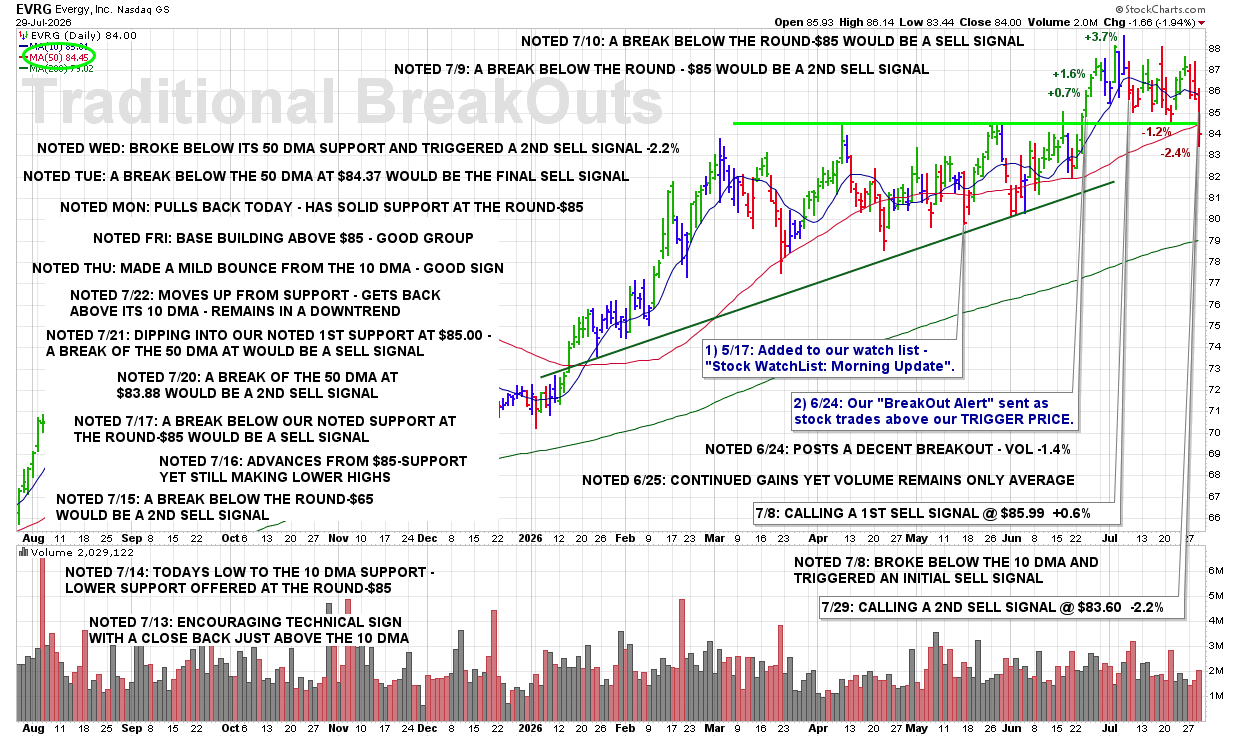
8:20 PM – Here is our latest chart update for this recent breakout from our Traditional BreakOuts Watch List.
CLICK/TAP CHART TO ZOOM
Chart services courtesy of stockcharts.com. Annotations by James Taulman.
We are currently reporting on this stock as an active holding and continue to monitor the stock closely for any technical SELL SIGNALS.
The focus always remains on price/volume action around key support levels, including the 10 DMA, 50 DMA, and any nearby trendline or ROUND-$ support.
3:33 PM – Calling a 2ND SELL SIGNAL as shares have broken below support at the 50 DMA, representing a significant technical violation. Losing this key intermediate-term support level increases the probability of additional weakness and warrants further reducing the position.
ULTRA Trader’s Tip: The 50 DMA Is a Critical Line of Defense
• A decisive break below the 50 DMA signals that the stock’s intermediate-term trend is weakening.
• When major support fails, the probability of continued downside typically increases.
• Reducing exposure as technical violations accumulate helps preserve capital and maintain portfolio discipline.
CLICK/TAP CHART TO ZOOM
Chart services courtesy of stockcharts.com. Annotations by James Taulman.
12:21 PM – Calling a 3RD and FINAL SELL SIGNAL as the stock has clearly lost support at its 50 DMA. A decisive break below this major technical level is a default sell signal under our rules and warrants completing the exit from this selection.
ULTRA Trader’s Tip: Major Support Breaks Require Decisive Action
• The 50 DMA is an important measure of intermediate-term technical support.
• A clear break below this level confirms a meaningful deterioration in the stock’s technical condition.
• Completing the exit when major support fails helps protect capital and prevents a small loss from becoming more damaging.
CLICK/TAP CHART TO ZOOM
Chart services courtesy of stockcharts.com. Annotations by James Taulman.
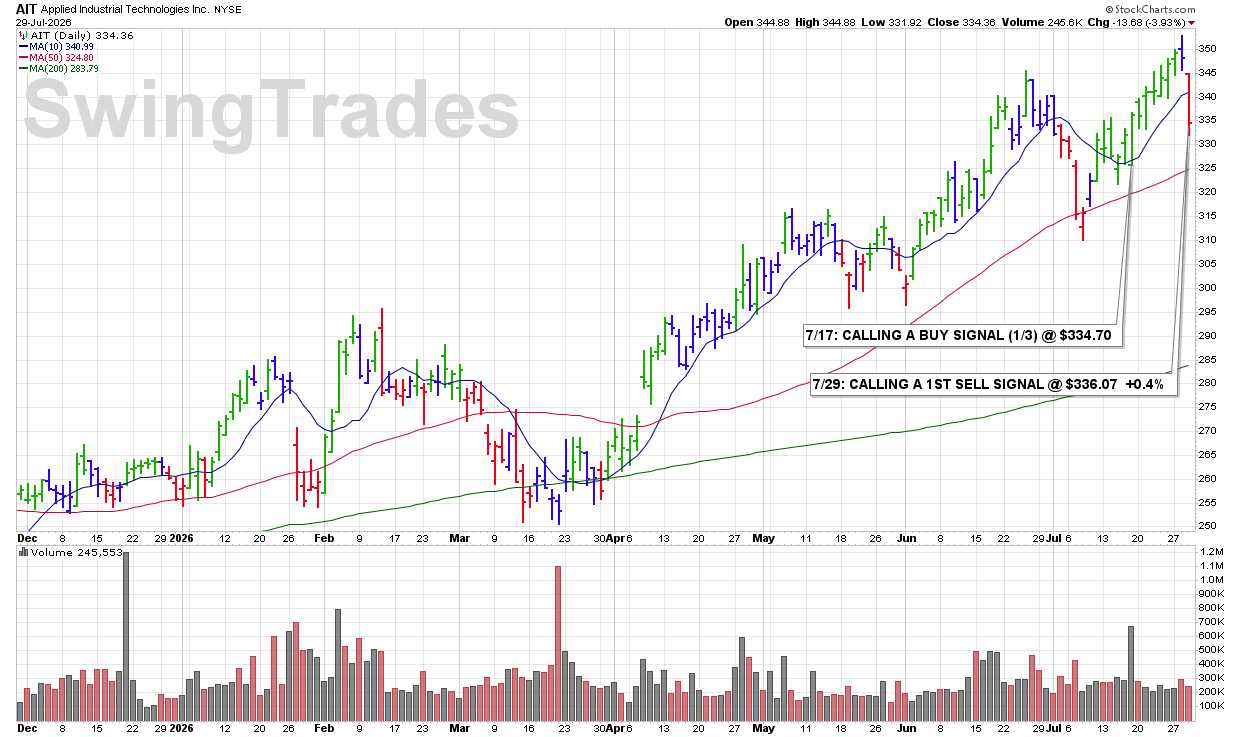
10:12 AM – Calling a 1ST SELL SIGNAL as shares are breaking below the 10 DMA this morning. This represents a technical violation of our primary support level and triggers a standard SELL SIGNAL under the ULTRA Trading System.
ULTRA Trader’s Tip: Follow Your Rules Consistently
• A break below the 10 DMA is an early warning that a stock’s momentum may be weakening.
• Consistently following predefined sell rules helps remove emotion from the decision-making process.
• Small, disciplined sells early can help protect capital if additional technical weakness develops.
CLICK/TAP CHART TO ZOOM
Chart services courtesy of stockcharts.com. Annotations by James Taulman.
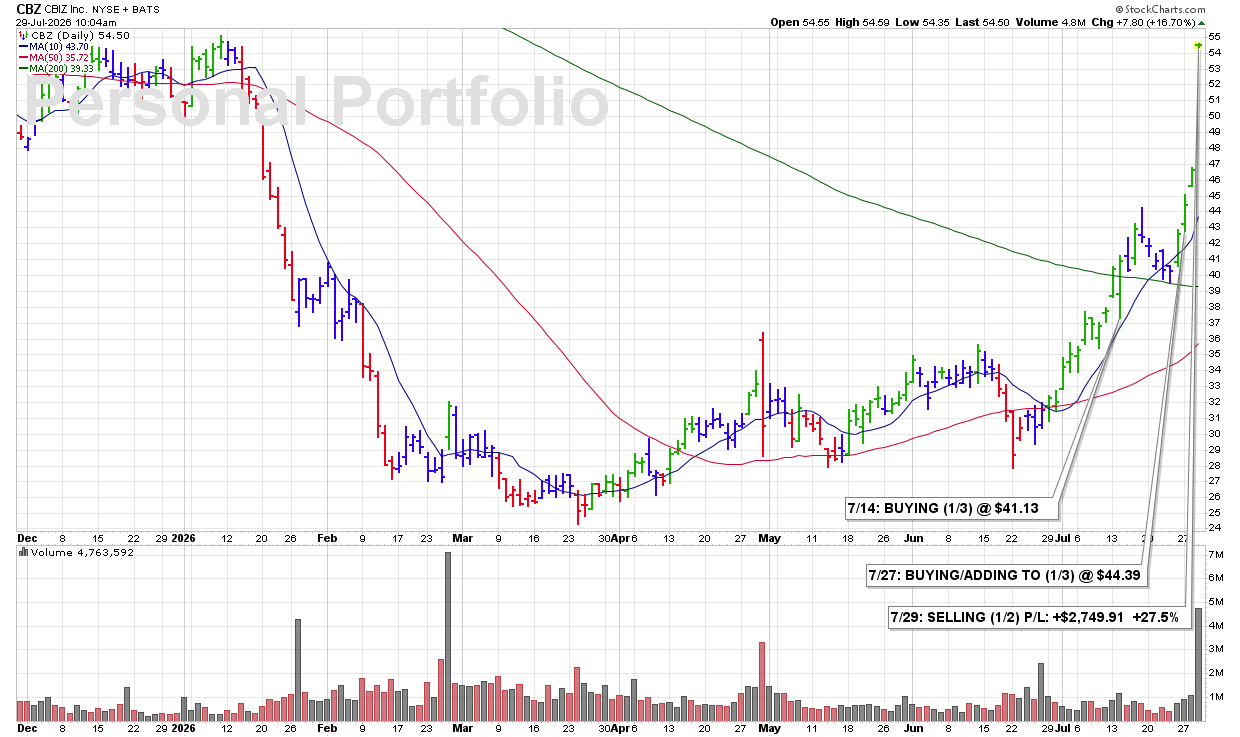
9:55 AM – Selling half of my 2/3 position in CBZ this morning after the stock gapped sharply higher following earnings. While the reaction is certainly bullish, post-earnings trading can be highly volatile. I’m taking advantage of the strength to lock in a substantial profit while allowing the remaining shares to participate if the gains continue.
James’ Trader’s Tip: Let Earnings Work for You
• Large post-earnings gaps often create increased volatility in both directions.
• Selling a partial position into strength allows you to realize gains while maintaining upside exposure.
• Scaling out in stages helps reduce emotional decision-making and keeps you aligned with your trading plan.
CLICK/TAP CHART TO ZOOM
Chart services courtesy of stockcharts.com. Annotations by James Taulman.
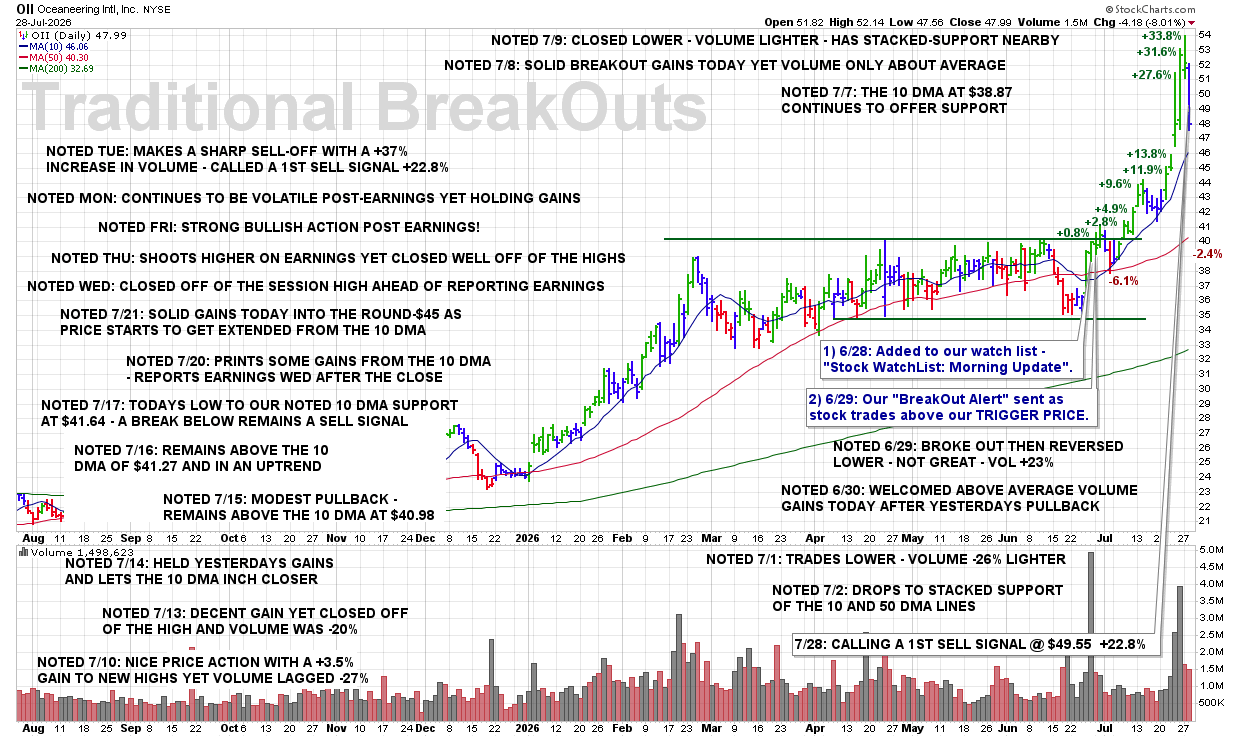
8:40 PM – Here is our latest chart update for this recent breakout from our Traditional BreakOuts Watch List.
CLICK/TAP CHART TO ZOOM
Chart services courtesy of stockcharts.com. Annotations by James Taulman.
We are currently reporting on this stock as an active holding and continue to monitor the stock closely for any technical SELL SIGNALS.
The focus always remains on price/volume action around key support levels, including the 10 DMA, 50 DMA, and any nearby trendline or ROUND-$ support.
3:47 PM – Calling a 1ST SELL SIGNAL here as the stock has clearly broken below its 50 DMA support and is closing near the session lows on a 27% increase in volume. The combination of a major support violation, weak closing action, and rising volume represents a meaningful deterioration in the stock’s technical condition.
ULTRA Trader’s Tip: Respect a Break of Major Support
• The 50 DMA is an important intermediate-term support level.
• A break below support carries greater significance when volume expands.
• Closing near the session lows confirms that sellers remained in control through the end of the day.
CLICK/TAP CHART TO ZOOM
Chart services courtesy of stockcharts.com. Annotations by James Taulman.
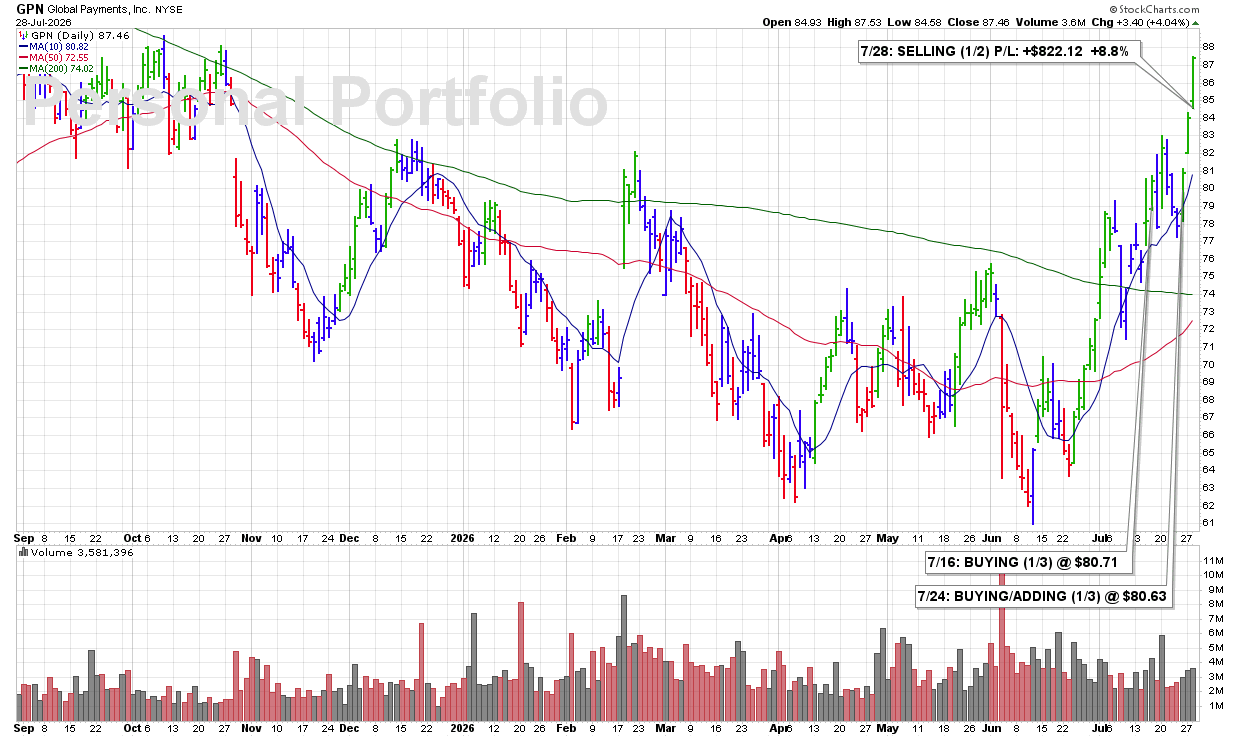
3:43 PM – Selling half my GPN position here and locking in a solid gain. I have been in a selling mode today because I currently own too many stocks and may be carrying too much exposure in an increasingly shaky market. With my personal trading account at all-time highs—up 20% YTD and 60% YoY—my priority is protecting those gains and reducing unnecessary risk.
James’ Trader’s Tip: Reduce Exposure From a Position of Strength
• Trimming a profitable position allows you to lock in gains while maintaining some exposure if the stock continues higher.
• When portfolio exposure becomes excessive, reducing positions can lower both market risk and margin pressure.
• Protecting an account at all-time highs requires discipline—not complacency.
CLICK/TAP CHART TO ZOOM
Chart services courtesy of stockcharts.com. Annotations by James Taulman.
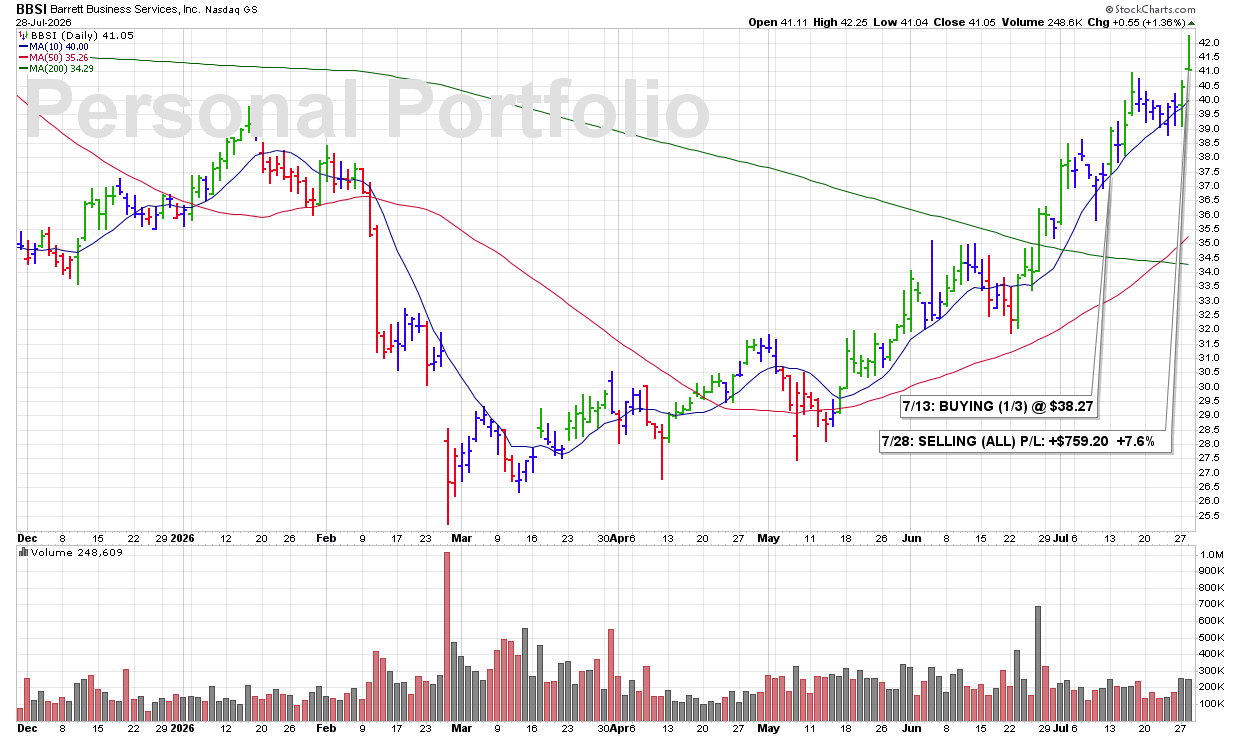
3:34 PM – Selling all my BBSI shares this afternoon as the stock reverses from its intraday highs and begins to weaken into the close. I’m taking the opportunity to lock in a solid profit while also reducing my overall margin and market exposure. My account is at all-time highs, and I want to keep it that way.
James’ Trader’s Tip: Protect Profits Before They Evaporate
• Stocks reversing from their intraday highs can signal that buying momentum is fading.
• Taking a respectable profit is often better than hoping for a little more and risking much less.
• Consistent trading is built on protecting gains just as diligently as limiting losses.
CLICK/TAP CHART TO ZOOM
Chart services courtesy of stockcharts.com. Annotations by James Taulman.
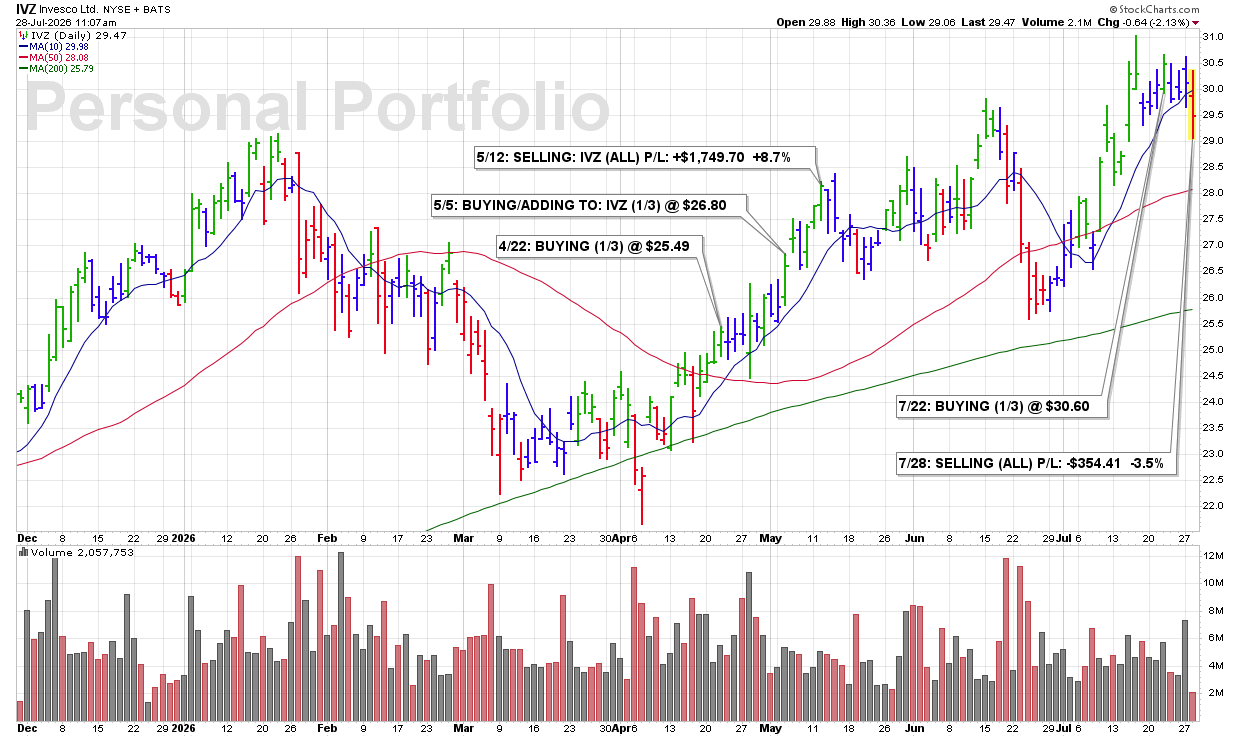
7/28 TUE: IVZ – SELLING (ALL) P/L: -$354.41 -3.5%
11:02 AM – Selling all my IVZ shares this morning. The stock has become volatile following earnings, which is both expected and fairly normal. However, I’m simply not willing to assume any additional risk here. My personal trading account is currently sitting at all-time highs, and my priority is protecting those gains rather than hoping for a post-earnings recovery.
James’ Trader’s Tip: There Is Nothing Wrong With Reducing Risk
• Earnings often create unpredictable price swings, regardless of a company’s long-term outlook.
• Protecting capital is just as important as generating returns.
• Sometimes the best decision is to step aside and preserve portfolio strength for the next high-probability opportunity.
CLICK/TAP CHART TO ZOOM
Chart services courtesy of stockcharts.com. Annotations by James Taulman.
10:14 AM – Calling a 1ST SELL SIGNAL this morning as shares sell off sharply on a massive 185% increase in volume. The heavy-volume decline signals strong institutional selling pressure and represents a clear change in the stock’s recent technical character.
ULTRA Trader’s Tip: Heavy Selling Volume Demands Respect
• A sharp decline on unusually high volume often signals institutional distribution.
• The greater the volume increase, the more significant the technical warning becomes.
• Protecting a strong gain begins with responding when a stock’s price-and-volume action changes materially.
CLICK/TAP CHART TO ZOOM
Chart services courtesy of stockcharts.com. Annotations by James Taulman.
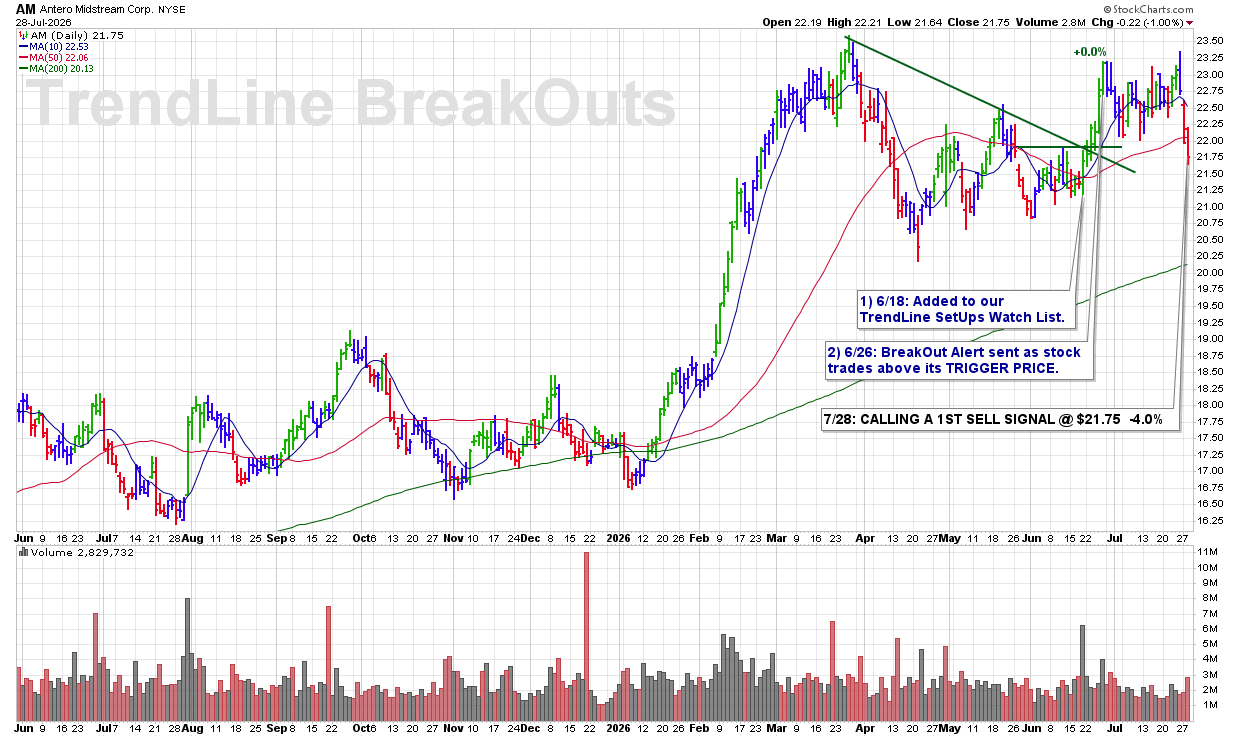
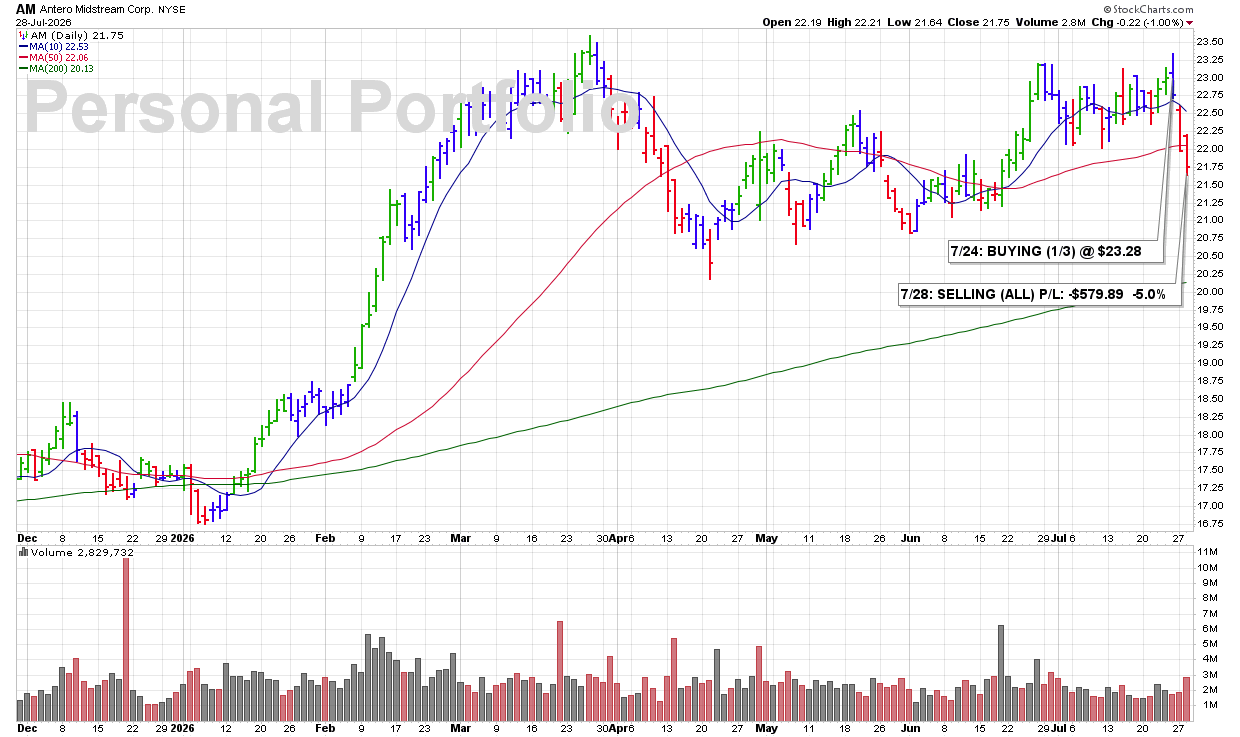
9:40 AM – Selling all my AM shares this morning as the stock continues lower after slipping below the 50 DMA yesterday. That break represents clear technical weakness. I am also freeing up needed capital to add another 1/3 position to FTS, which appears headed toward new highs on above-average volume.
James’ Trader’s Tip: Move Capital Toward Strength
• A break below the 50 DMA is a meaningful technical violation that should not be ignored.
• Holding a weakening stock can prevent capital from being deployed into a stronger opportunity.
• Portfolio management is not only about what you sell—it is also about where that capital can work more effectively.
CLICK/TAP CHART TO ZOOM
Chart services courtesy of stockcharts.com. Annotations by James Taulman.
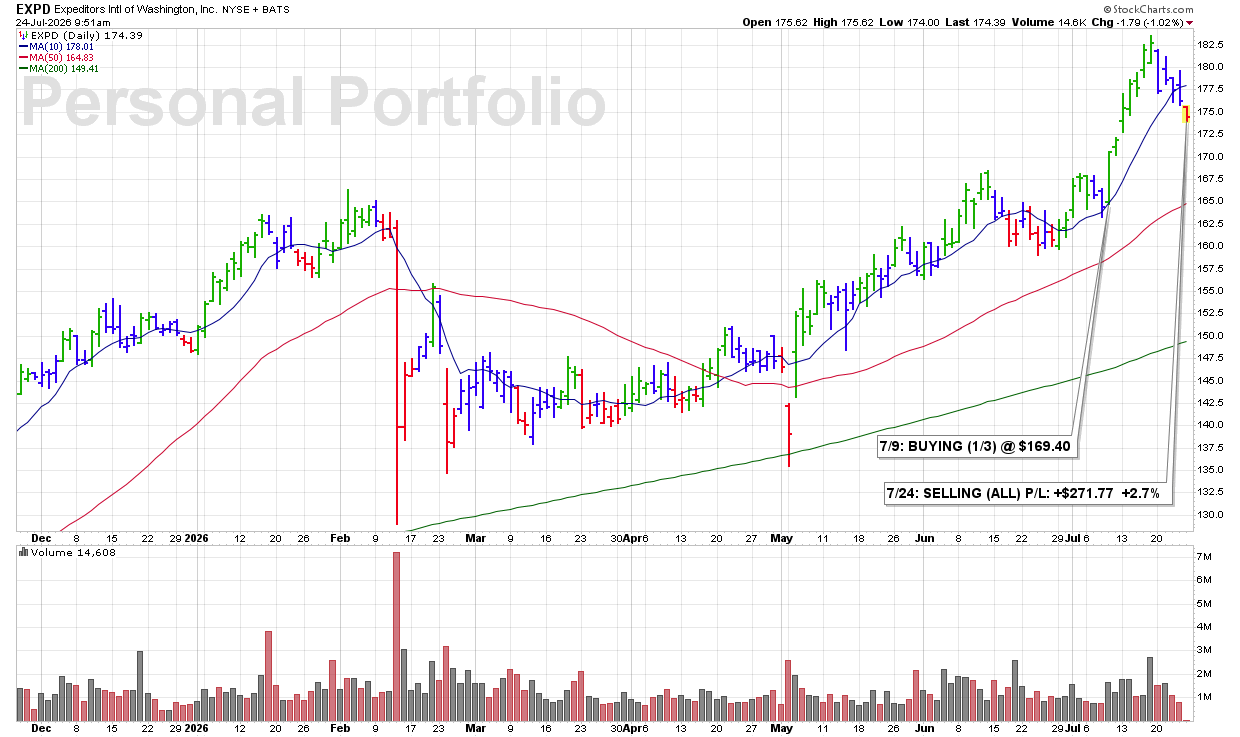
9:38 AM – Selling my entire EXPD position early this morning. I typically avoid making trades before 10:00 AM, allowing the market time to settle after the opening volatility. However, within the ULTRA Personal Portfolio, I will occasionally act ahead of an official SELL SIGNAL when I believe the technical evidence warrants it. In this case, the stock is beginning to carve out a bearish pattern characterized by (1) a series of lower highs, (2) a break below the 10 DMA, and (3) the 10 DMA beginning to roll over. Rather than wait for additional technical deterioration, I’m taking a small profit and moving on to stronger opportunities.
James’ Trader’s Tip: Anticipating Technical Weakness
• While the ULTRA system is rules-based, experience can sometimes identify a weakening pattern before an official SELL SIGNAL is triggered.
• A series of lower highs combined with a declining 10 DMA often signals that momentum is fading.
• Preserving capital and reallocating it into stronger opportunities is often more productive than waiting for additional technical damage to occur.
CLICK/TAP CHART TO ZOOM
Chart services courtesy of stockcharts.com. Annotations by James Taulman.
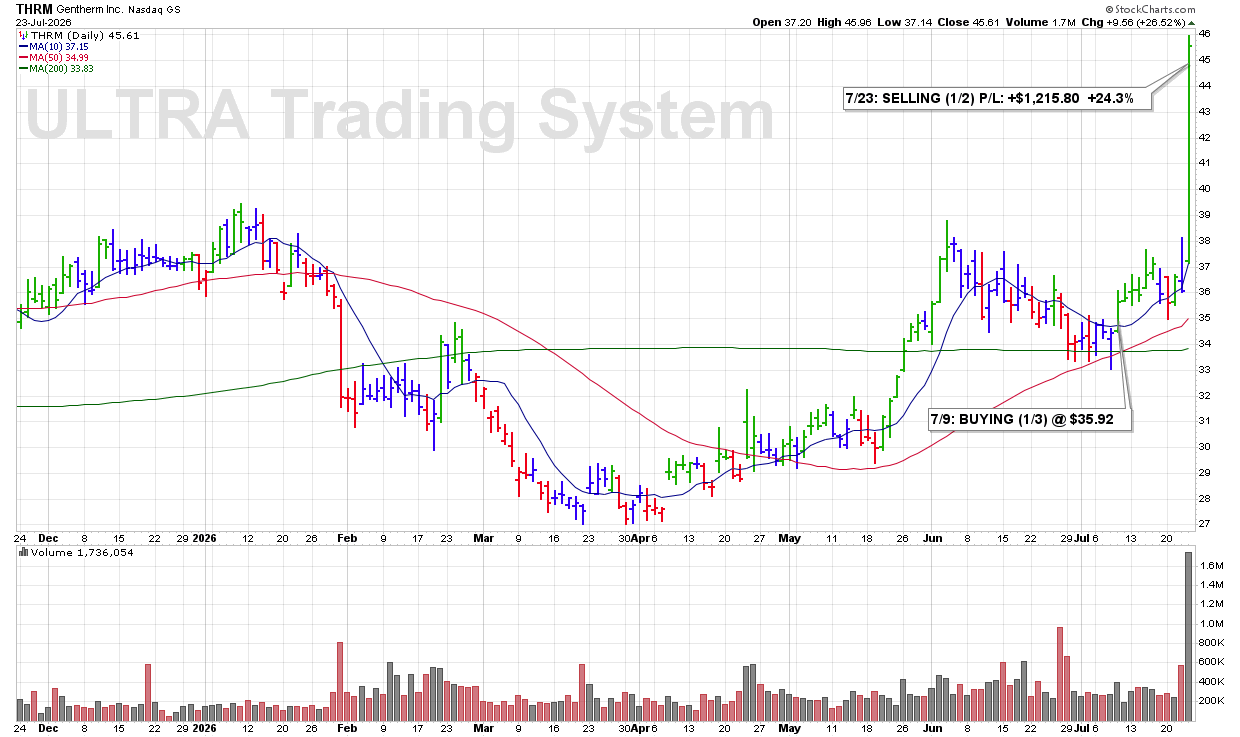
3:36 PM – Selling half of my THRM position here into the close. I’m locking in a portion of these quick gains as my personal trading account reaches a new all-time high. The remaining position allows me to continue participating should the stock’s uptrend persist.
ULTRA Trader’s Tip: There’s Nothing Wrong With Taking Profits
• Strong gains can disappear quickly if they aren’t protected.
• Selling a portion of a winning position locks in profits while allowing the remaining shares to continue working for you.
• Partial profit-taking is a disciplined way to manage both risk and portfolio growth.
CLICK/TAP CHART TO ZOOM
Chart services courtesy of stockcharts.com. Annotations by James Taulman.
10:20 AM – The stock gapped lower this morning, breaking decisively below its 50 DMA. That is a significant technical violation and triggers a 3RD and FINAL SELL SIGNAL under our rules. The breakdown confirms continued technical deterioration and warrants exiting the remaining position.
ULTRA Trader’s Tip: The 50 DMA Is a Critical Support Level
• A decisive break below the 50 DMA often signals that a stock’s intermediate-term trend is changing.
• Gap-down breaks through major support indicate that selling pressure has intensified.
• When a stock violates the 50 DMA after prior SELL SIGNALS, the technical evidence favors exiting the remaining position.

CLICK/TAP CHART TO ZOOM
Chart services courtesy of stockcharts.com. Annotations by James Taulman.
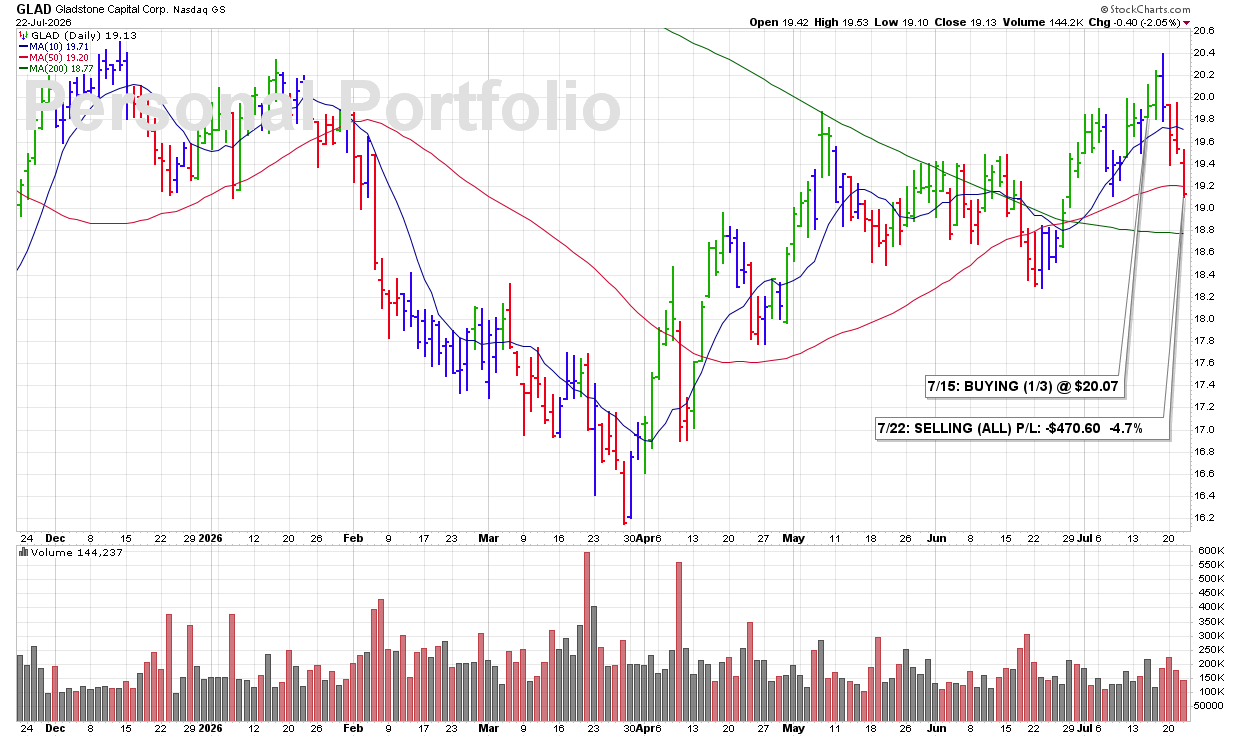
3:34 PM – Selling my entire GLAD position this afternoon after several days of continued weakness. Shares first broke below the 10 DMA and are now violating the 50 DMA, creating too much technical deterioration to ignore. With multiple violations stacking up, I’m taking the loss and moving on.
James’ Trader’s Tip: Respect Stacked Technical Violations
• One technical violation is a warning; multiple violations confirm that weakness is increasing.
• A break below both the 10 DMA and 50 DMA shows deterioration in the short- and intermediate-term trends.
• When bearish signals continue to accumulate, protecting capital becomes the priority.
CLICK/TAP CHART TO ZOOM
Chart services courtesy of stockcharts.com. Annotations by James Taulman.
3:32 PM – Shares first broke below the 10 DMA and are now violating the 50 DMA, creating too much technical deterioration to ignore. With multiple technical violations continuing to stack up, I’m calling a 1ST SELL SIGNAL here.
ULTRA Trader’s Tip: Technical Weakness Often Comes in Stages
• Technical deterioration is usually a process rather than a single event.
• Each additional technical sign of deterioration increases the probability that the stock’s trend is changing.
• Respect ongoing technical weakness. It is a SELL SIGNAL.

CLICK/TAP CHART TO ZOOM
Chart services courtesy of stockcharts.com. Annotations by James Taulman.
9:55 PM – Here is our latest chart update for this recent breakout from our Traditional BreakOuts Watch List.

CLICK/TAP CHART TO ZOOM
Chart services courtesy of stockcharts.com. Annotations by James Taulman.
We are currently reporting on this stock as an active holding and continue to monitor the stock closely for any technical SELL SIGNALS.
The focus always remains on price/volume action around key support levels, including the 10 DMA, 50 DMA, and any nearby trendline or ROUND-$ support.
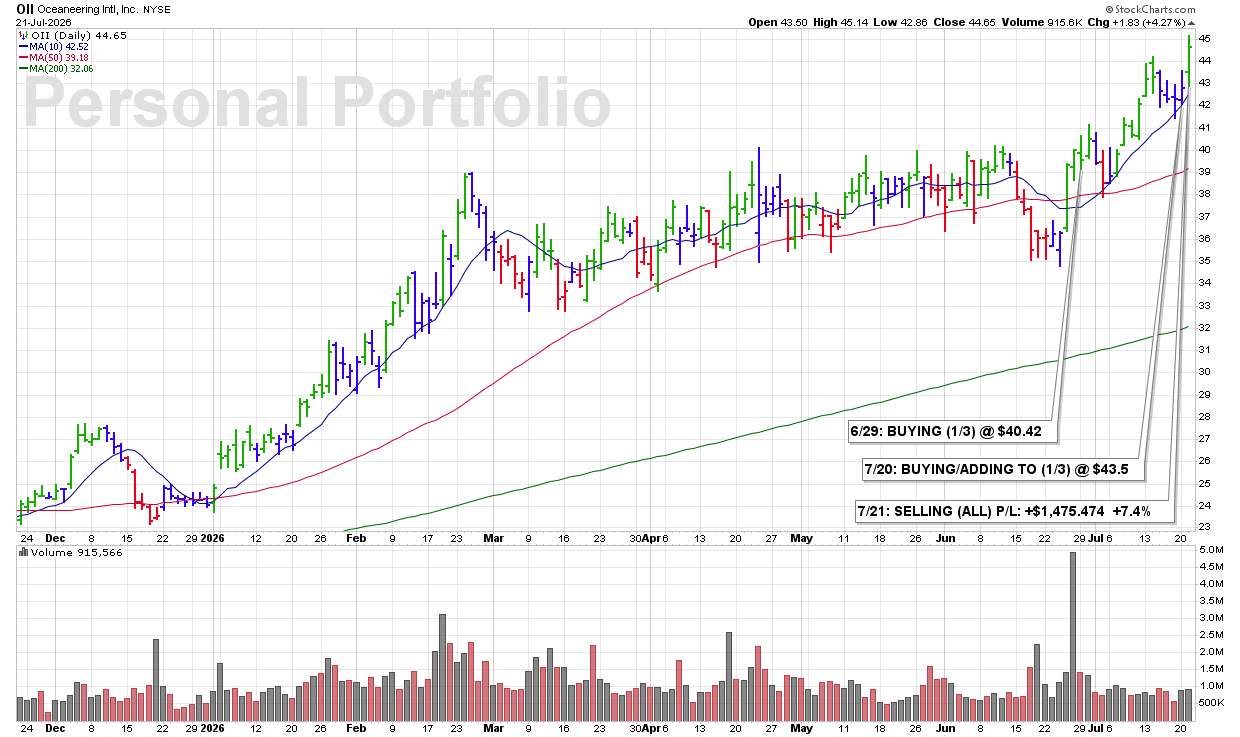
2:28 PM – I’m taking these solid profits in OII as the stock has delivered a respectable gain in a short period of time. With the company scheduled to report earnings tomorrow, I’m choosing to lock in the profit rather than assume the additional overnight earnings risk.
James’ Trader’s Tip: Don’t Be Afraid to Take a Good Profit
• You don’t have to capture every last dollar of a move to be a successful trader.
• Consistently taking solid gains helps build long-term portfolio performance while reducing risk.
• Good trades are measured by disciplined execution—not by selling at the exact top.
CLICK/TAP CHART TO ZOOM
Chart services courtesy of stockcharts.com. Annotations by James Taulman.
10:42 AM – Calling a 1ST SELL SIGNAL this morning as shares clearly break below the 10 DMA, currently at $53.99. Under our rules, a decisive break below the 10 DMA is a default technical violation and triggers an initial SELL SIGNAL.
ULTRA Trader’s Tip: The 10 DMA Is Our First Line of Defense
• The 10 DMA is our primary indicator for identifying changes in short-term trend.
• A decisive break below the 10 DMA is often the first indication that institutional demand is weakening.
• Respecting this initial technical violation helps control risk before more significant weakness develops.
CLICK/TAP CHART TO ZOOM
Chart services courtesy of stockcharts.com. Annotations by James Taulman.
10:22 AM – Calling a 1ST SELL SIGNAL this morning as shares break below the 10 DMA while also violating the important ROUND-$360 support level. Those combined technical violations indicate that the stock’s short-term momentum is weakening and trigger an initial SELL SIGNAL under our rules.
ULTRA Trader’s Tip: Multiple Technical Violations Carry More Weight
• The more bearish technical signals that occur simultaneously, the more meaningful the SELL SIGNAL becomes.
• A break below the 10 DMA coupled with a violation of a key support level is a stronger warning than either signal alone.
• When multiple technical violations begin to stack up, respect the message the market is sending.

CLICK/TAP CHART TO ZOOM
Chart services courtesy of stockcharts.com. Annotations by James Taulman.
8:05 PM – Here is our latest chart update for this recent breakout from our Traditional BreakOuts Watch List.

CLICK/TAP CHART TO ZOOM
Chart services courtesy of stockcharts.com. Annotations by James Taulman.
We are currently reporting on this stock as an active holding and continue to monitor the stock closely for any technical SELL SIGNALS.
The focus always remains on price/volume action around key support levels, including the 10 DMA, 50 DMA, and any nearby trendline or ROUND-$ support.
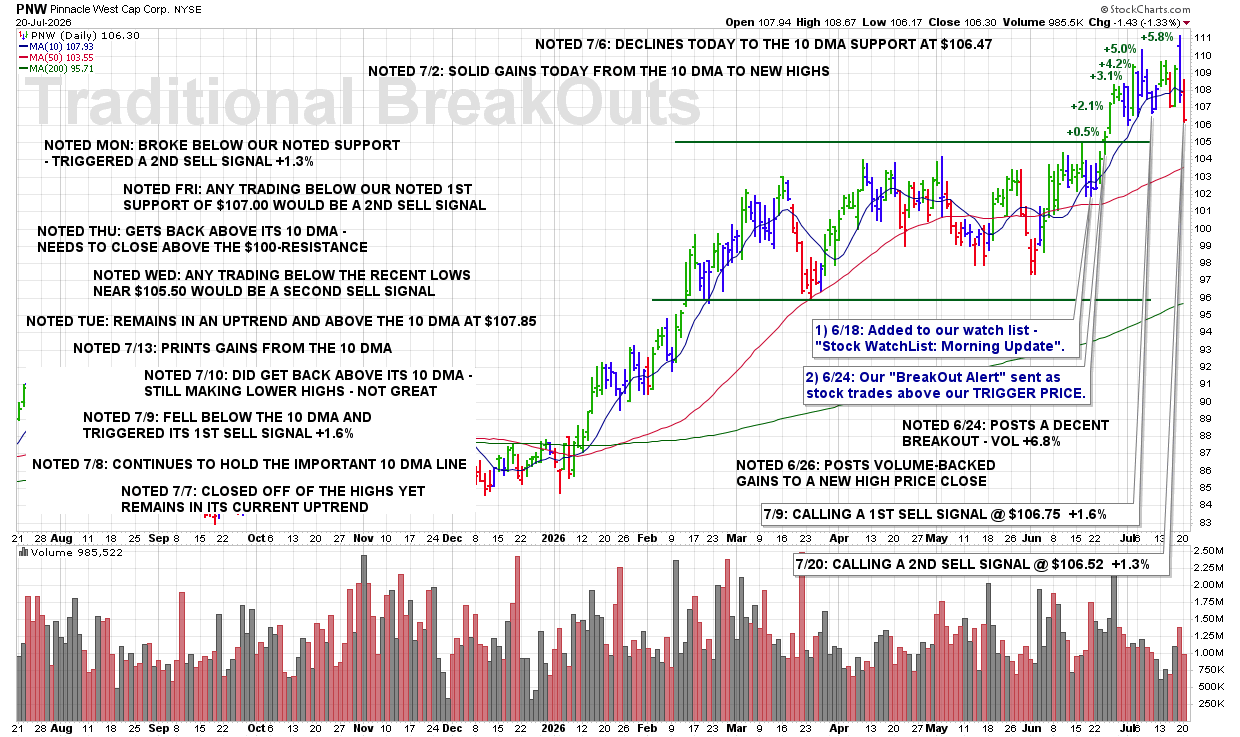
7:55 PM – Here is our latest chart update for this recent breakout from our Traditional BreakOuts Watch List.
CLICK/TAP CHART TO ZOOM
Chart services courtesy of stockcharts.com. Annotations by James Taulman.
We are currently reporting on this stock as an active holding and continue to monitor the stock closely for any technical SELL SIGNALS.
The focus always remains on price/volume action around key support levels, including the 10 DMA, 50 DMA, and any nearby trendline or ROUND-$ support.
3:35 PM – Following Friday’s negative reversal, shares continue to weaken today and appear poised to close below our previously identified support near $107.00. That additional technical deterioration triggers a 2ND SELL SIGNAL. The next area of support to watch is near $105.00.
ULTRA Trader’s Tip: Broken Support Often Becomes Resistance
• A negative reversal frequently signals that buying momentum is beginning to fade.
• When a stock breaks below an established support level, that area often becomes future resistance.
• Scaling out as support levels fail helps reduce risk while preserving capital for stronger technical opportunities.
CLICK/TAP CHART TO ZOOM
Chart services courtesy of stockcharts.com. Annotations by James Taulman.
3:32 PM – Calling a 2ND SELL SIGNAL here due to continued technical weakness. The 10 DMA has clearly become resistance, with shares once again being turned back at that level. In addition, the 10 DMA has rolled over, indicating that a short-term downtrend is beginning to develop. A decisive break below the 50 DMA, currently at $42.89, would trigger a 3RD and FINAL SELL SIGNAL.
ULTRA Trader’s Tip: Ongoing Technical Weakness Matters
• Technical weakness is often a process, not a single event.
• A stock that continues to show signs of deterioration—even without a major breakdown—is sending an important message.
• Repeated bearish technical behavior should be respected, as ongoing weakness is itself a valid SELL SIGNAL.
CLICK/TAP CHART TO ZOOM
Chart services courtesy of stockcharts.com. Annotations by James Taulman.
3:54 PM – Selling my entire APD position here as we head into the close. The stock has been making a series of lower highs and posted a negative reversal today. In addition, the 10 DMA is now rolling over, while the next meaningful support at the 50 DMA remains approximately another 2% below the current share price.
I am responding to these increasingly bearish technical signals while also reducing margin exposure—particularly among technically weaker holdings—in the current market environment.
James’ Trader’s Tip: Reduce Exposure in the Weaker Names
• Lower highs and a negative reversal indicate that buying momentum is deteriorating.
• A rolling-over 10 DMA increases the risk of further weakness toward the 50 DMA.
• When reducing margin, prioritize technically weaker holdings rather than selling your strongest stocks indiscriminately.

CLICK/TAP CHART TO ZOOM
Chart services courtesy of stockcharts.com. Annotations by James Taulman.
10:07 AM – Shares are gapping lower this morning and breaking below our previously identified support at ROUND-$80. That decisive move through support is a technical violation and triggers a 2ND SELL SIGNAL.
ULTRA Trader’s Tip: Watch for Breaks of Our Key Support Levels
• Round-number price levels often act as important areas of support and resistance.
• A gap down through support suggests selling pressure has accelerated.
• Scaling out as technical conditions weaken helps protect gains while reducing overall portfolio risk.

CLICK/TAP CHART TO ZOOM
Chart services courtesy of stockcharts.com. Annotations by James Taulman.
PRIVACY POLICY | TERMS & CONDITIONS