Ongoing updates for GLAD will be posted at the link below, as soon as each one is made available.
https://buyingbreakouts.com/category/glad/
You can bookmark the page for future reference.
Ongoing updates for GLAD will be posted at the link below, as soon as each one is made available.
https://buyingbreakouts.com/category/glad/
You can bookmark the page for future reference.
Ongoing updates for CNO will be posted at the link below, as soon as each one is made available.
https://buyingbreakouts.com/category/cno/
You can bookmark the page for future reference.
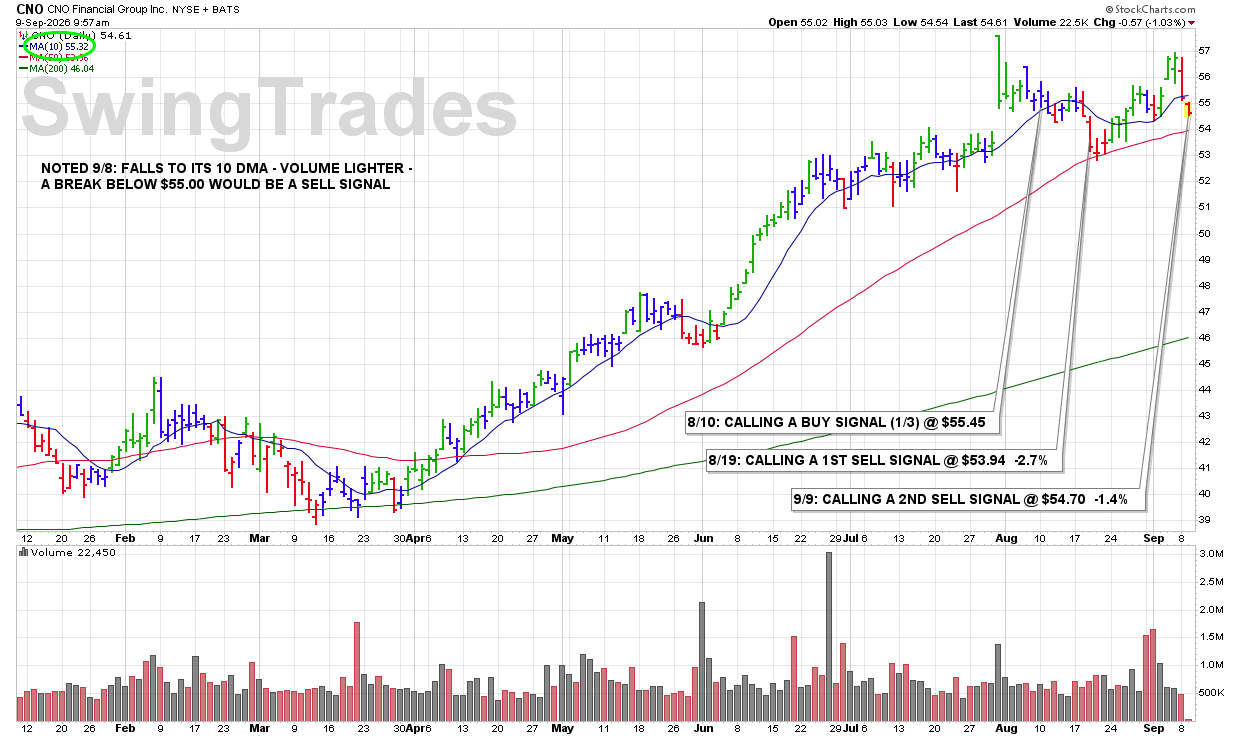
10:12 AM – As reported last night, “a break below $55.00 would be a SELL SIGNAL.” This morning shares are trading below that level while volume is running above average. That drop below the ROUND-$55 support level, accompanied by increased volume, is enough to trigger our 2ND SELL SIGNAL.
ULTRA Trader’s Tip: Define the Sell Level Before It Breaks
• Identifying important support in advance gives us an objective level to act on.
• A break below ROUND-$55 shows that the previously identified support is no longer holding.
• Increased volume adds significance to the violation and reinforces the SELL SIGNAL.
CLICK/TAP CHART TO ZOOM
Chart services courtesy of stockcharts.com. Annotations by James Taulman.
Ongoing updates for CNO will be posted at the link below, as soon as each one is made available.
https://buyingbreakouts.com/category/cno/
You can bookmark the page for future reference.
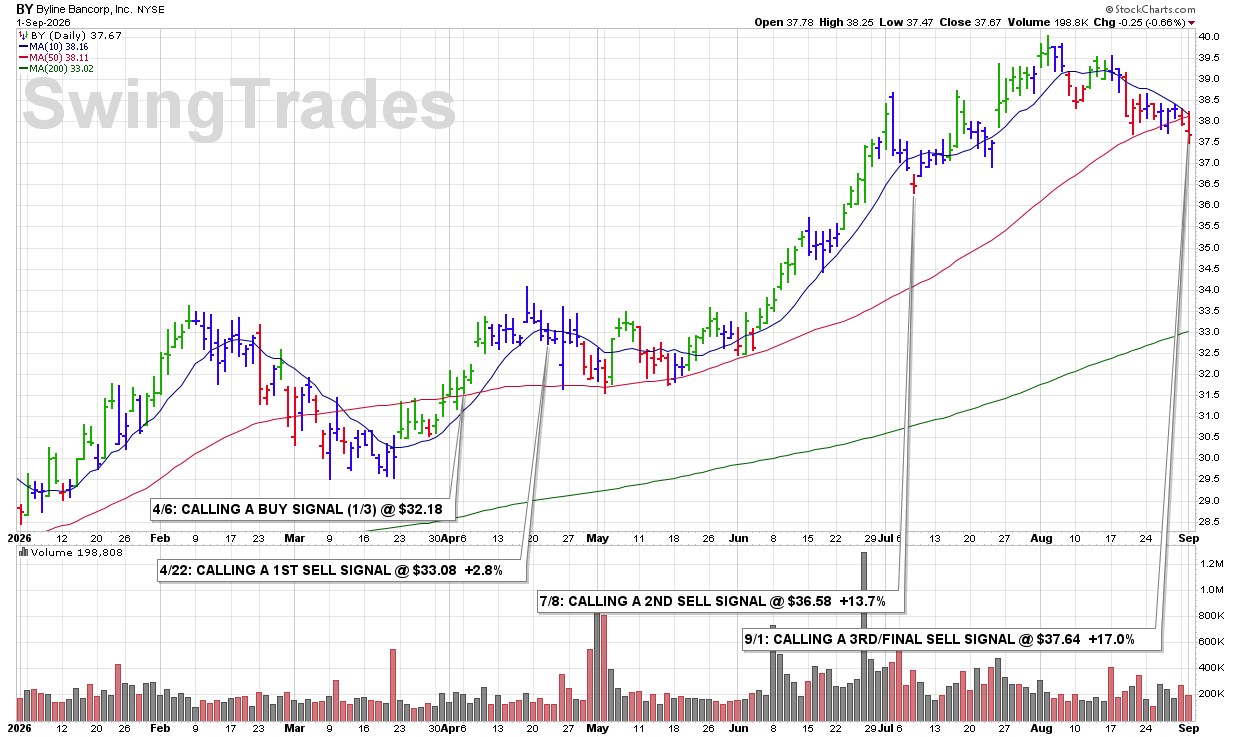
10:05 PM – Calling a FINAL SELL SIGNAL on Byline Bancorp as bearish technical action continues to mount. The 10 DMA has repeatedly weighed on the stock and acted as resistance, while a clear downtrend has developed from the early-August highs near $40.00. Today’s move to a new recent closing low adds another bearish sign and confirms the continued deterioration.
ULTRA Trader’s Tip: Repeated Resistance Can Define the Trend
• When a stock repeatedly fails at the 10 DMA, that line can shift from support to resistance.
• A pattern of lower prices developing from prior highs is evidence that a downtrend is taking shape.
• New recent lows add confirmation that weakness is continuing and support taking the final SELL SIGNAL.
CLICK/TAP CHART TO ZOOM
Chart services courtesy of stockcharts.com. Annotations by James Taulman.
Ongoing updates for BY will be posted at the link below, as soon as each one is made available.
https://buyingbreakouts.com/category/by/
You can bookmark the page for future reference.
1:05 PM – Calling a 3RD and FINAL SELL SIGNAL this afternoon as shares clearly break below their 50 DMA support while volume is on pace to finish above the daily average. That is a significant technical violation and completes all three SELL SIGNALS on this selection.
With each SELL SIGNAL locking in more than a +30% gain, MYE finishes as a clear winning ULTRA swing trade.
ULTRA Trader’s Tip: Scale Out and Protect a Big Winner
• The 50 DMA is an important support level, and a decisive break below it is a major technical warning.
• Scaling out through multiple SELL SIGNALS allows us to systematically protect gains as a stock weakens.
• Completing all three SELL SIGNALS with gains above +30% shows the value of letting strength work while still respecting technical violations.

CLICK/TAP CHART TO ZOOM
Chart services courtesy of stockcharts.com. Annotations by James Taulman.
3:14 PM – Calling a 3RD and FINAL SELL SIGNAL here before the close as shares dip into their 50 DMA support after already showing several bearish technical signs. With weakness continuing to build and major support now being tested, I’m closing out this selection under our rules.
ULTRA Trader’s Tip: Multiple Weakness Signals Add Up
• One bearish sign may be manageable, but several technical violations together deserve more attention.
• A test of the 50 DMA becomes more significant when the stock has already been showing ongoing weakness.
• When bearish evidence continues to stack up, follow the rules and reduce exposure.

CLICK/TAP CHART TO ZOOM
Chart services courtesy of stockcharts.com. Annotations by James Taulman.
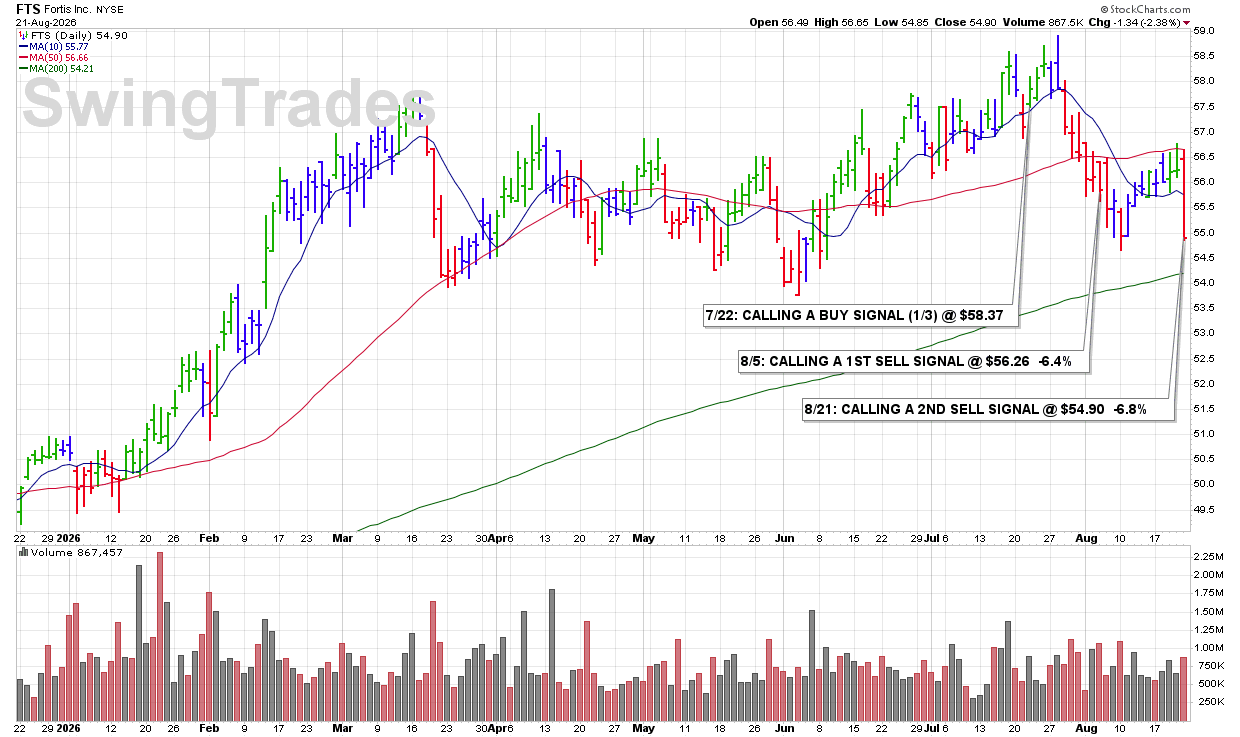
3:59 PM – Calling a 2ND and FINAL SELL SIGNAL just before the close as shares sell off this afternoon and break below the ROUND-$55 support level while volume runs 28% above average. The combination of continued price weakness, a loss of support, and increased selling volume confirms further technical deterioration and closes out coverage on this selection.
ULTRA Trader’s Tip: Increased Volume Confirms the Weakness
• Breaking a previously identified support level is an important technical violation.
• When that break occurs on above-average volume, it adds conviction to the bearish action.
• When price and volume confirm continued weakness, follow the signal and move on.
CLICK/TAP CHART TO ZOOM
Chart services courtesy of stockcharts.com. Annotations by James Taulman.
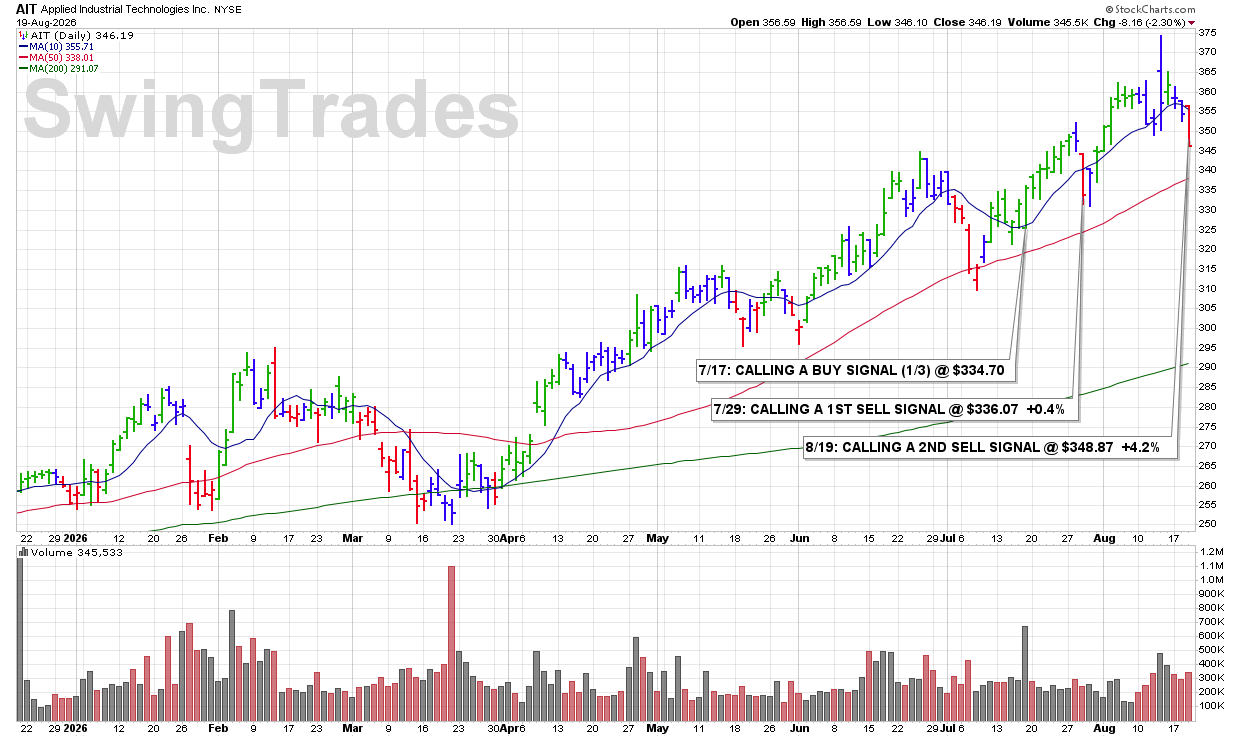
3:36 PM – Calling a 2ND SELL SIGNAL as shares break below our noted 1st SUPPORT at the ROUND-$350 level and appear set to close near the session lows. The next significant support is the 50 DMA, currently at $338.46, approximately 2.3% below the current price. A break of that level would represent another significant technical violation.
ULTRA Trader’s Tip: Support Levels Give Us a Roadmap
• Identifying support levels in advance removes guesswork when a stock begins weakening.
• When one level fails, immediately know where the next important technical support lies.
• If weakness continues and the next major support level also breaks, that provides additional evidence to reduce exposure.
CLICK/TAP CHART TO ZOOM
Chart services courtesy of stockcharts.com. Annotations by James Taulman.
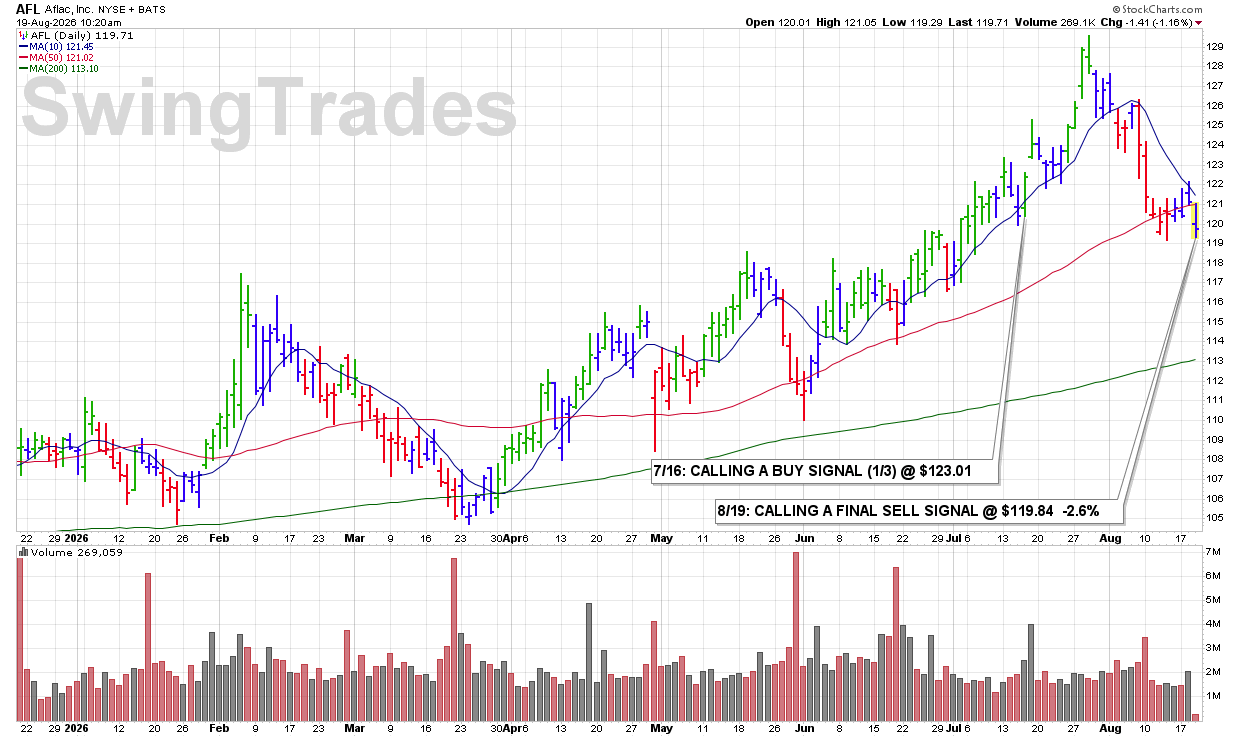
10:11 AM – The stock is gapping down this morning and breaking below our previously noted ROUND-$120 support on increased volume. The combination of a gap lower, loss of support, and expanding selling volume represents multiple bearish technical violations. Calling a 2ND yet FINAL SELL SIGNAL here and to close out coverage on this selection.
ULTRA Trader’s Tip: Multiple Violations Strengthen the Signal
• A gap lower immediately shows increased selling pressure.
• Breaking a previously identified support level adds another bearish technical violation.
• When weakness is accompanied by increased volume, the evidence becomes even stronger—respect the signal and move on.
CLICK/TAP CHART TO ZOOM
Chart services courtesy of stockcharts.com. Annotations by James Taulman.
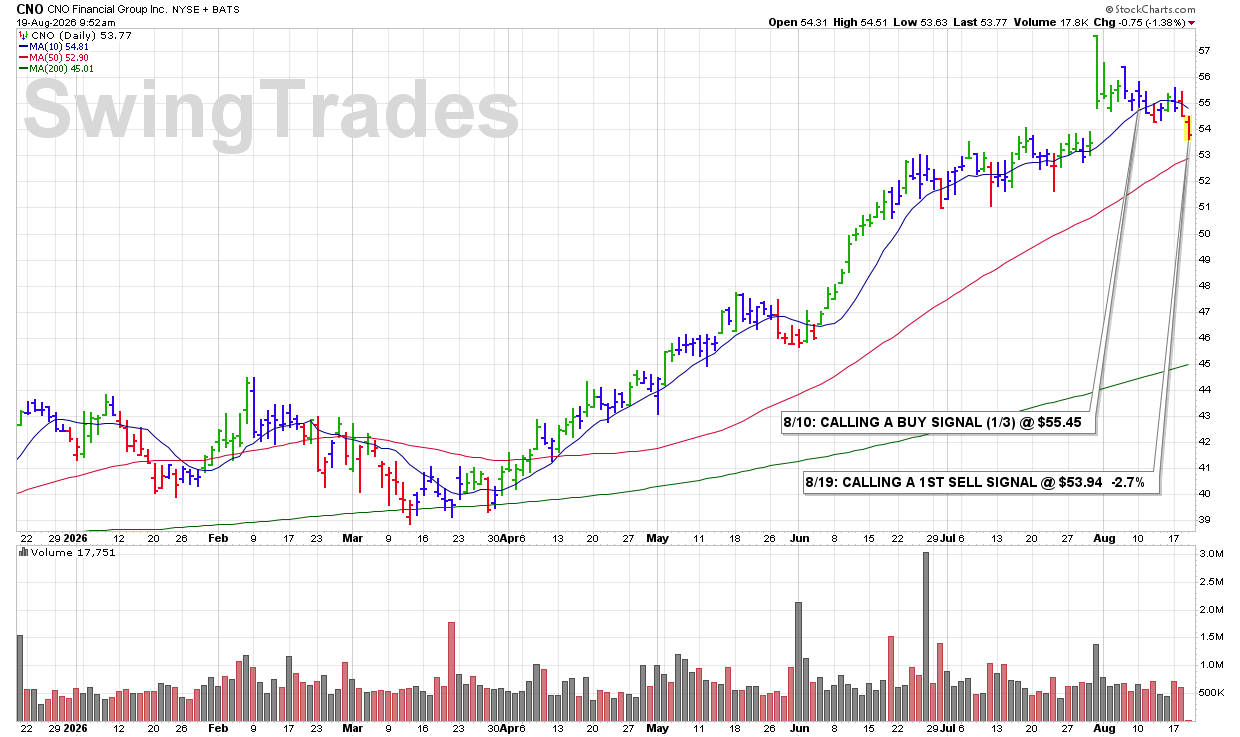
9:37 AM – Calling a 1ST SELL SIGNAL this morning as shares sell off on increased volume and clearly lose support at the 10 DMA. That combination of declining price, expanding volume, and a break of our primary technical support level represents a standard SELL SIGNAL under our rules.
ULTRA Trader’s Tip: Price and Volume Should Confirm Each Other
• A break below the 10 DMA is an important technical warning.
• When that break occurs with increased selling volume, the violation carries greater significance.
• Responding to weakness early helps keep a manageable loss from developing into something larger.
CLICK/TAP CHART TO ZOOM
Chart services courtesy of stockcharts.com. Annotations by James Taulman.
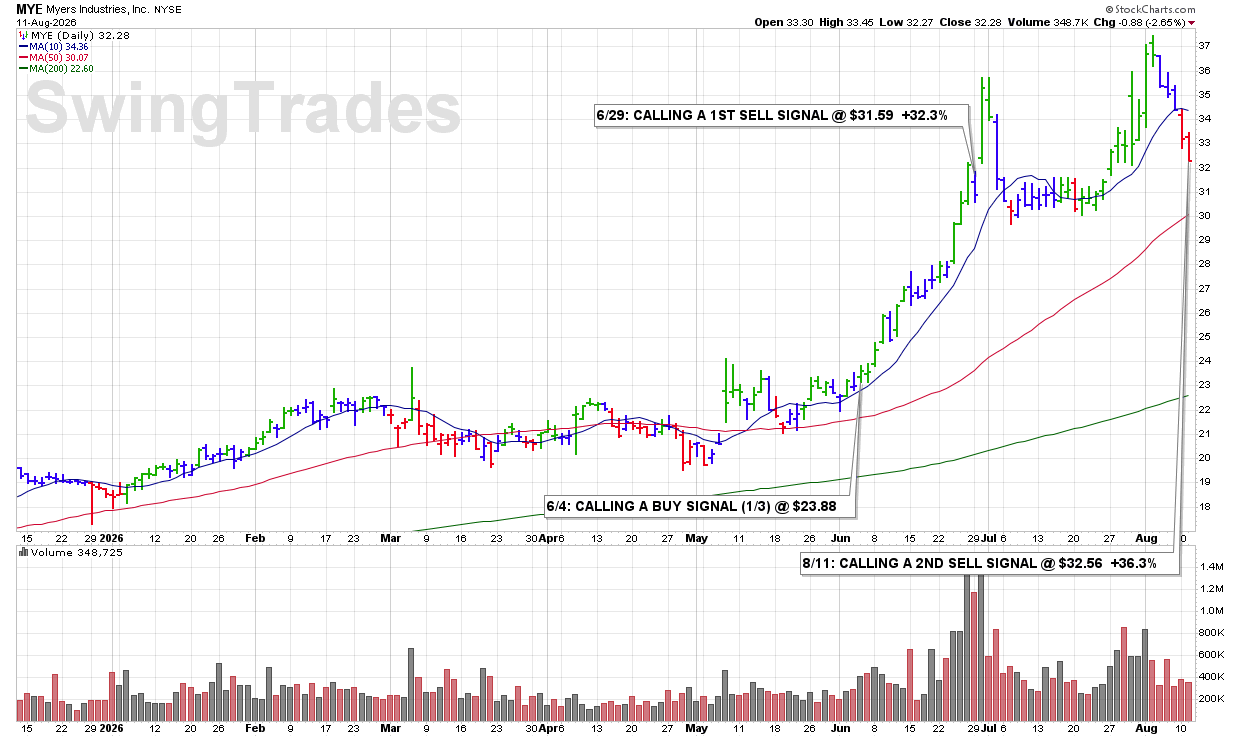
3:44 PM – Calling a 2ND SELL SIGNAL as we head into today’s close. The stock has clearly lost its 10 DMA (blue line) and has continued to exhibit bearish technical action with a string of down days from its recent high. With a substantial +36.3% gain still intact, the continued deterioration is another signal to take additional profits and reduce exposure.
ULTRA Trader’s Tip: Protect Big Winners as Weakness Develops
• A strong previous gain does not override current bearish technical action.
• A string of declining sessions followed by a clear 10 DMA violation signals that momentum has changed.
• Scaling out allows you to systematically protect profits as technical weakness develops rather than waiting for the entire gain to disappear.
CLICK/TAP CHART TO ZOOM
Chart services courtesy of stockcharts.com. Annotations by James Taulman.
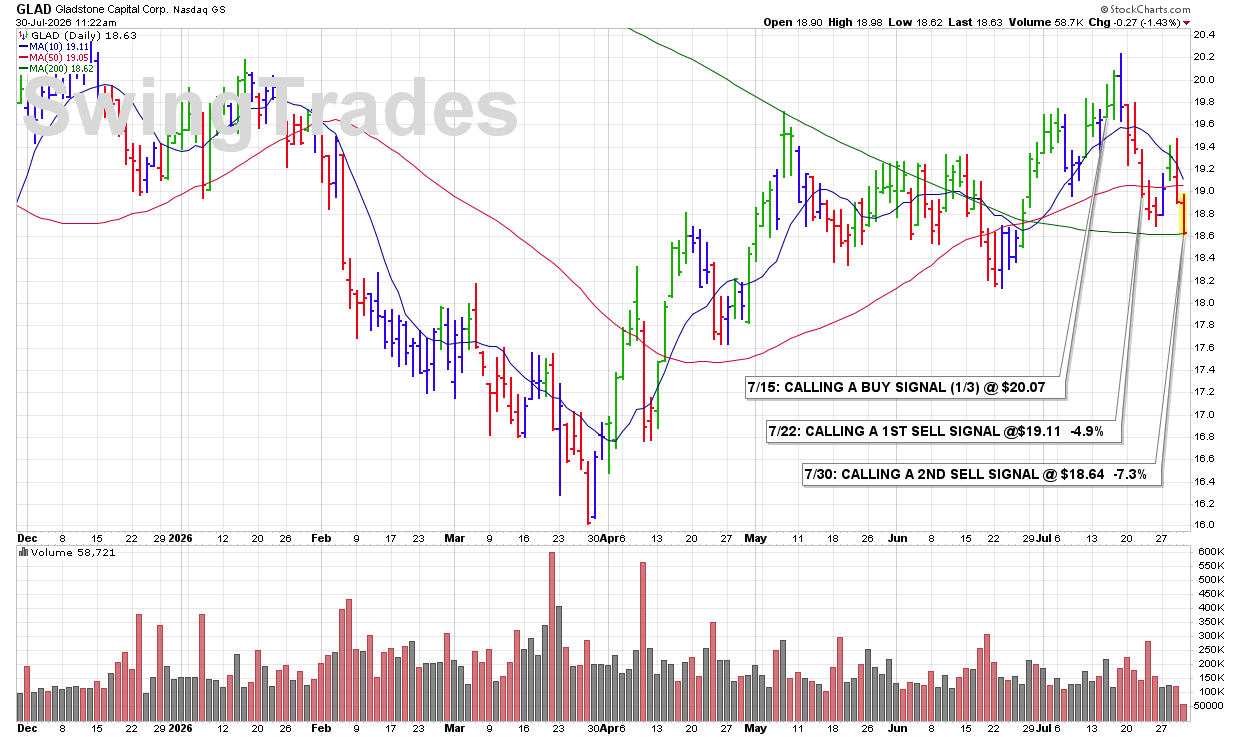
7/30 THU: GLAD – CALLING A 2ND SELL SIGNAL @ $18.64 -7.3%
11:14 AM – Calling a 2ND SELL SIGNAL as shares continue to trade lower on above-average volume and exhibit persistent technical weakness. The continued decline, combined with elevated selling volume, indicates that downside pressure remains in control and warrants further reducing the position.
ULTRA Trader’s Tip: Respect Weakness When Selling Persists
• Continued price deterioration after an initial sell signal confirms that the stock has not stabilized.
• Above-average volume during a decline can indicate sustained institutional distribution.
• Reducing exposure as weakness progresses helps contain losses and preserve capital for stronger opportunities.
CLICK/TAP CHART TO ZOOM
Chart services courtesy of stockcharts.com. Annotations by James Taulman.
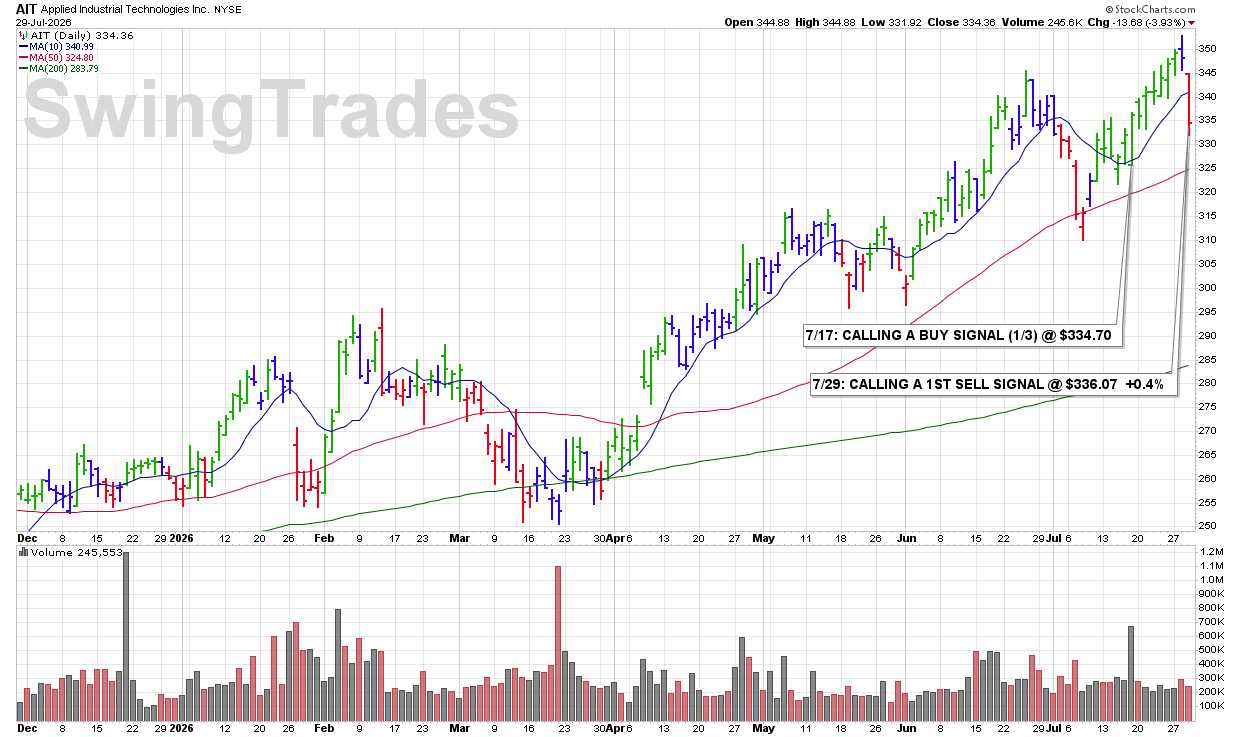
10:12 AM – Calling a 1ST SELL SIGNAL as shares are breaking below the 10 DMA this morning. This represents a technical violation of our primary support level and triggers a standard SELL SIGNAL under the ULTRA Trading System.
ULTRA Trader’s Tip: Follow Your Rules Consistently
• A break below the 10 DMA is an early warning that a stock’s momentum may be weakening.
• Consistently following predefined sell rules helps remove emotion from the decision-making process.
• Small, disciplined sells early can help protect capital if additional technical weakness develops.
CLICK/TAP CHART TO ZOOM
Chart services courtesy of stockcharts.com. Annotations by James Taulman.
3:32 PM – Shares first broke below the 10 DMA and are now violating the 50 DMA, creating too much technical deterioration to ignore. With multiple technical violations continuing to stack up, I’m calling a 1ST SELL SIGNAL here.
ULTRA Trader’s Tip: Technical Weakness Often Comes in Stages
• Technical deterioration is usually a process rather than a single event.
• Each additional technical sign of deterioration increases the probability that the stock’s trend is changing.
• Respect ongoing technical weakness. It is a SELL SIGNAL.

CLICK/TAP CHART TO ZOOM
Chart services courtesy of stockcharts.com. Annotations by James Taulman.
9:56 AM – Shares are gapping down this morning and clearly breaking below the 10 DMA. This follows a sharp Negative Reversal just a few sessions earlier and confirms further technical deterioration. Calling a 2ND SELL SIGNAL here.
ULTRA Trader’s Tip: Warning Signs Often Arrive in Sequence
• A Negative Reversal can be the first sign that momentum is changing.
• A subsequent break below the 10 DMA confirms that weakness is developing.
• Recognizing the sequence early helps protect gains before the chart deteriorates further.

CLICK/TAP CHART TO ZOOM
Chart services courtesy of stockcharts.com. Annotations by James Taulman.
10:03 AM – Shares are posting new recent lows this morning as the bearish action continues. Calling a 3RD and FINAL SELL SIGNAL here to fully close out coverage of this selection.
ULTRA Trader’s Tip: Continued Weakness Confirms the Trend
• New recent lows indicate that sellers remain in control.
• Repeated technical weakness reduces the probability of a quick recovery.
• A FINAL SELL SIGNAL closes out coverage and allows us to focus on stronger opportunities.

CLICK/TAP CHART TO ZOOM
Chart services courtesy of stockcharts.com. Annotations by James Taulman.
3:42 PM – Shares fell below their 50 DMA today. That is a significant technical violation and triggers a FINAL SELL SIGNAL under our rules.
ULTRA Trader’s Tip: Respect the 50 DMA
• The 50 DMA often serves as a key dividing line between healthy uptrends and weakening charts.
• Stocks that lose this level frequently require time to repair their technical damage.
• Final SELL SIGNALS help preserve capital and prepare you for stronger opportunities ahead.

CLICK/TAP CHART TO ZOOM
Chart services courtesy of stockcharts.com. Annotations by James Taulman.
3:38 PM – After closing below its 10 DMA yesterday, shares now look likely to finish today’s session below the 50 DMA. That additional technical violation triggers a 2ND SELL SIGNAL under our rules.
ULTRA Trader’s Tip: Multiple Technical Violations Increase Risk
• A break of the 10 DMA is often the first warning sign of weakening momentum.
• Losing the 50 DMA shortly afterward shows that sellers are gaining control.
• When technical support levels fail in succession, reducing exposure becomes increasingly prudent.

CLICK/TAP CHART TO ZOOM
Chart services courtesy of stockcharts.com. Annotations by James Taulman.
3:39 PM – Calling a 3RD and FINAL SELL SIGNAL this afternoon as shares continue to sell off with volume running +80% above average. That surge in selling volume confirms the stock’s technical deterioration and supports a complete exit.
ULTRA Trader’s Tip: Heavy Volume Deserves Respect
• Sharp declines on expanding volume often reflect institutional selling.
• Heavy-volume breakdowns typically carry more significance than low-volume pullbacks.
• When price and volume confirm the same bearish message, it usually pays to follow the chart.

CLICK/TAP CHART TO ZOOM
Chart services courtesy of stockcharts.com. Annotations by James Taulman.
10:05 AM – Calling a 1ST SELL SIGNAL here to lock in some solid profits as shares begin to get extended from the 10 DMA. Taking partial profits after a strong advance is consistent with our disciplined trading approach.
ULTRA Trader’s Tip: Selling Into Strength Is a Strategy
• Taking partial profits after a strong run helps reduce risk without abandoning the trade.
• Stocks that become extended from the 10 DMA often pull back to reset.
• Scaling out allows you to protect gains while still participating if the uptrend continues.

CLICK/TAP CHART TO ZOOM
Chart services courtesy of stockcharts.com. Annotations by James Taulman.
3:39 PM – The stock has been turned back from its 10 DMA and appears likely to post a new recent low close. That continued weakness triggers a 3RD and FINAL SELL SIGNAL.
ULTRA Trader’s Tip: Lower Lows Confirm Weakness
• Failed rallies into the 10 DMA often signal sellers remain in control.
• New low closes suggest downside momentum is still building.
• Final SELL SIGNALS are designed to remove capital from stocks that are no longer acting right.

CLICK/TAP CHART TO ZOOM
Chart services courtesy of stockcharts.com. Annotations by James Taulman.
3:38 PM – The stock is clearly breaking below the 10 DMA. After recent signs of weakening momentum, a downtrend may now be developing. I’m calling a 3RD and FINAL SELL SIGNAL here this afternoon.
ULTRA Trader’s Tip: Trends Deserve Respect
• Strong stocks typically hold above their 10 DMA during sustained advances.
• Repeated breaks of support often signal a shift from accumulation to distribution.
• The goal is to capture the bulk of a move, not hold through the entire reversal.

CLICK/TAP CHART TO ZOOM
Chart services courtesy of stockcharts.com. Annotations by James Taulman.
9:40 AM – IBP is breaking down to new lows this morning. The stock is clearly trading below ROUND-$200 support and continues to show significant technical weakness. This triggers a FINAL SELL SIGNAL.
ULTRA Trader’s Tip: Never Argue With the Chart
• Stocks making new lows are signaling that sellers remain in control.
• Breaks of major support levels often attract additional selling pressure.
• The purpose of a FINAL SELL SIGNAL is to stop the damage and preserve capital for stronger opportunities.

CLICK/TAP CHART TO ZOOM
Chart services courtesy of stockcharts.com. Annotations by James Taulman.
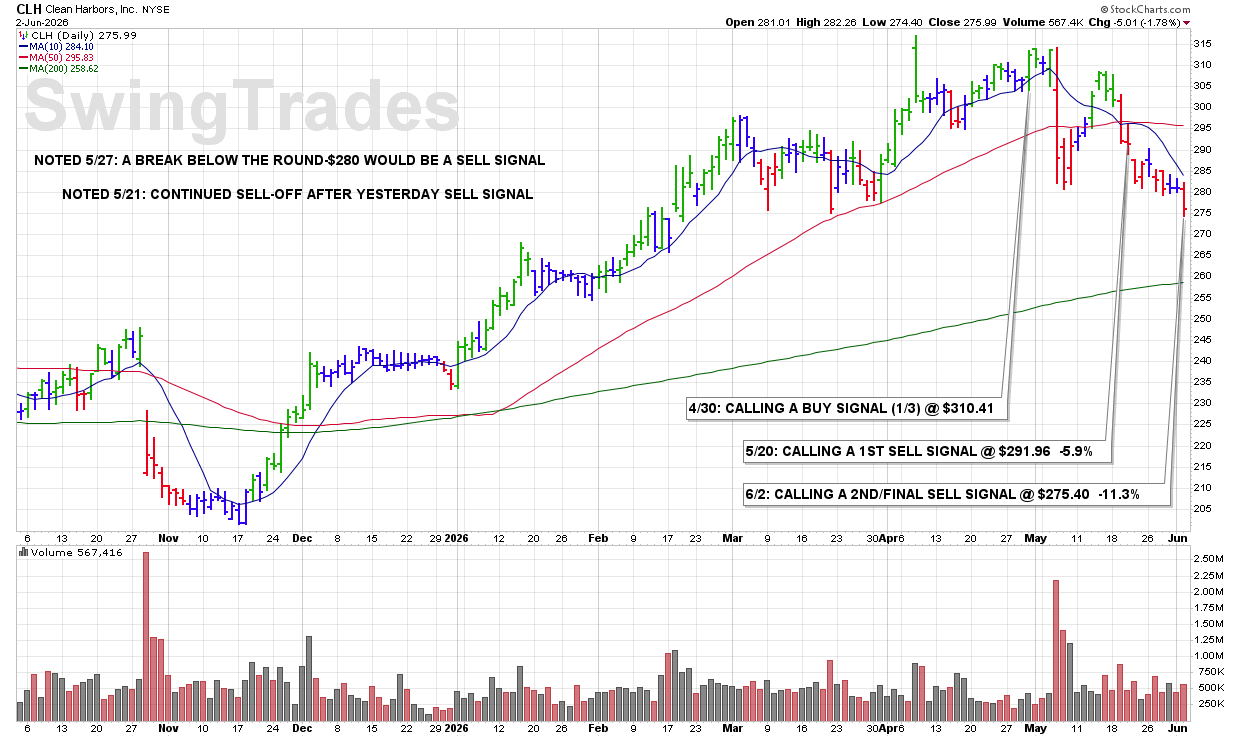
3:26 PM – Shares are clearly breaking below the noted support level at ROUND-$280. While this is only the 2ND SELL SIGNAL, the magnitude of the technical deterioration warrants a FINAL SELL SIGNAL.
ULTRA Trader’s Tip: Price Levels Matter
• Round-number levels often act as important support and resistance zones.
• When a stock decisively breaks a widely watched support level, additional selling can follow.
• The goal is not to be right on every trade, but to keep losses controlled when the chart changes character.
CLICK/TAP CHART TO ZOOM
Chart services courtesy of stockcharts.com. Annotations by James Taulman.
3:27 PM – Shares are selling off on above-average volume and appear likely to close below their 10 DMA. That combination signals weakening momentum and triggers a 3RD and FINAL SELL SIGNAL on this profitable swing trade.
ULTRA Trader’s Tip: Finish the Trade the Same Way You Started It
• The 10 DMA is the heartbeat of our trading system.
• Higher-volume selling often confirms a shift in momentum.
• Following sell rules consistently is what turns individual trades into long-term performance.

CLICK/TAP CHART TO ZOOM
Chart services courtesy of stockcharts.com. Annotations by James Taulman.
2:45 PM – Shares are selling off with an increase in volume following the recent loss of the 10 DMA. With no meaningful support nearby until approximately ROUND-$65 and the 50 MDA, I am calling a 2ND SELL SIGNAL here before the close.
ULTRA Trader’s Tip: Respect Volume on the Way Down
• Selling pressure accompanied by higher volume deserves attention.
• Once the 10 DMA is lost, downside momentum can accelerate quickly.
• Reducing exposure as support levels disappear helps preserve gains and limit risk.

CLICK/TAP CHART TO ZOOM
Chart services courtesy of stockcharts.com. Annotations by James Taulman.
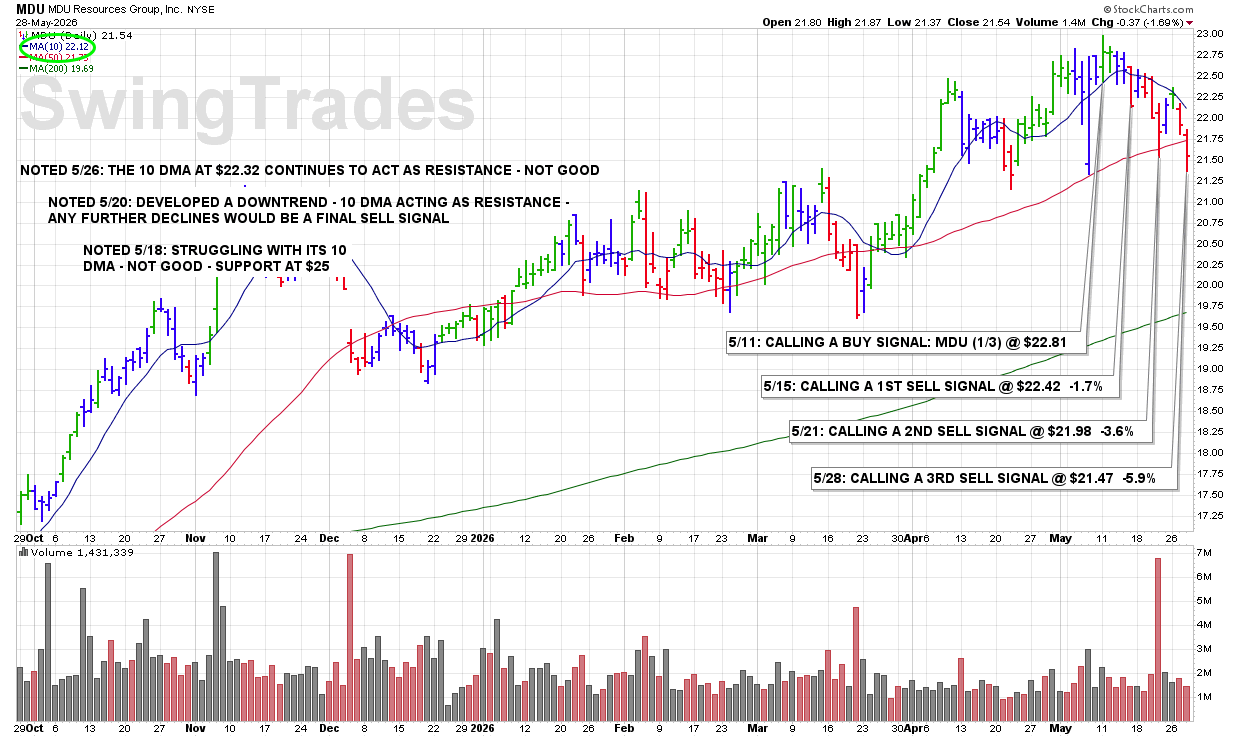
3:27 PM – The stock is breaking below the 50 DMA. That is a significant technical violation and triggers a 3RD and FINAL SELL SIGNAL under our rules.
ULTRA Trader’s Tip: The 50 DMA Is Major Support
• The 50 DMA often serves as an important institutional support level.
• Breaks below this line signal increasing intermediate-term weakness.
• Final exits help preserve capital when a stock’s technical character changes.
CLICK/TAP CHART TO ZOOM
Chart services courtesy of stockcharts.com. Annotations by James Taulman.
Latest Chart Update: TRP
8:40 PM – We are currently reporting on this stock as an active holding and continue to monitor the stock closely for any technical SELL SIGNALS.
The focus always remains on price/volume action around key support levels, including the 10 DMA, 50 DMA, and any nearby trendline or ROUND-$ support.

CLICK/TAP CHART TO ZOOM
Chart services courtesy of stockcharts.com. Annotations by James Taulman.
Latest Chart Update: MGA
8:30 PM – We are currently reporting on this stock as an active holding and continue to monitor the stock closely for any technical SELL SIGNALS.
The focus always remains on price/volume action around key support levels, including the 10 DMA, 50 DMA, and any nearby trendline or ROUND-$ support.

CLICK/TAP CHART TO ZOOM
Chart services courtesy of stockcharts.com. Annotations by James Taulman.
3:38 PM – Calling a 2ND SELL SIGNAL this afternoon as the stock continues trading higher and becomes extended from its 10 DMA, while volume remains well below average. The lack of strong volume support raises the risk of a pullback.
ULTRA Trader’s Tip: Weak Volume Behind Gains Is a Warning
• Strong advances are more reliable when supported by strong volume.
• Stocks extended too far above the 10 DMA often become vulnerable to pullbacks.
• Taking partial profits into weak-volume strength helps protect gains.

CLICK/TAP CHART TO ZOOM
Chart services courtesy of stockcharts.com. Annotations by James Taulman.
3:36 PM – Calling a 2ND SELL SIGNAL here as the stock is essentially being turned back from its 10 DMA this afternoon and appears likely to close below the 50 DMA. That combination signals continued technical deterioration.
ULTRA Trader’s Tip: Failed Rebounds Are Bearish
• Stocks rejected at the 10 DMA often struggle to regain momentum.
• A close below the 50 DMA confirms increasing technical weakness.
• Multiple failed recovery attempts usually signal sellers remain in control.

CLICK/TAP CHART TO ZOOM
Chart services courtesy of stockcharts.com. Annotations by James Taulman.
3:34 PM – This stock is triggering a SELL SIGNAL as it breaks below the 10 DMA, ROUND-$135, and appears likely to close below the 200 DMA. Those stacked technical violations signal meaningful technical deterioration.
ULTRA Trader’s Tip: Multiple Breaks Increase Risk
• Breaks of the 10 DMA often signal weakening short-term momentum.
• Losses of key price levels like ROUND-$135 add to the bearish picture.
• A close below the 200 DMA signals institutions may be stepping away from the stock.

CLICK/TAP CHART TO ZOOM
Chart services courtesy of stockcharts.com. Annotations by James Taulman.
9:41 AM – Calling a 1ST SELL SIGNAL this morning as shares are breaking below the 10 DMA. That technical violation signals weakening short-term momentum.
ULTRA Trader’s Tip: The First Break Is the First Warning
• Breaks below the 10 DMA are early signs momentum may be shifting.
• Acting on initial SELL SIGNALS helps protect gains before weakness expands.
• Good risk management is about responding early, not reacting late.

CLICK/TAP CHART TO ZOOM
Chart services courtesy of stockcharts.com. Annotations by James Taulman.
3:46 PM – Calling a 2ND profit-taking SELL SIGNAL here before the close as shares continue to hold recent gains.
ULTRA Trader’s Tip: Scale Out Into Strength
• Selling in stages helps lock in gains while the trend remains intact.
• Partial exits reduce emotional pressure and portfolio risk.
• Strong trading is about managing positions, not chasing perfection.

CLICK/TAP CHART TO ZOOM
Chart services courtesy of stockcharts.com. Annotations by James Taulman.
3:29 PM – Calling a 1ST SELL SIGNAL here to lock in some profits following the recent advance.
ULTRA Trader’s Tip: Taking Partial Profits Reduces Pressure
• Selling in thirds allows you to lock in gains while still participating in the trend.
• Partial profit-taking helps reduce emotional decision-making.
• Strong trading is about managing positions, not trying to pick exact tops.

CLICK/TAP CHART TO ZOOM
Chart services courtesy of stockcharts.com. Annotations by James Taulman.
9:51 AM – Calling a 2ND SELL SIGNAL here as the stock is selling off and breaking below ROUND-$22 support with a sharp increase in volume. That combination signals increasing technical weakness and institutional selling pressure.
ULTRA Trader’s Tip: Volume Accelerates the Message
• Breaks of key support levels become more significant on heavy volume.
• Sharp sell-offs often signal institutions are exiting positions.
• Scaling out early helps preserve capital when downside momentum builds.

CLICK/TAP CHART TO ZOOM
Chart services courtesy of stockcharts.com. Annotations by James Taulman.
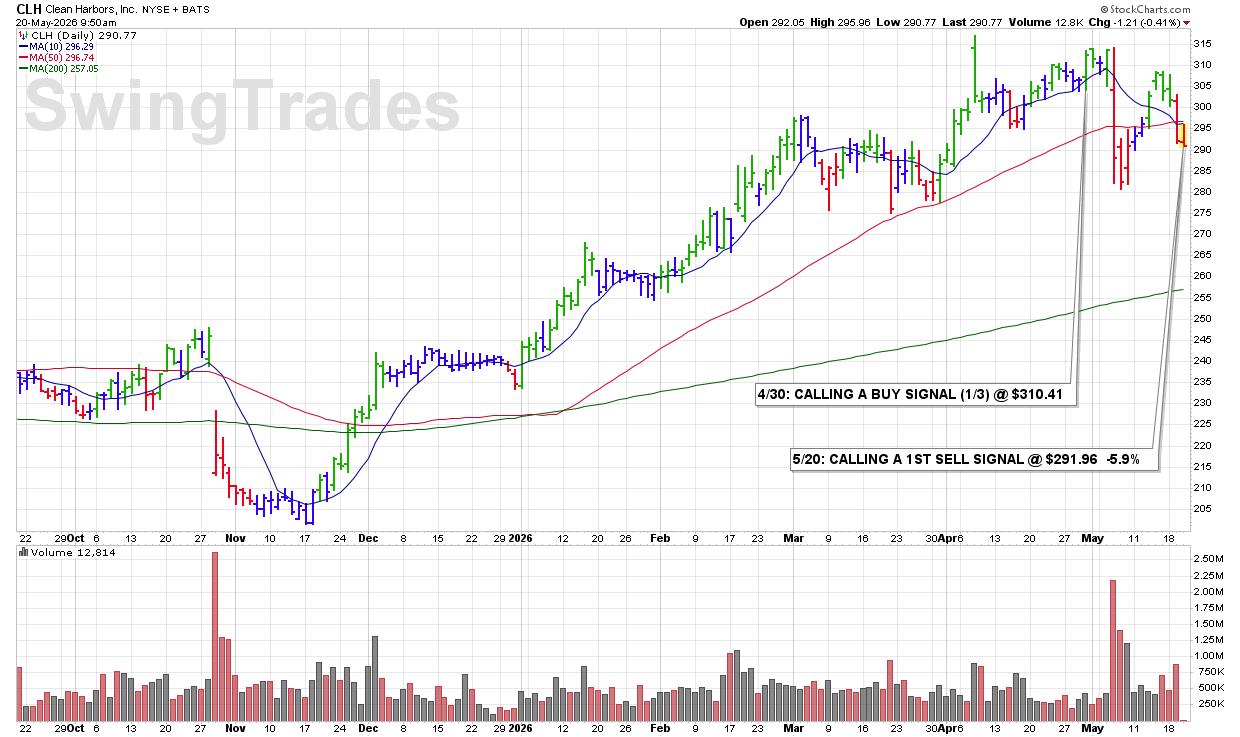
9:37 AM – Calling a 1ST SELL SIGNAL this morning as shares are clearly breaking below the stacked 10 DMA and 50 DMA lines. Those combined technical violations signal weakening momentum and increasing downside risk.
ULTRA Trader’s Tip: Stacked Moving Averages Matter
• When both the 10 DMA and 50 DMA fail together, the message is more bearish.
• Multiple technical violations often lead to additional selling pressure.
• Early risk reduction helps preserve capital during trend deterioration.
CLICK/TAP CHART TO ZOOM
Chart services courtesy of stockcharts.com. Annotations by James Taulman.
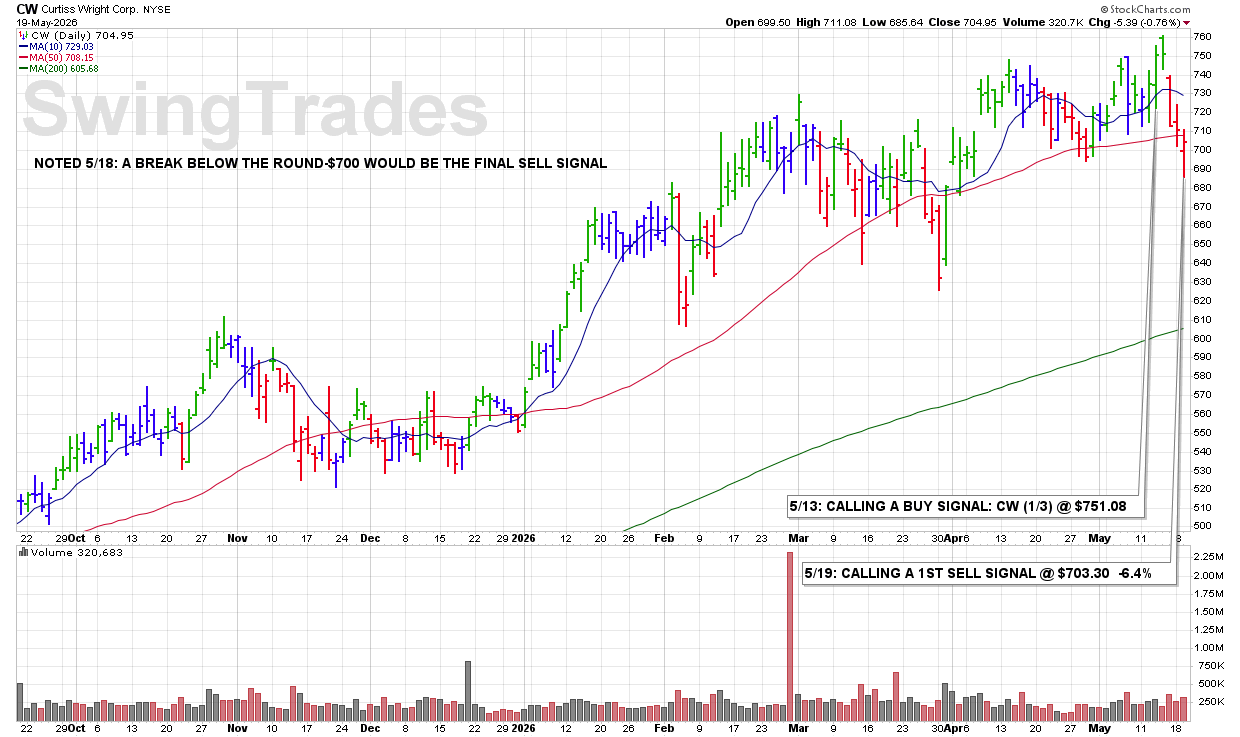
3:28 PM – Shares of CW continue to show bearish action. After recently breaking below the 10 DMA, and then the 50 DMA, shares are now breaking below ROUND-$700 on above-average volume. That stacked technical deterioration warrants a FINAL SELL SIGNAL.
ULTRA Trader’s Tip: Multiple Violations Confirm the Trend Shift
• A break of the 10 DMA is often the first warning sign.
• Losing the 50 DMA confirms deeper technical weakness.
• Additional breaks of key price levels — especially on volume — signal it’s time to exit and protect capital.
CLICK/TAP CHART TO ZOOM
Chart services courtesy of stockcharts.com. Annotations by James Taulman.
9:42 AM – Calling a 3RD and FINAL SELL SIGNAL on FIVE this morning as shares are being turned back from their 10 DMA. That line is now acting as resistance, confirming continued technical weakness.
ULTRA Trader’s Tip: When the 10 DMA Turns Into Resistance
• Strong stocks use the 10 DMA as support during uptrends.
• Once rallies fail at that line, momentum has shifted.
• Final exits help prevent additional downside when weakness persists.

CLICK/TAP CHART TO ZOOM
Chart services courtesy of stockcharts.com. Annotations by James Taulman.
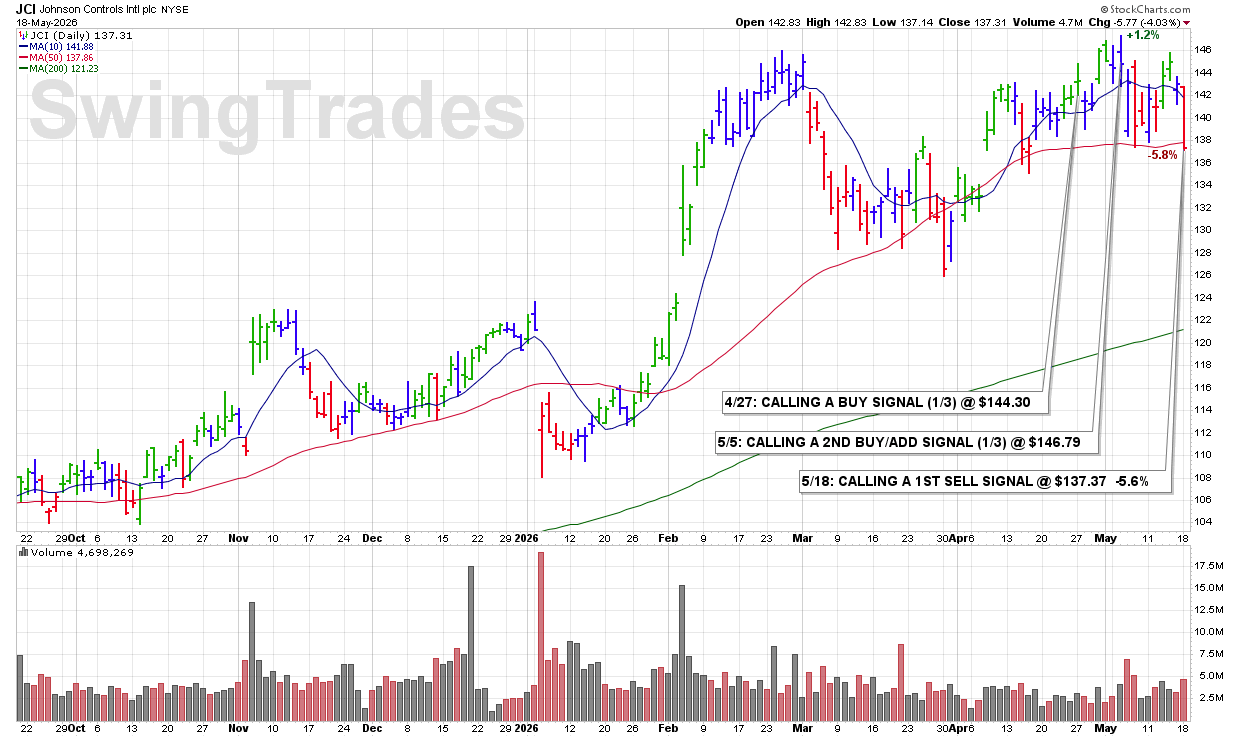
3:29 PM – The stock is closing below its 50 DMA after selling off -4% today on a +37% increase in volume. Breaks of the 50 DMA are technical violations and clear SELL SIGNALS under our rules.
ULTRA Trader’s Tip: Volume Gives the Breakdown Meaning
• Breaks below the 50 DMA signal weakening institutional support.
• Heavy volume confirms the selling pressure is significant.
• Acting on early violations helps prevent manageable losses from becoming larger ones.
CLICK/TAP CHART TO ZOOM
Chart services courtesy of stockcharts.com. Annotations by James Taulman.
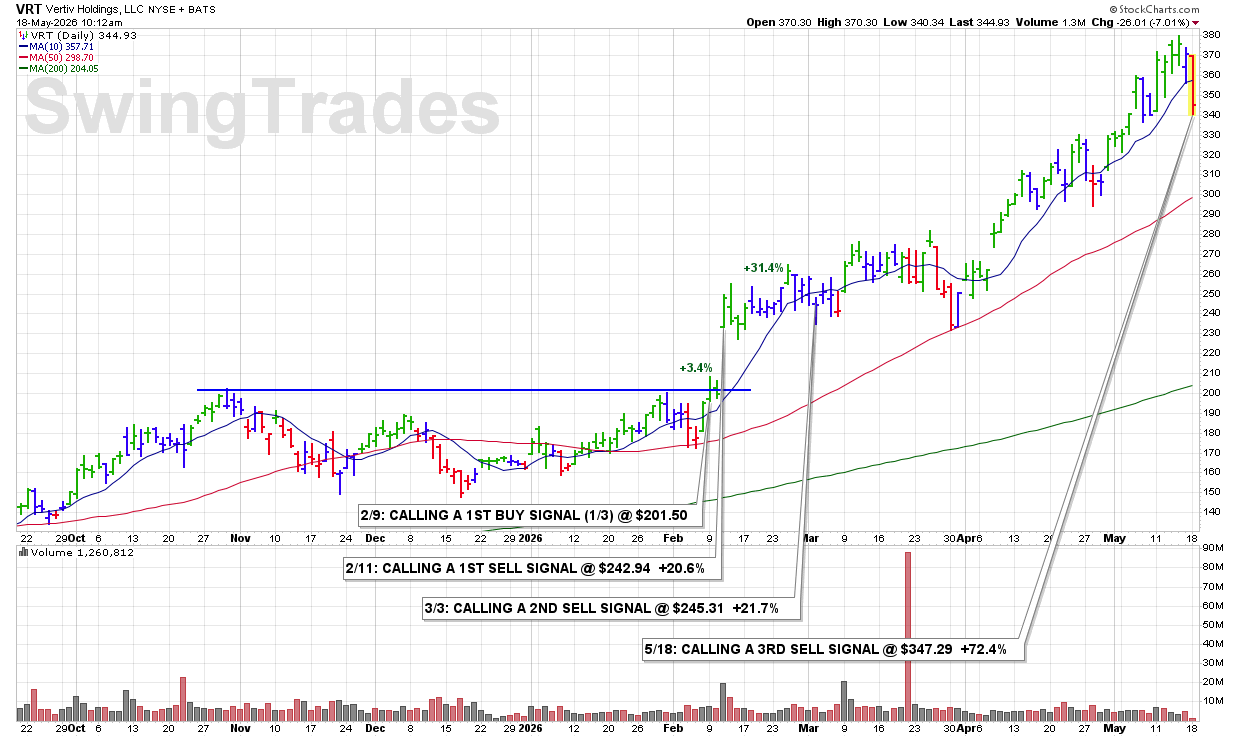
9:59 AM – Shares are breaking down below the 10 DMA and also beneath ROUND-$350 support while volume is currently running +20% above normal. That combination of price and volume deterioration confirms a clear 3RD and FINAL SELL SIGNAL.
ULTRA Trader’s Tip: Protect Big Gains
• Breaks below the 10 DMA often mark the start of momentum deterioration.
• Losses of key round-number support levels confirm increasing weakness.
• After a strong advance, disciplined exits help lock in meaningful gains.
CLICK/TAP CHART TO ZOOM
Chart services courtesy of stockcharts.com. Annotations by James Taulman.
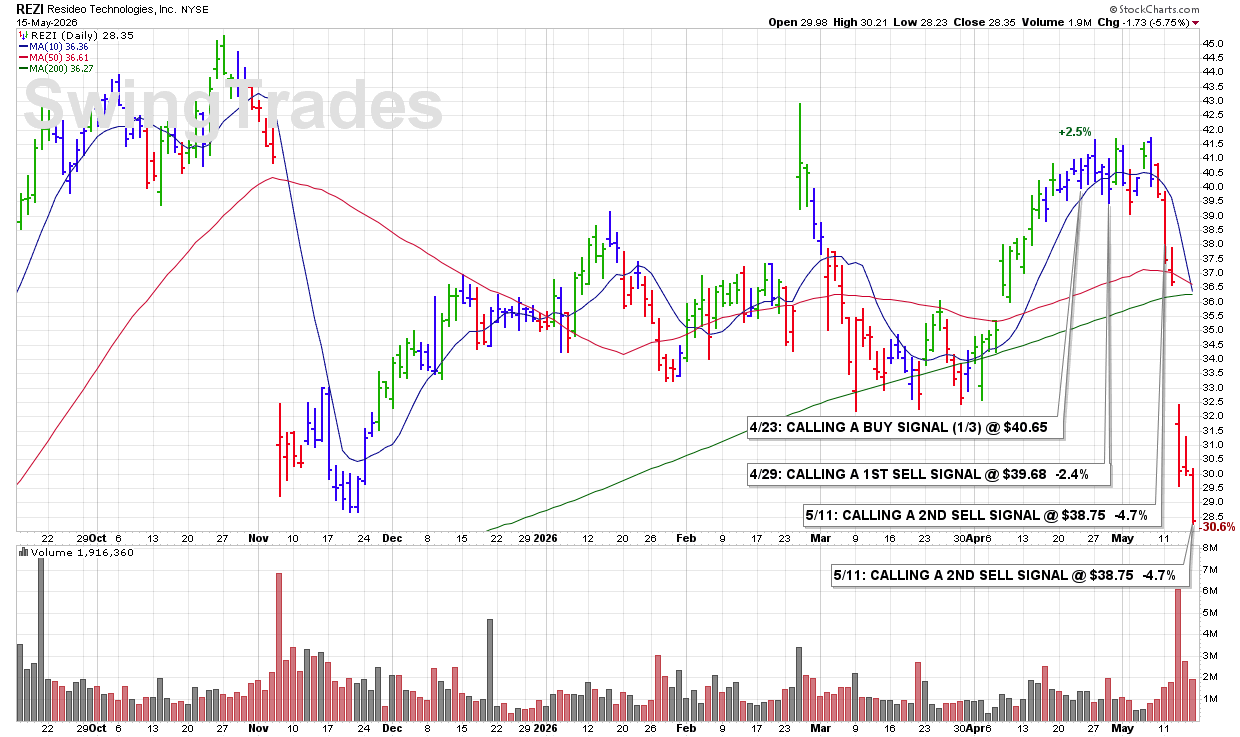
1:03 PM – Showing continued bearish action this afternoon following the earnings sell-off earlier in the week. The stock is now breaking below ROUND-$30 support on above-average volume. That combination confirms continued technical deterioration and triggers a 3RD and FINAL SELL SIGNAL.
ULTRA Trader’s Tip: Earnings Damage Must Repair Quickly
• After an earnings sell-off, strong stocks should recover quickly.
• Continued weakness following earnings signals institutions are still selling.
• Breaks of key support on volume confirm it’s time to exit and protect capital.
CLICK/TAP CHART TO ZOOM
Chart services courtesy of stockcharts.com. Annotations by James Taulman.
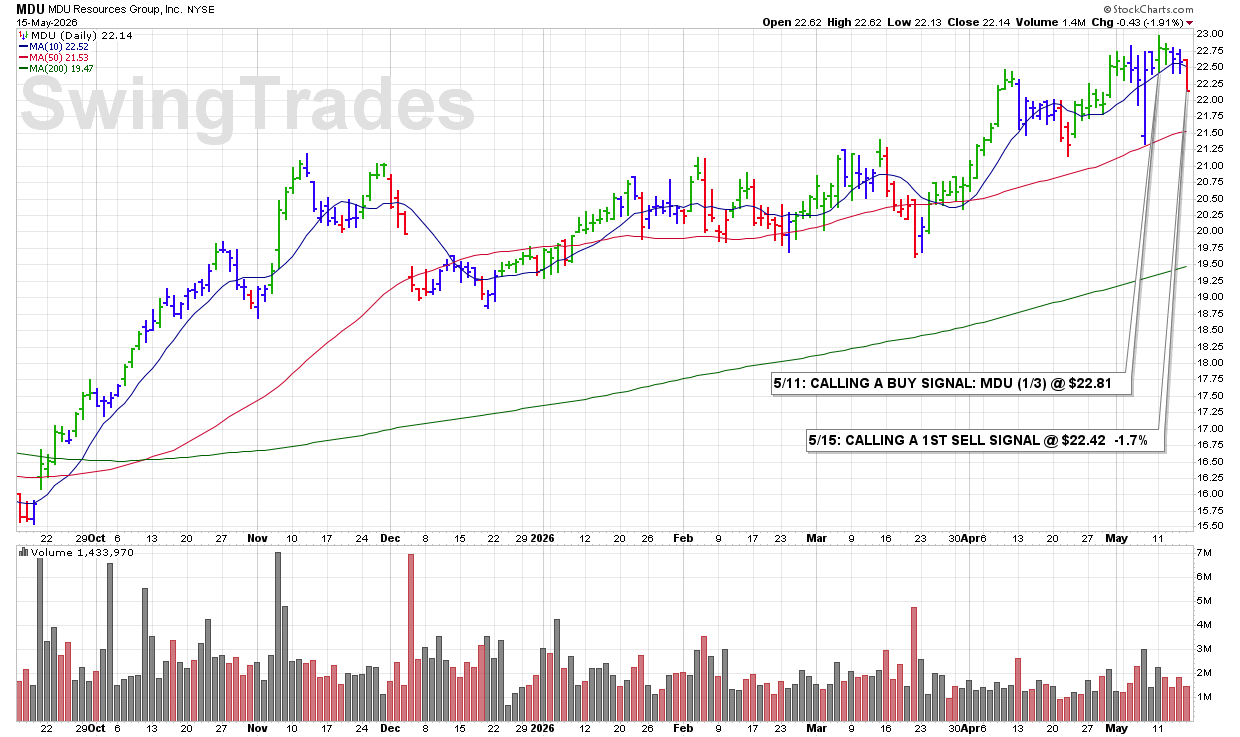
10:03 AM – Calling a 1ST SELL SIGNAL here as price has fallen below the 10 DMA. This type of bearish action and technical violation is an initial SELL SIGNAL under our guidelines.
ULTRA Trader’s Tip: Initial Violations Should Be Respected
• The first break below the 10 DMA often signals momentum is changing.
• Small technical violations can develop into larger breakdowns.
• Acting early helps control risk before weakness possibly accelerates.
CLICK/TAP CHART TO ZOOM
Chart services courtesy of stockcharts.com. Annotations by James Taulman.
9:52 AM – Shares sliced below the 10 DMA first thing this morning. Initial breaks of the 10 DMA are SELL SIGNALS under our guidelines. The stock did find support at ROUND-$60, with additional support below there at the 50 DMA, currently at $58.40.
ULTRA Trader’s Tip: First Breaks Set the Tone
• Initial breaks of the 10 DMA often signal momentum is weakening.
• Round-number levels like $60 can provide temporary support.
• The 50 DMA becomes the next major support area if weakness continues.

CLICK/TAP CHART TO ZOOM
Chart services courtesy of stockcharts.com. Annotations by James Taulman.
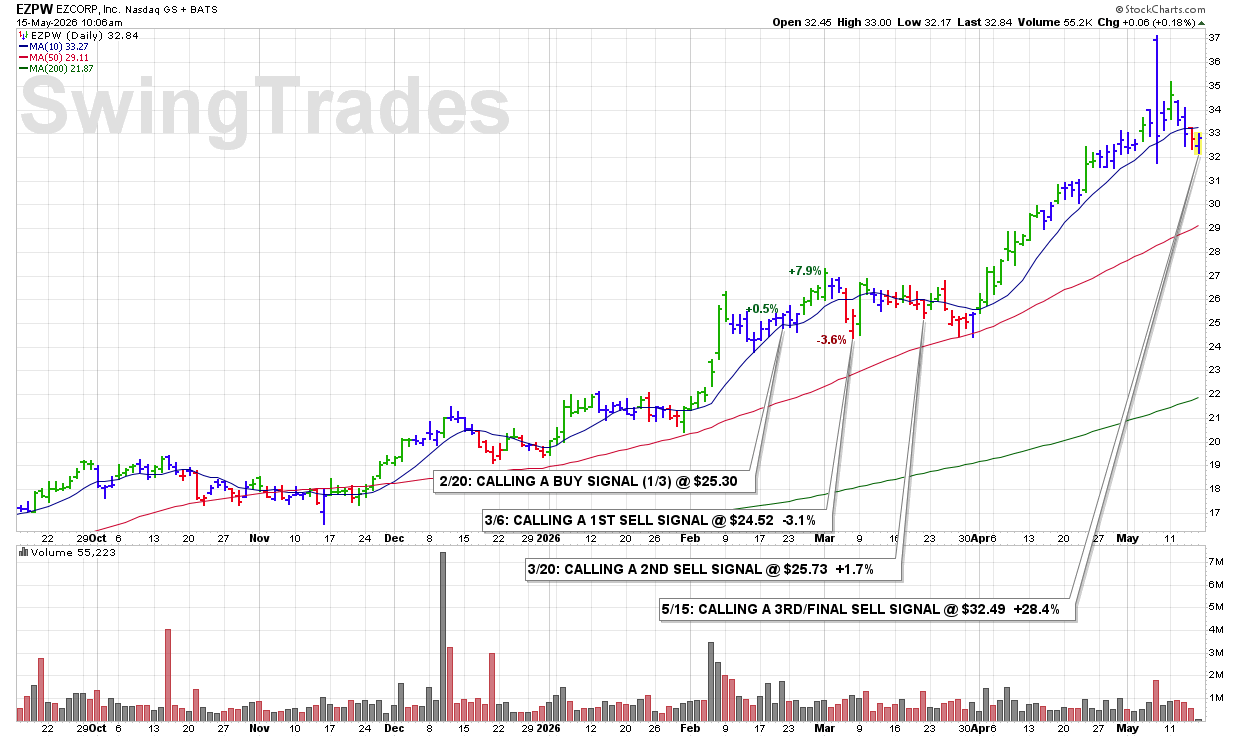
9:45 AM – The stock has clearly lost its 10 DMA this morning after closely towing that line higher since the April 1st breakout. That break signals a loss of momentum and triggers a 3RD and FINAL SELL SIGNAL.
ULTRA Trader’s Tip: The 10 DMA Guides the Trend
• Strong stocks often ride the 10 DMA higher during sustained advances.
• Once that support is decisively lost, momentum is shifting.
• Final exits help protect gains after an extended run.
CLICK/TAP CHART TO ZOOM
Chart services courtesy of stockcharts.com. Annotations by James Taulman.
9:43 AM – Calling a 2ND and FINAL SELL SIGNAL here on DOV as shares have clearly lost their 50 DMA after closing just slightly below that level over the past two sessions. Today’s continued weakness confirms the violation and signals further technical deterioration.
ULTRA Trader’s Tip: Confirmed Breaks Carry More Weight
• Multiple closes below the 50 DMA confirm weakening institutional support.
• What begins as a slight violation can quickly turn into a larger breakdown.
• Final exits protect capital when intermediate-term support fails.

CLICK/TAP CHART TO ZOOM
Chart services courtesy of stockcharts.com. Annotations by James Taulman.
3:50 PM – Shares are advancing today to new all-time highs from the 10 DMA while volume is running slightly above the normal rate. That combination reflects continued momentum and qualifies as a technical BUY SIGNAL.
ULTRA Trader’s Tip: Leaders Tend to Lead Further
• Stocks making new all-time highs are showing exceptional relative strength.
• Advances from the 10 DMA confirm momentum remains intact.
• Stocks reaching new highs have less will sellers as every holder is profitable.

CLICK/TAP CHART TO ZOOM
Chart services courtesy of stockcharts.com. Annotations by James Taulman.
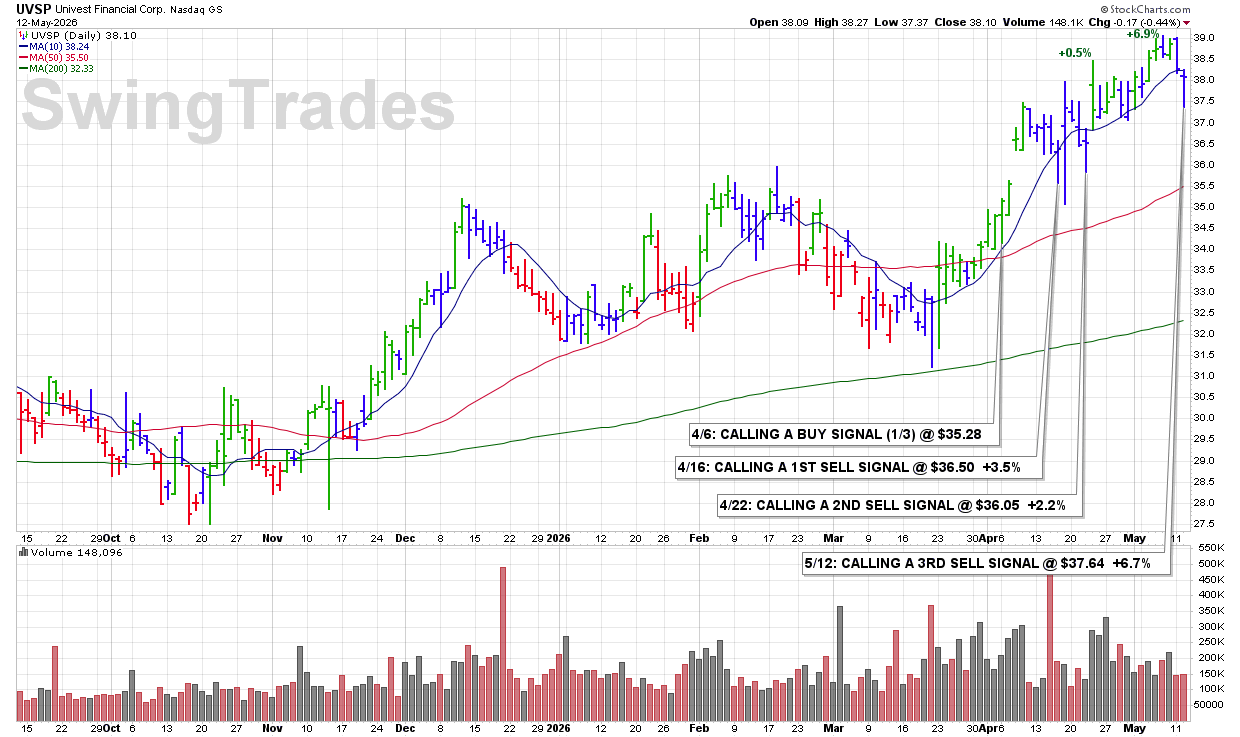
5/12 TUE: UVSP – CALLING A 3RD SELL SIGNAL @ $37.64 +6.7%
11:21 AM – Calling a 3RD and FINAL SELL SIGNAL here on UVSP as shares are clearly breaking below the 10 DMA. That violation confirms weakening momentum and warrants a full exit under our rules.
ULTRA Trader’s Tip: Final Signals Require Discipline
• The 10 DMA is the heartbeat of short-term momentum.
• Once that support fails repeatedly, the trend is weakening.
• Final exits help lock in gains and protect capital from deeper pullbacks.
CLICK/TAP CHART TO ZOOM
Chart services courtesy of stockcharts.com. Annotations by James Taulman.
10:12 AM – Calling a 2ND SELL SIGNAL here as shares are breaking below recent lows just under $40 while trading on above-average volume. That combination signals increasing downside pressure and continued technical weakness.
ULTRA Trader’s Tip: New Lows on Volume Matter
• Breaks below recent lows confirm sellers are gaining control.
• Above-average volume adds conviction to the downside move.
• Scaling out early helps protect capital in weakening trends.

CLICK/TAP CHART TO ZOOM
Chart services courtesy of stockcharts.com. Annotations by James Taulman.
2:44 PM – The stock is triggering a 2ND SELL SIGNAL here as it is:
(1) selling off,
(2) on an increase in volume,
(3) breaking down from a 7-month uptrend,
(4) trading below recent lows, and
(5) appears likely to close near the session lows.
These are all clear signs of technical weakness and important technical violations — especially when stacked together — which fully warrant this SELL SIGNAL call.
ULTRA Trader’s Tip: Stacked Violations Increase Risk
• One technical violation can be manageable — multiple violations are different.
• Breaks of trendlines, support, and recent lows together confirm deterioration.
• When weakness compounds, reducing exposure quickly is the disciplined move.

CLICK/TAP CHART TO ZOOM
Chart services courtesy of stockcharts.com. Annotations by James Taulman.
3:42 PM – Shares look to be closing below the 50 DMA, and that is a clear technical violation under our rules. Calling a 1ST SELL SIGNAL here before the close.
ULTRA Trader’s Tip: Respect the Close
• A close below the 50 DMA carries more weight than an intraday move.
• This level represents key institutional support.
• Acting early helps reduce risk before downside pressure builds further.

CLICK/TAP CHART TO ZOOM
Chart services courtesy of stockcharts.com. Annotations by James Taulman.
3:32 PM – Shares are clearly breaking below the 10 DMA line. That is essentially a default SELL SIGNAL under our rules, and with prior signals already triggered, this marks a 3RD and FINAL SELL SIGNAL.
ULTRA Trader’s Tip: Follow the System to the End
• A break below the 10 DMA is a clear momentum violation.
• Multiple sell signals confirm the trend has shifted.
• Final exits ensure discipline and prevent further downside exposure.

CLICK/TAP CHART TO ZOOM
Chart services courtesy of stockcharts.com. Annotations by James Taulman.
10:12 AM – Shares are trading higher from the 10 DMA and pushing to new highs this morning. That combination represents one of our highest-probability BUY SIGNALS, confirming continued institutional demand.
It must be noted that today’s volume-backed action could be tied to the upcoming earnings announcement, and buying ahead of earnings carries added risk.
ULTRA Trader’s Tip: Adding With Awareness
• Moves from the 10 DMA into new highs signal strong momentum.
• Adding in thirds keeps position sizing controlled.
• Earnings events can introduce volatility — stay disciplined with risk.

CLICK/TAP CHART TO ZOOM
Chart services courtesy of stockcharts.com. Annotations by James Taulman.
3:38 PM – Shares are breaking below the 10 DMA line, triggering a 1ST SELL SIGNAL under our rules. There is near-term support at ROUND-$220, and below that at the 50 DMA (currently $216.39). Breaks of those levels would represent further technical violations.
Price does remain in an uptrend since the start of April, but this is the first sign of short-term momentum may be fading.
ULTRA Trader’s Tip: First Cracks in an Uptrend
• A break below the 10 DMA is often the earliest warning sign.
• Nearby support levels (like ROUND-$220 and the 50 DMA) become critical.
• Acting early allows flexibility if weakness continues to develop.

CLICK/TAP CHART TO ZOOM
Chart services courtesy of stockcharts.com. Annotations by James Taulman.
3:32 PM – Calling a 3RD and FINAL SELL SIGNAL here as shares are breaking below ROUND-$55 support. That violation confirms continued technical weakness and signals sellers remain in control.
ULTRA Trader’s Tip: Final Breaks Demand Action
• Round-number levels like $55 often act as key support.
• When that level breaks, downside pressure can accelerate.
• Final exits protect capital when the trend clearly turns against you.

CLICK/TAP CHART TO ZOOM
Chart services courtesy of stockcharts.com. Annotations by James Taulman.
10:22 AM – The stock is advancing toward new highs from the 10 DMA, with volume increasing. That type of price and volume action is always a BUY SIGNAL for high-ranked stocks, indicating strong institutional demand.
ULTRA Trader’s Tip: Buy Strength Near Highs
• Advances from the 10 DMA often lead to continuation moves.
• Rising volume confirms real demand behind the move.
• High-ranked stocks making new highs tend to outperform.

CLICK/TAP CHART TO ZOOM
Chart services courtesy of stockcharts.com. Annotations by James Taulman.
10:16 AM – Shares are advancing from the 10 DMA with an increase in volume. That combination signals continued demand and qualifies as a BUY/ADD signal under our rules.
NOTE: The company is scheduled to report earnings and is very likely to become volatile.
ULTRA Trader’s Tip: Manage Adds Around Earnings
• Moves from the 10 DMA with volume confirm strength.
• Adding in thirds helps control risk ahead of uncertain events like earnings.
• Be prepared for volatility — position sizing matters most during earnings windows.

CLICK/TAP CHART TO ZOOM
Chart services courtesy of stockcharts.com. Annotations by James Taulman.
3:32 PM – Calling a 1ST SELL SIGNAL here as the stock is clearly breaking below its 50 DMA. That violation signals a shift in the intermediate trend and increasing downside risk.
ULTRA Trader’s Tip: The 50 DMA Is a Warning Line
• Breaks below the 50 DMA often signal institutional selling.
• Once that level is lost, downside pressure can accelerate.
• Acting early helps reduce exposure before losses deepen.

CLICK/TAP CHART TO ZOOM
Chart services courtesy of stockcharts.com. Annotations by James Taulman.
3:32 PM – The stock is breaking below the 10 DMA line. That is a technical violation and a standard SELL SIGNAL under our rules, usually indicating weakening short-term momentum.
ULTRA Trader’s Tip: Respect the First Break
• The 10 DMA is the earliest signal of momentum change.
• Once that level is lost, downside risk increases.
• Acting quickly helps protect capital before weakness builds.

CLICK/TAP CHART TO ZOOM
Chart services courtesy of stockcharts.com. Annotations by James Taulman.
3:29 PM – Calling a 1ST SELL SIGNAL here as the stock is breaking below its 10 DMA support. That violation signals weakening short-term momentum and warrants reducing exposure.
ULTRA Trader’s Tip: First Signs Matter
• The 10 DMA is the earliest signal of momentum change.
• Breaks below this level often lead to further weakness.
• Acting on the first signal helps protect gains before they erode.

CLICK/TAP CHART TO ZOOM
Chart services courtesy of stockcharts.com. Annotations by James Taulman.
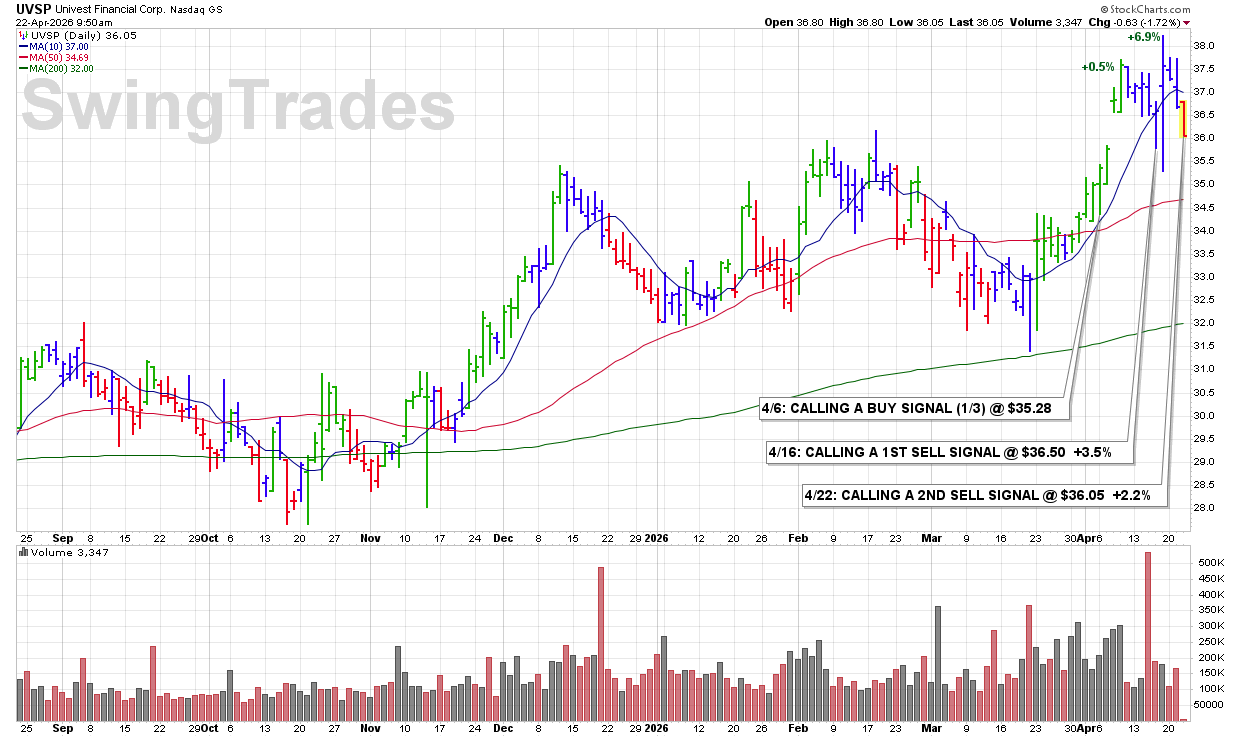
9:38 AM – The stock has clearly lost its 10 DMA support, and that is a SELL SIGNAL under our rules. Continued weakness below this level signals fading momentum and warrants further reduction in exposure.
ULTRA Trader’s Tip: Don’t Ignore the 10 DMA Break
• The 10 DMA is the first line of defense for short-term momentum.
• Once that level is lost, downside risk increases.
• Scaling out early helps protect gains as momentum fades.
CLICK/TAP CHART TO ZOOM
Chart services courtesy of stockcharts.com. Annotations by James Taulman.
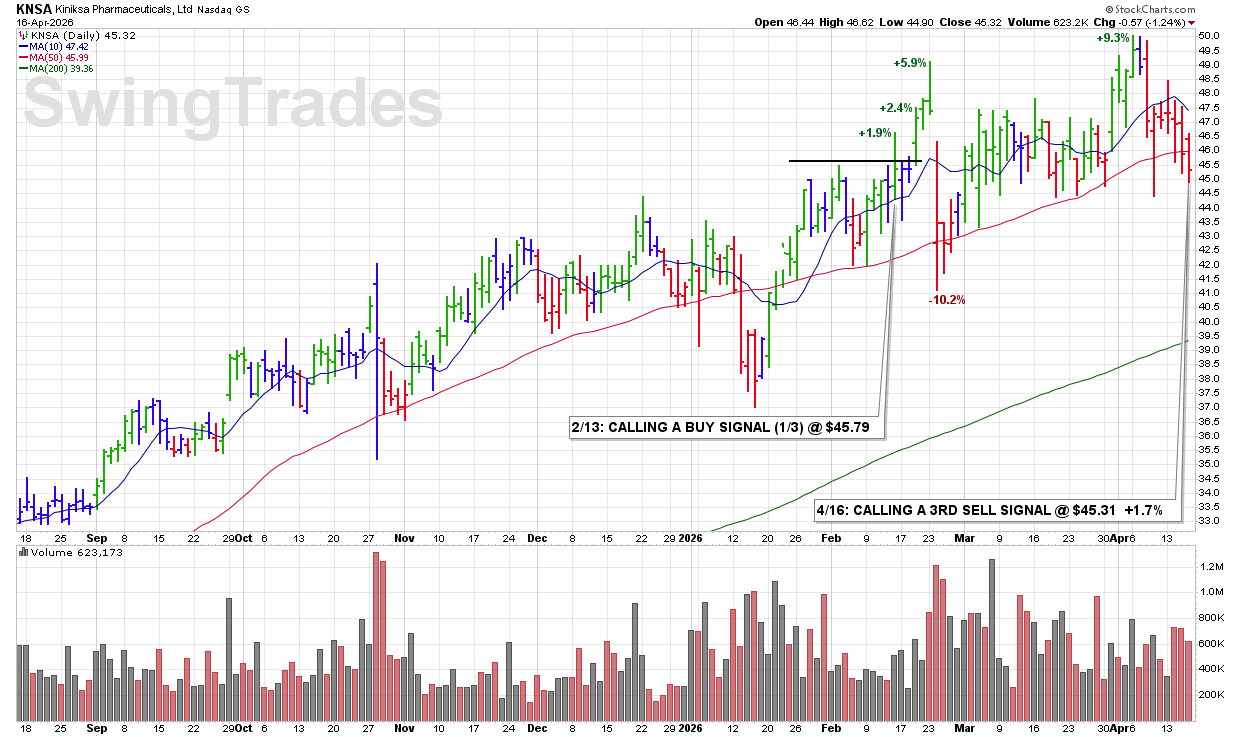
3:58 PM – After recently being clearly turned back from its 10 DMA last week, shares have now lost 50 DMA support later this week. That sequence confirms a shift in trend and continued technical deterioration. Calling a FINAL SELL SIGNAL here.
SELL SIGNALS:
12/26 $41.92 -5.9%
1/15 $37.20 -16.5%
4/16 $45.31 +1.7%
ULTRA Trader’s Tip: When Support Fails in Sequence
• A turnback from the 10 DMA is often the first sign of weakening momentum.
• A break below the 50 DMA confirms deeper technical damage.
• When both occur, it’s a high-probability signal to exit and protect capital.
CLICK/TAP CHART TO ZOOM
Chart services courtesy of stockcharts.com. Annotations by James Taulman.
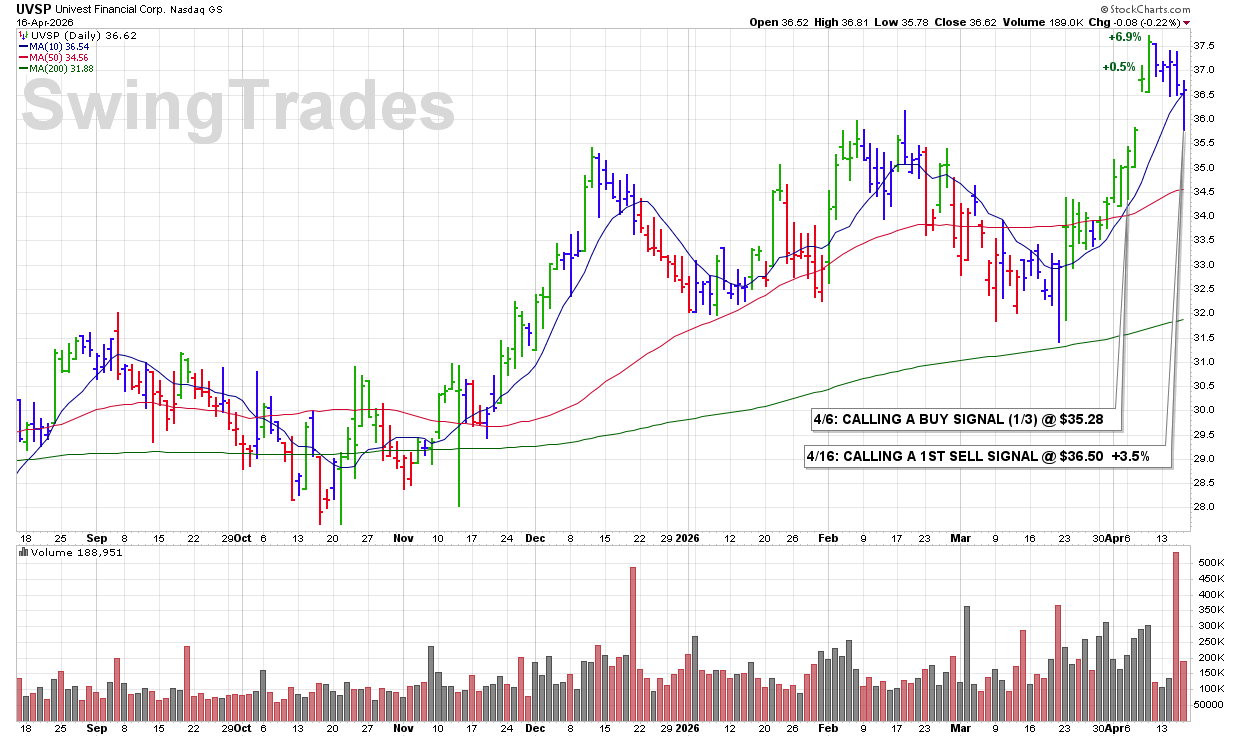
3:58 PM – The stock is beginning to develop a downtrend and is struggling with its key 10 DMA support for a second day in a row, signal weakening momentum. Calling a 1ST SELL SIGNAL here.
ULTRA Trader’s Tip: Early Weakness Matters
• When a stock struggles to hold the 10 DMA, momentum is fading.
• Repeated tests of support often lead to a breakdown.
• Acting early allows you to reduce risk before weakness accelerates.
CLICK/TAP CHART TO ZOOM
Chart services courtesy of stockcharts.com. Annotations by James Taulman.
3:58 PM – Shares are now clearly breaking below the 50 DMA. That is a technical violation and a clear SELL SIGNAL under our rules.
ULTRA Trader’s Tip: Respect the 50 DMA Break
• The 50 DMA is a key level for intermediate-term trend support.
• A decisive break below this line signals increasing downside risk.
• Scaling out early helps manage risk before weakness accelerates.

CLICK/TAP CHART TO ZOOM
Chart services courtesy of stockcharts.com. Annotations by James Taulman.
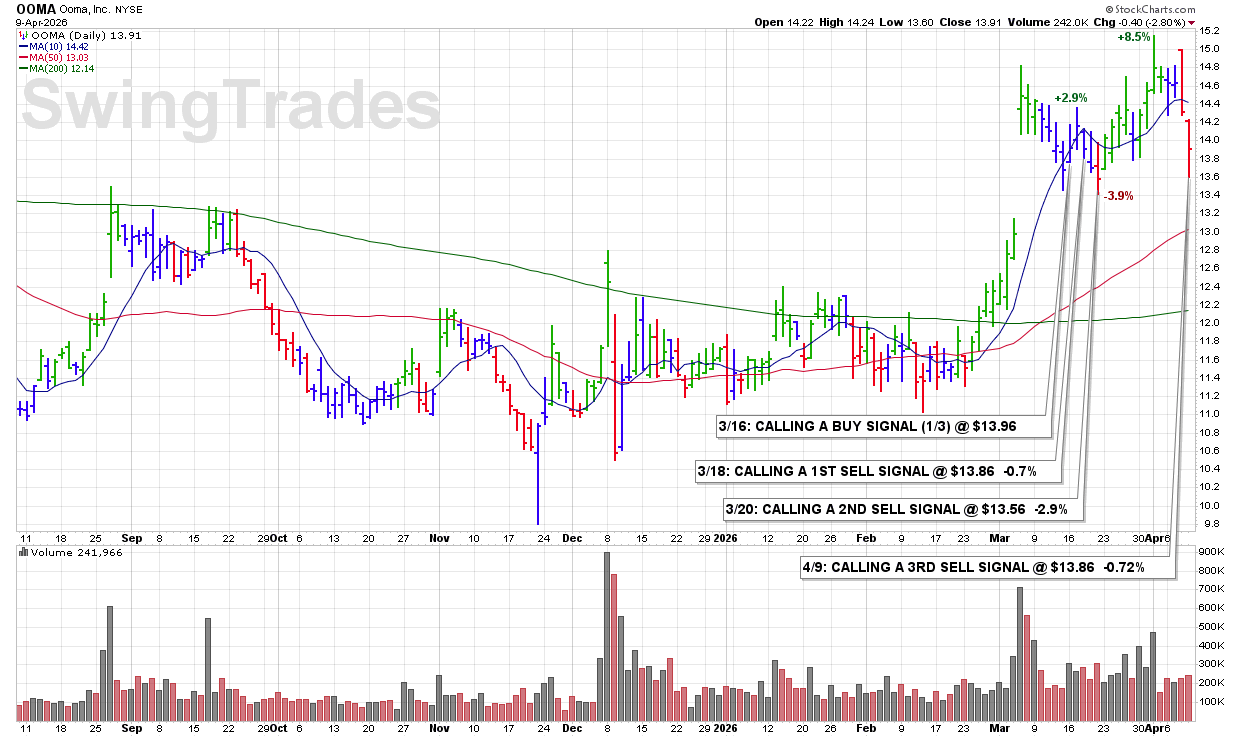
12:40 PM – After closing just slightly below its 10 DMA yesterday, shares continue to slide today and are now breaking below ROUND-$14 support. That combination confirms ongoing weakness and triggers a clear FINAL SELL SIGNAL.
ULTRA Trader’s Tip: Follow Through Confirms the Signal
• A close below the 10 DMA followed by continued downside confirms momentum loss.
• Breaks of round-number support levels add to selling pressure.
• Final exits protect capital when weakness continues without recovery.
CLICK/TAP CHART TO ZOOM
Chart services courtesy of stockcharts.com. Annotations by James Taulman.
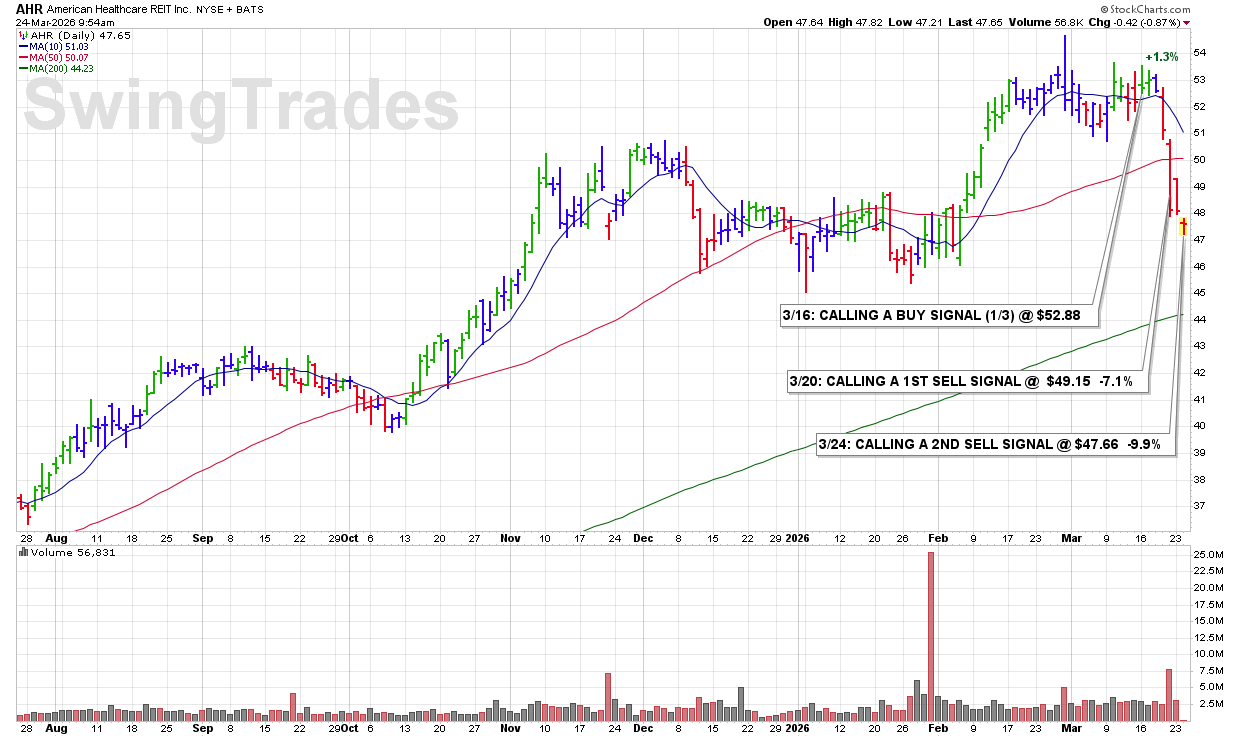
9:51 AM – Shares are making new lows this morning and are not recovering from the recent sharp one-day sell-off that broke the 50 DMA. That lack of rebound signals continued weakness and confirms downside pressure. Calling a 2ND SELL SIGNAL here.
ULTRA Trader’s Tip: Lack of Recovery Is a Warning
• After a sharp sell-off, strong stocks should rebound quickly.
• Failure to recover signals continued institutional selling.
• New lows confirm weakness — scaling out helps control risk.
CLICK/TAP CHART TO ZOOM
Chart services courtesy of stockcharts.com. Annotations by James Taulman.
4:29 PM – Calling a quick 2ND SELL SIGNAL here as shares have again been turned back from the 10 DMA, with that line is now clearly rolling over. In addition, overall market conditions continue to deteriorate, adding further pressure.
ULTRA Trader’s Tip: Follow Through Matters
• Failed rallies into the 10 DMA confirm it has become resistance.
• A rolling over 10 DMA signals weakening short-term momentum.
• In weak markets, quick follow-through to the downside warrants decisive action.

CLICK/TAP CHART TO ZOOM
Chart services courtesy of stockcharts.com. Annotations by James Taulman.
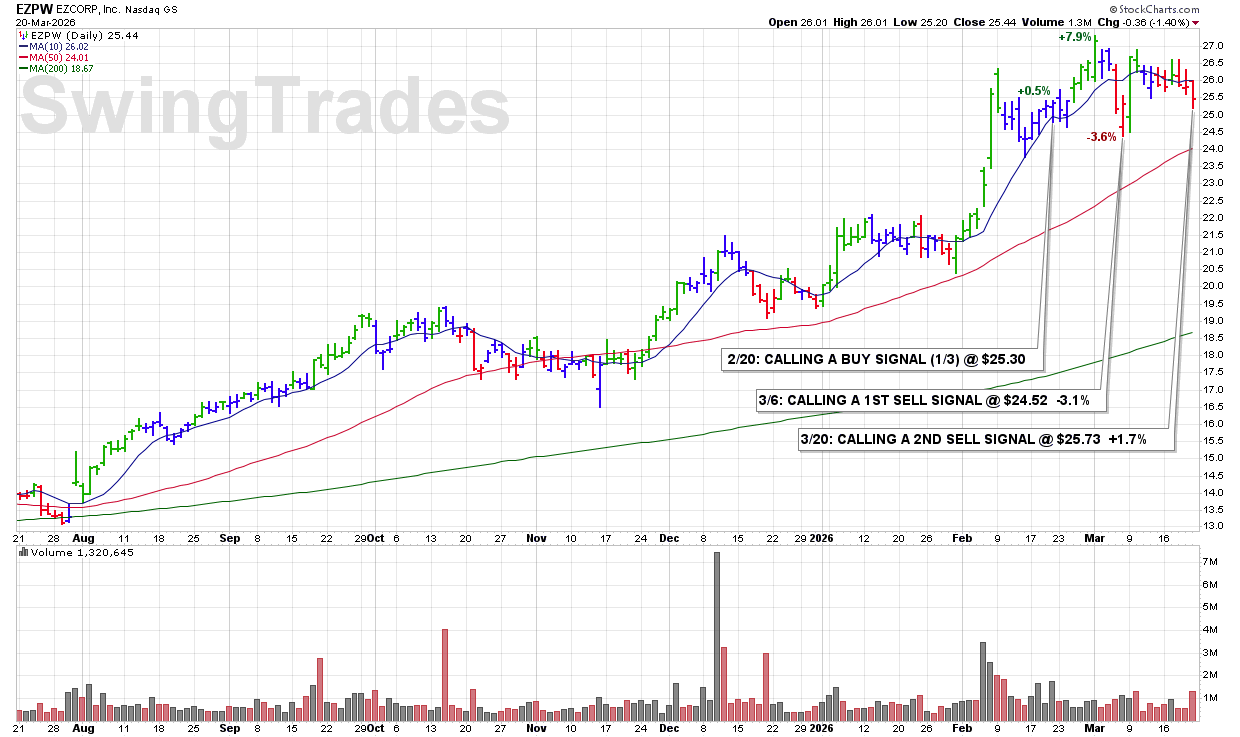
1:43 PM – Calling a 2ND SELL SIGNAL here as shares continue to move further below the 10 DMA, confirming ongoing weakness. A break of ROUND-$25 would trigger the FINAL SELL SIGNAL.
ULTRA Trader’s Tip: Define Your Exit Levels
• Continued trading below the 10 DMA signals sustained pressure.
• Identifying key levels like ROUND-$25 prepares you for decisive action.
• Planning exits in advance removes emotion when conditions deteriorate.
CLICK/TAP CHART TO ZOOM
Chart services courtesy of stockcharts.com. Annotations by James Taulman.
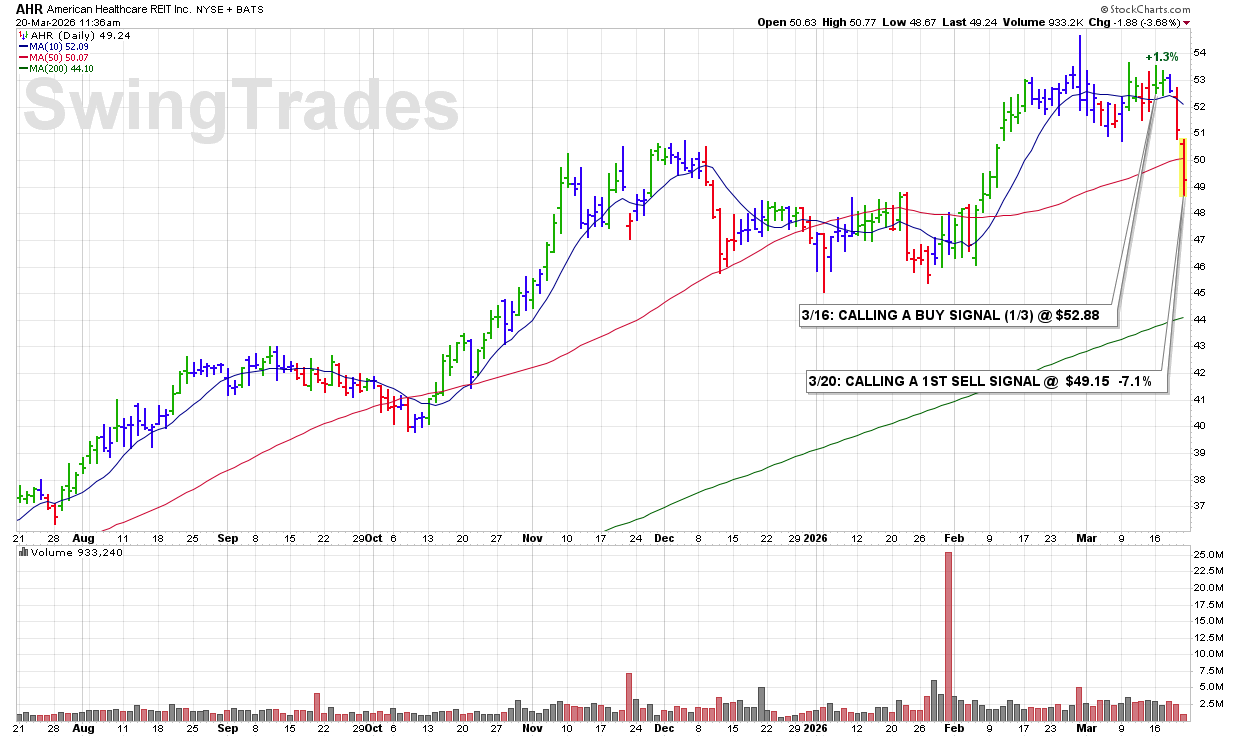
10:59 AM – Calling a 1ST SELL SIGNAL this morning as shares are slicing through the 50 DMA and breaking ROUND-$50 support. That combination signals clear technical deterioration and increasing downside pressure.
ULTRA Trader’s Tip: When Key Support Breaks
• Breaks of the 50 DMA often signal a shift in the intermediate trend.
• Round-number levels like $50 act as key psychological support.
• When both fail together, it’s a strong indication to reduce exposure quickly.
CLICK/TAP CHART TO ZOOM
Chart services courtesy of stockcharts.com. Annotations by James Taulman.
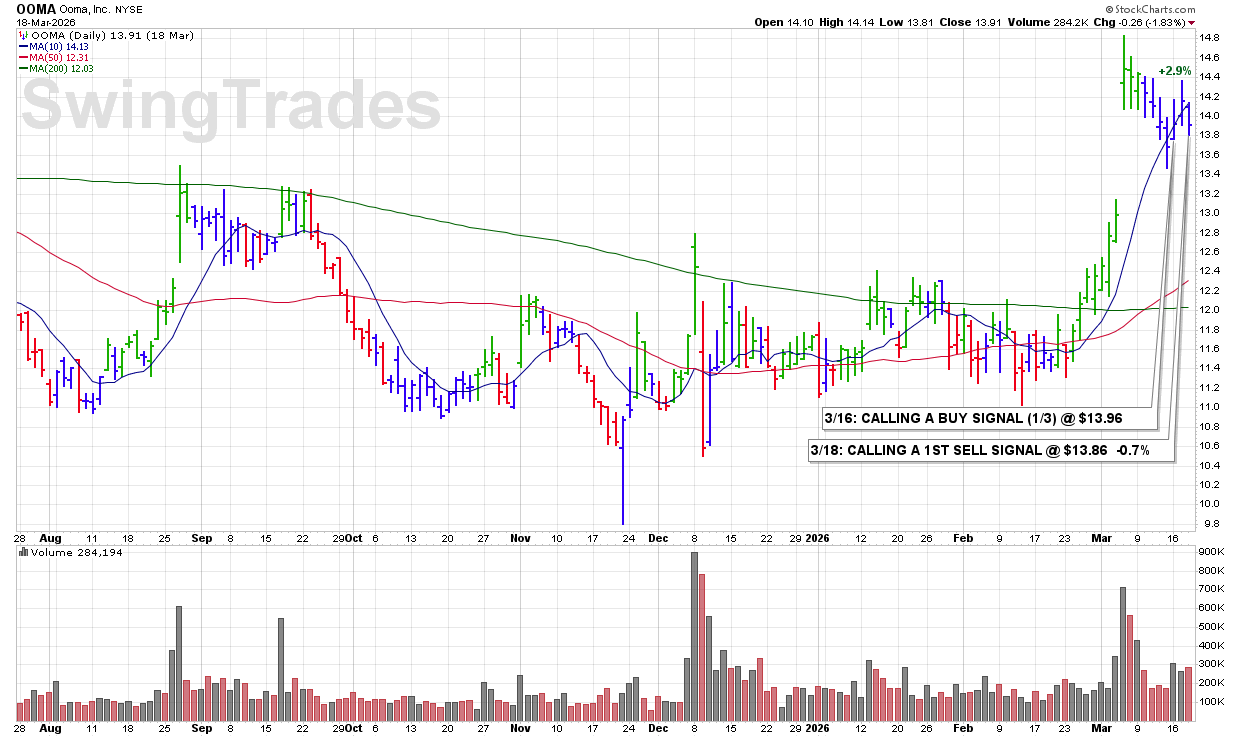
3:47 PM – The stock is now clearly trading below the 10 DMA and has broken ROUND-$14 support on above-average volume. These types of price/volume moves are pivotal and signal a shift in short-term momentum.
Additionally, the broader market environment is weakening, with the major averages breaching their 200 DMA levels — even if only slightly — which adds pressure across the board.
ULTRA Trader’s Tip: Align With the Market Environment
• Breaks below the 10 DMA on volume signal immediate weakness.
• Loss of key support levels like ROUND-$14 confirms sellers are in control.
• When the broader market weakens, individual stocks become more vulnerable — act accordingly.
CLICK/TAP CHART TO ZOOM
Chart services courtesy of stockcharts.com. Annotations by James Taulman.
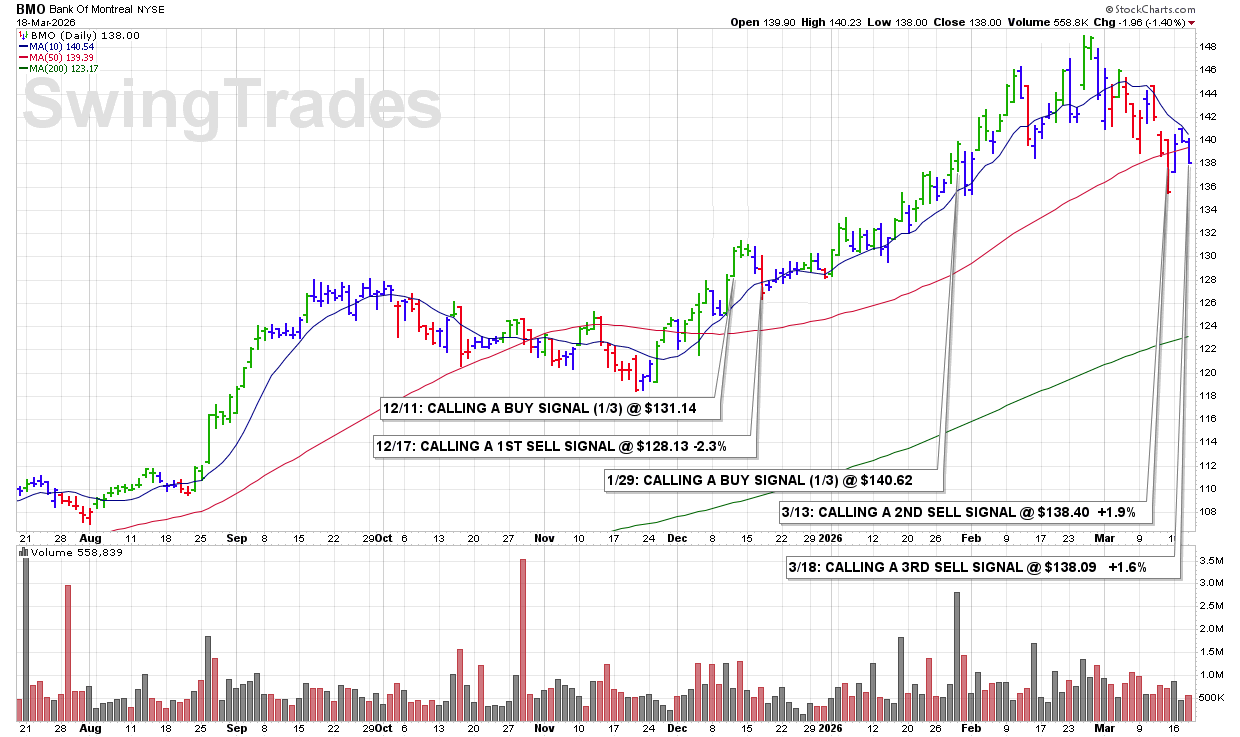
3:18 PM – Shares are getting turned back this afternoon from the stacked 10 DMA and 50 DMA lines. That’s triggering a 3RD and FINAL SELL SIGNAL.
ULTRA Trader’s Tip: Stacked Resistance Matters
• When both the 10 DMA and 50 DMA act as resistance, momentum has clearly shifted.
• Turn-backs from these key moving averages often lead to continued downside.
• Final exits protect gains or limits loses when technical conditions deteriorate.
CLICK/TAP CHART TO ZOOM
Chart services courtesy of stockcharts.com. Annotations by James Taulman.
11:16 AM – Shares are clearly breaking below the 50 DMA this morning. That violation signals weakening intermediate-term momentum. I’m calling a 2ND SELL SIGNAL here and lowering our next level of support to $135.00.
ULTRA Trader’s Tip: Respect the 50 DMA
• The 50 DMA is a key institutional support level for many stocks.
• Breaks below that line often signal a shift in the intermediate trend.
• Scaling out helps reduce risk while maintaining flexibility.

CLICK/TAP CHART TO ZOOM
Chart services courtesy of stockcharts.com. Annotations by James Taulman.
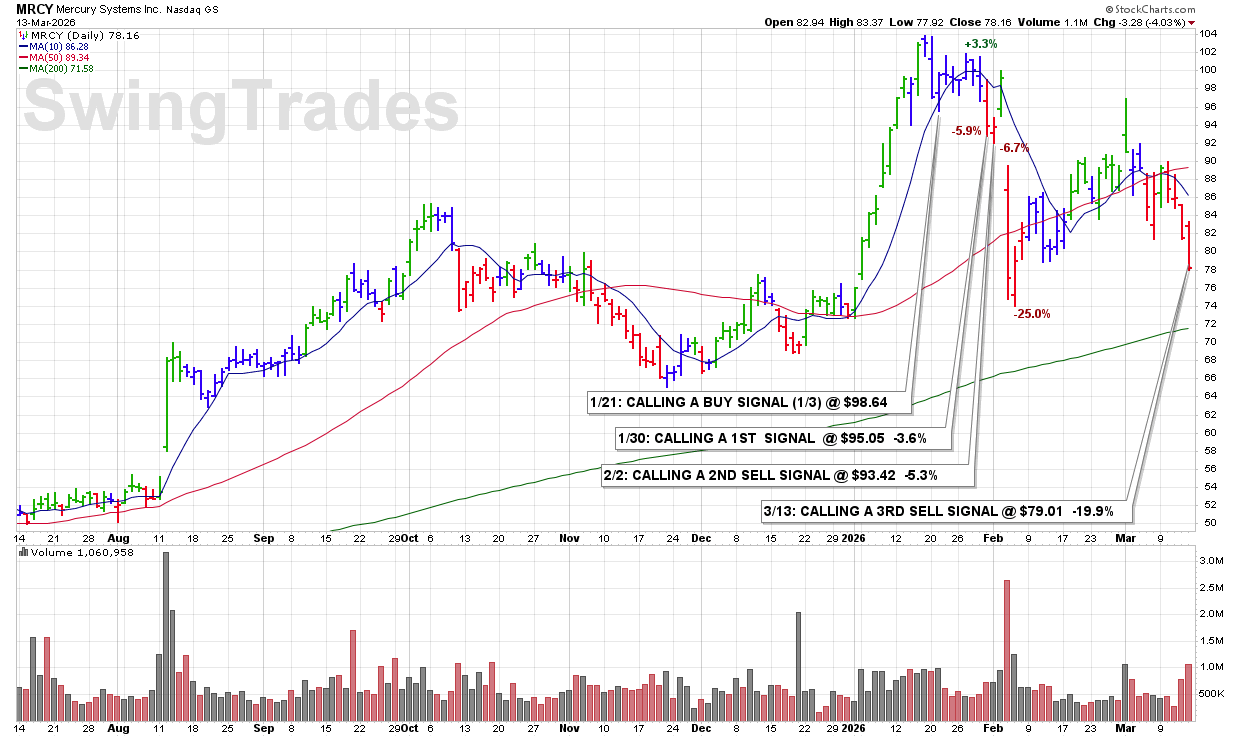
11:14 AM – Calling a 3RD and FINAL SELL SIGNAL here as shares break below our support at ROUND-$80 with an increase in volume. That violation confirms continued technical deterioration and signals sellers remain in control.
ULTRA Trader’s Tip: Cut Losses Decisively
• Breaks of major round-number support often accelerate selling pressure.
• Expanding volume during a decline confirms institutional distribution.
• Cutting losses quickly preserves capital and keeps you ready for stronger opportunities.
CLICK/TAP CHART TO ZOOM
Chart services courtesy of stockcharts.com. Annotations by James Taulman.
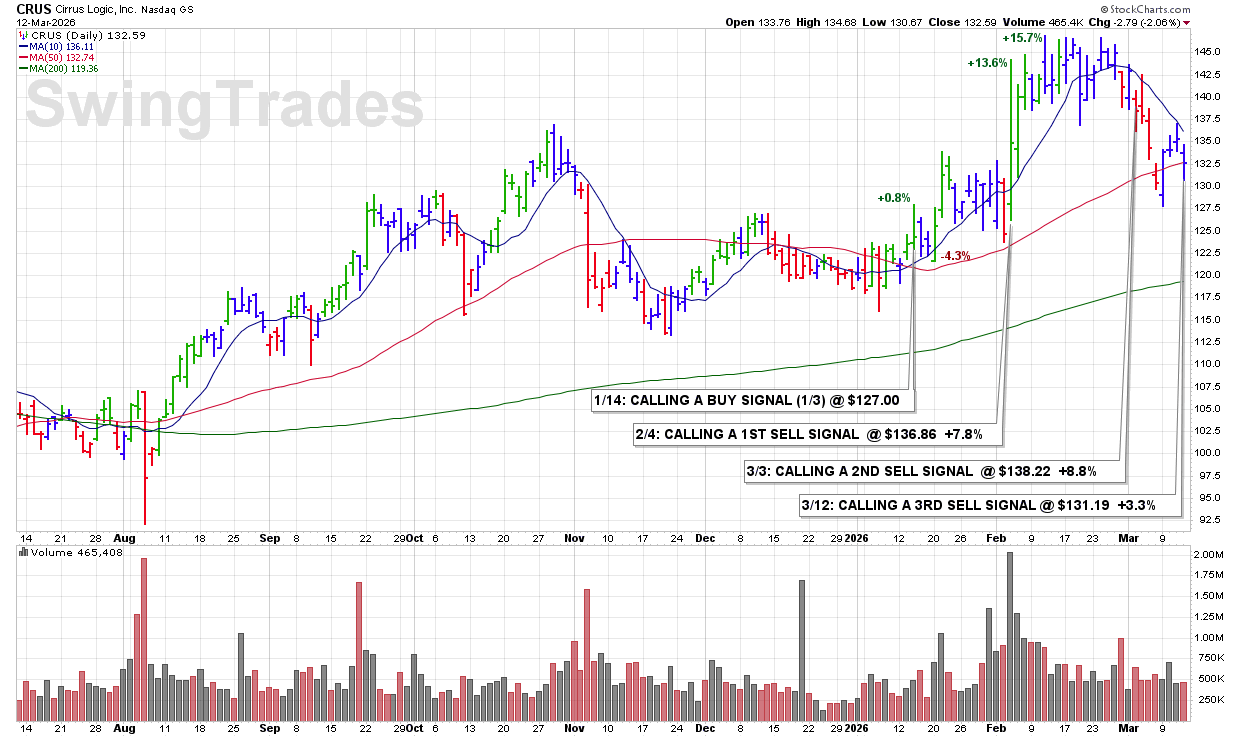
2:26 PM – Shares are getting turned back from the 10 DMA and are now starting to drop below the 50 DMA. A downtrend is well underway, as the 10 DMA has been acting as firm resistance since the beginning of the month. Calling a 3RD and FINAL SELL SIGNAL here.
ULTRA Trader’s Tip: When Resistance Forms at the 10 DMA
• When the 10 DMA shifts from support to resistance, momentum has clearly weakened.
• Breaks below the 50 DMA often confirm a developing downtrend.
• Final exits help protect capital when multiple technical signals align.
CLICK/TAP CHART TO ZOOM
Chart services courtesy of stockcharts.com. Annotations by James Taulman.
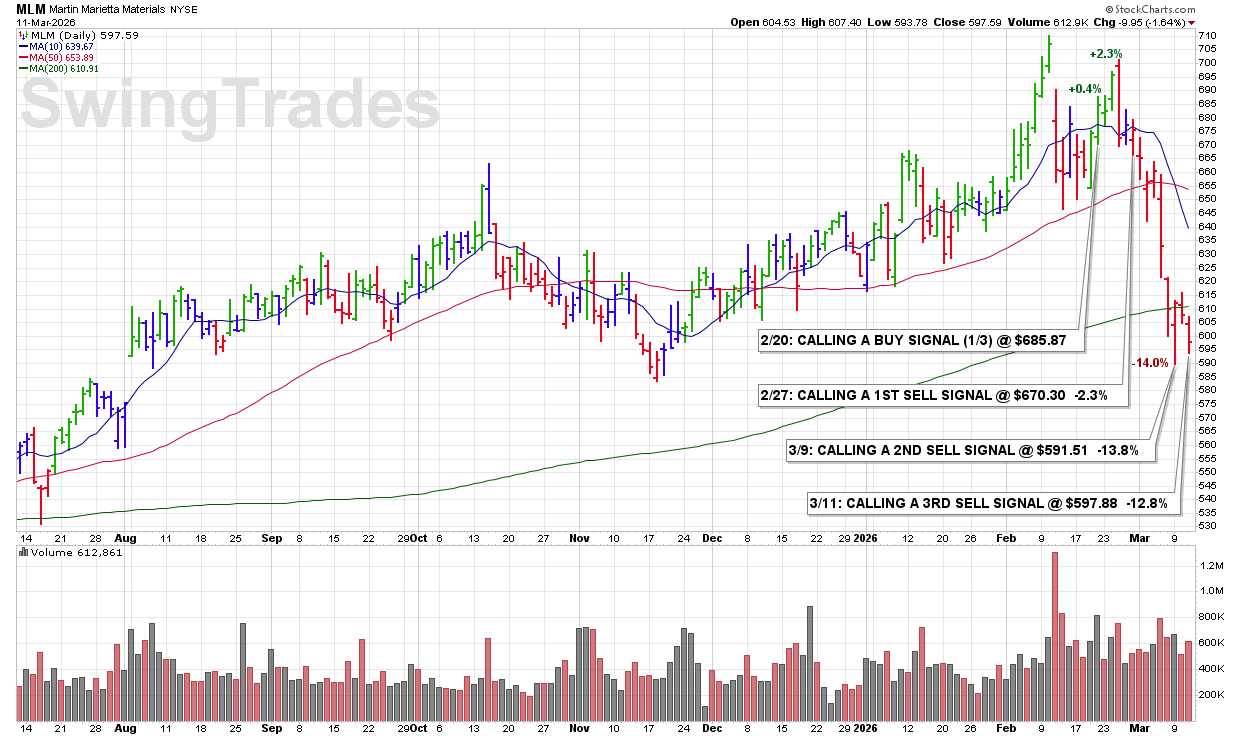
2:50 PM – Shares of Martin Marietta are breaking below our noted 1st support at the ROUND-$600 with an increase in volume. That is a clear technical violation and bearish signal. In addition, the stock is being turned back from its 200 DMA, and recent volume patterns have deteriorated.
Calling a 3RD and FINAL SELL SIGNAL here.
ULTRA Trader’s Tip: When Support Breaks With Volume
• Breaks of major support levels like round numbers often accelerate selling pressure.
• Rejections at longer-term averages such as the 200 DMA signal deeper technical weakness.
• When multiple bearish signals appear together, the prudent move is to exit and protect capital.
CLICK/TAP CHART TO ZOOM
Chart services courtesy of stockcharts.com. Annotations by James Taulman.
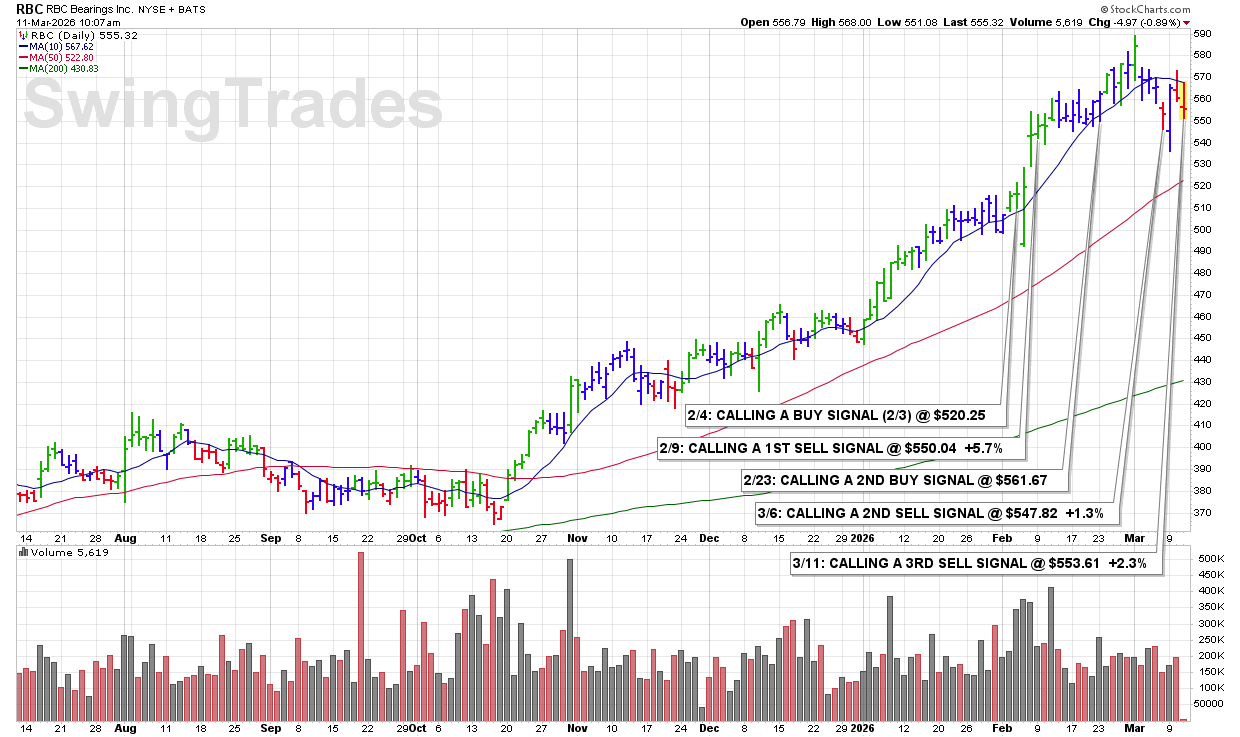
10:00 AM – Calling a 3rd and FINAL SELL SIGNAL here this morning as the stock is being turned back from its 10 DMA and that line is rolling over. When a stock repeatedly fails to reclaim the 10 DMA and the line begins sloping downward, it signals weakening momentum and a developing downtrend.
ULTRA Trader’s Tip: When the 10 DMA Turns Into Resistance
• The 10 DMA often shifts from support to resistance when momentum fades.
• Repeated failures at that line signal institutional distribution.
• Final exits during this transition protect gains before weakness accelerates.
CLICK/TAP CHART TO ZOOM
Chart services courtesy of stockcharts.com. Annotations by James Taulman.
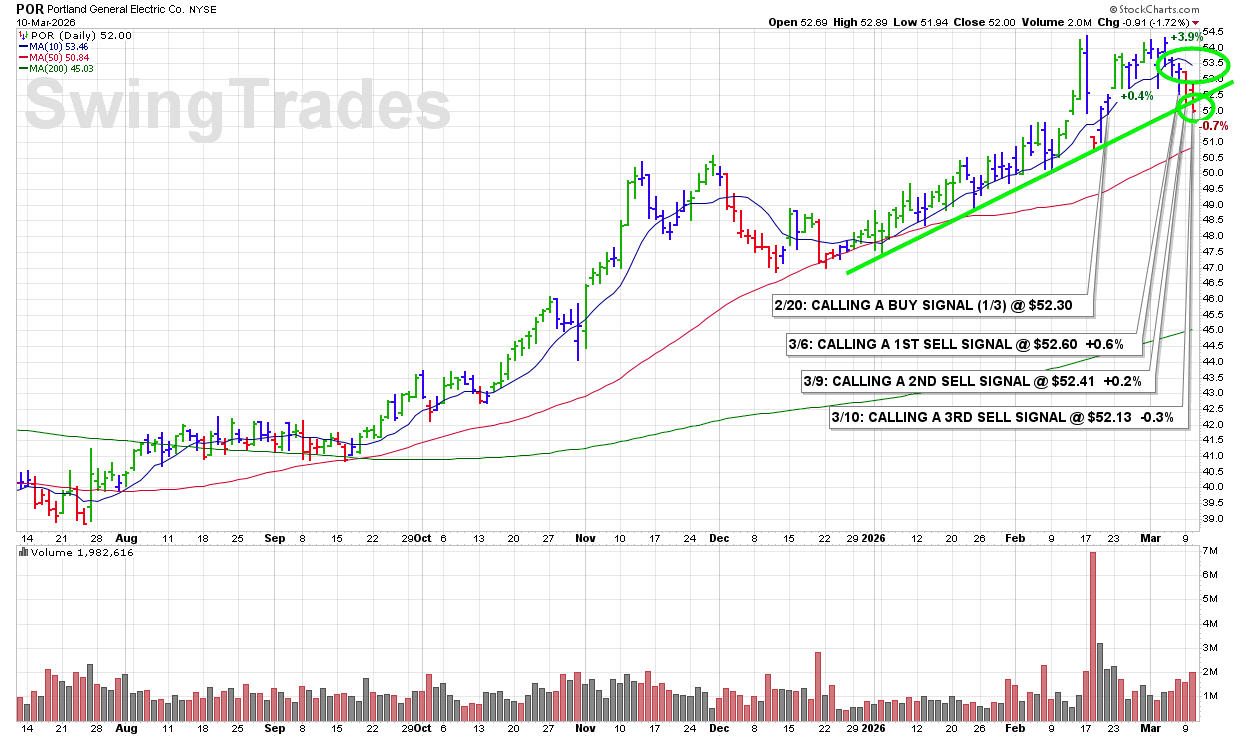
10:15 AM – Calling a FINAL SELL SIGNAL this morning as the stock continues to lag even with the recent bump in the market.
We don’t call SELL SIGNALS arbitrarily. POR has exhibited several distinctive signs of technical weakness which are right out of our playbook.
Starting with:
a drop below the 10 DMA,
a turnback from the 10 DMA,
lower highs forming,
the 10 DMA the started rolling over,
declines on above-average volume,
and now a start of a break below an upward trendline.
That sequence confirms a developing downtrend and justifies the FINAL SELL SIGNAL.
ULTRA Trader’s Tip: Weakness Leaves Clues
• Technical deterioration usually appears as a sequence, not a single event.
• Breaks of the 10 DMA, lower highs, and turn-backs from the 10 DMA are some of our bearish signals.
• When multiple violations appear together, the prudent move is to exit.
EDITOR’S NOTE: Chart has been updated after the close.
CLICK/TAP CHART TO ZOOM
Chart services courtesy of stockcharts.com. Annotations by James Taulman.
10:14 AM – Shares dropped below the 10 DMA on Friday but initially found support at the 50 DMA and reversed higher. This morning the stock is now clearly trading below the 50 DMA, signaling increasing technical weakness. Calling a prudent 1st SELL SIGNAL here.
ULTRA Trader’s Tip: When Support Levels Fail
• Losing the 10 DMA is often the first warning sign of weakening momentum.
• When the 50 DMA fails shortly after, downside pressure can increase quickly.
• Acting early on rule violations keeps losses controlled and protects capital.

CLICK/TAP CHART TO ZOOM
Chart services courtesy of stockcharts.com. Annotations by James Taulman.
10:05 AM – Shares continue to trade below the 10 DMA, and that line is now starting to roll over. When a stock cannot reclaim short-term momentum and the 10 DMA begins sloping downward, it often signals developing technical weakness. Calling a 2ND SELL SIGNAL here.
ULTRA Trader’s Tip: When the 10 DMA Rolls Over
• A stock trading below the 10 DMA is losing short-term leadership.
• When that line begins to slope downward, momentum is shifting from buyers to sellers.
• Scaling out as momentum weakens helps preserve gains while the trend deteriorates.

CLICK/TAP CHART TO ZOOM
Chart services courtesy of stockcharts.com. Annotations by James Taulman.
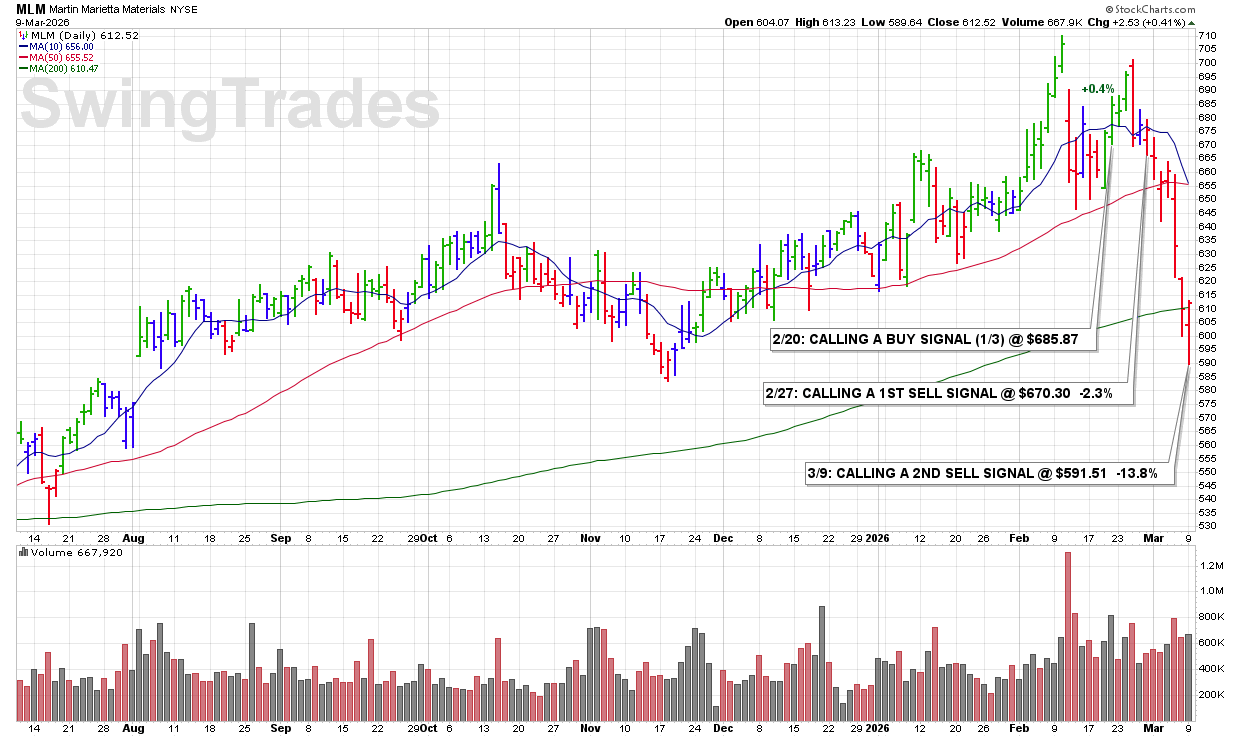
9:57 AM – Shares are dropping below the round-$600 level this morning, marking another technical level violation. When a stock loses a key psychological support level like this, downside pressure often increases. Calling a 2ND SELL SIGNAL here.
ULTRA Trader’s Tip: Round-Number Levels Matter
• Round-number price levels often act as natural support and resistance.
• When those levels fail, it can trigger additional institutional selling.
• Scaling out during these violations helps control risk while the chart weakens.
CLICK/TAP CHART TO ZOOM
Chart services courtesy of stockcharts.com. Annotations by James Taulman.
9:43 AM – Shares have dropped below the 50 DMA, and that is a SELL SIGNAL under our rules. Losing this key intermediate support level confirms the developing downtrend. Calling a FINAL and 3RD SELL SIGNAL here.
ULTRA Trader’s Tip: The 50 DMA Is the Line of Defense
• The 50 DMA often acts as a major institutional support level.
• When price breaks below this line, downside risk increases quickly.
• Exiting the remaining position helps prevent further losses as the trend weakens.

CLICK/TAP CHART TO ZOOM
Chart services courtesy of stockcharts.com. Annotations by James Taulman.
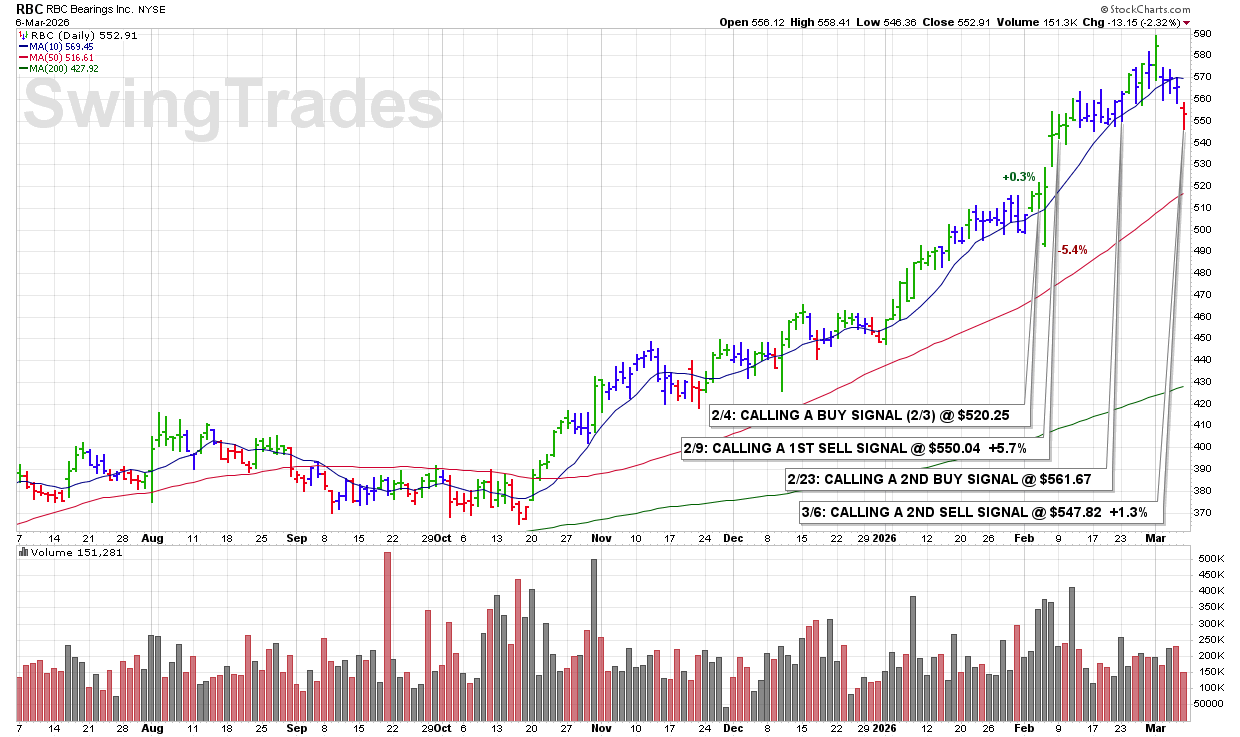
3/6 FRI: RBC – CALLING A 2ND SELL SIGNAL @ $547.82 +1.3%
3:16 PM – Shares gapped down today to new recent lows, signaling increasing selling pressure. The stock is beginning to develop a clear downtrend as momentum fades. Calling a 2ND SELL SIGNAL here to continue scaling back exposure.
ULTRA Trader’s Tip: Downtrends Develop in Stages
• Gap downs often signal urgency from sellers, not normal volatility.
• When a stock begins making new lows, the trend is shifting.
• Scaling out in stages protects gains while the chart deteriorates.
CLICK/TAP CHART TO ZOOM
Chart services courtesy of stockcharts.com. Annotations by James Taulman.
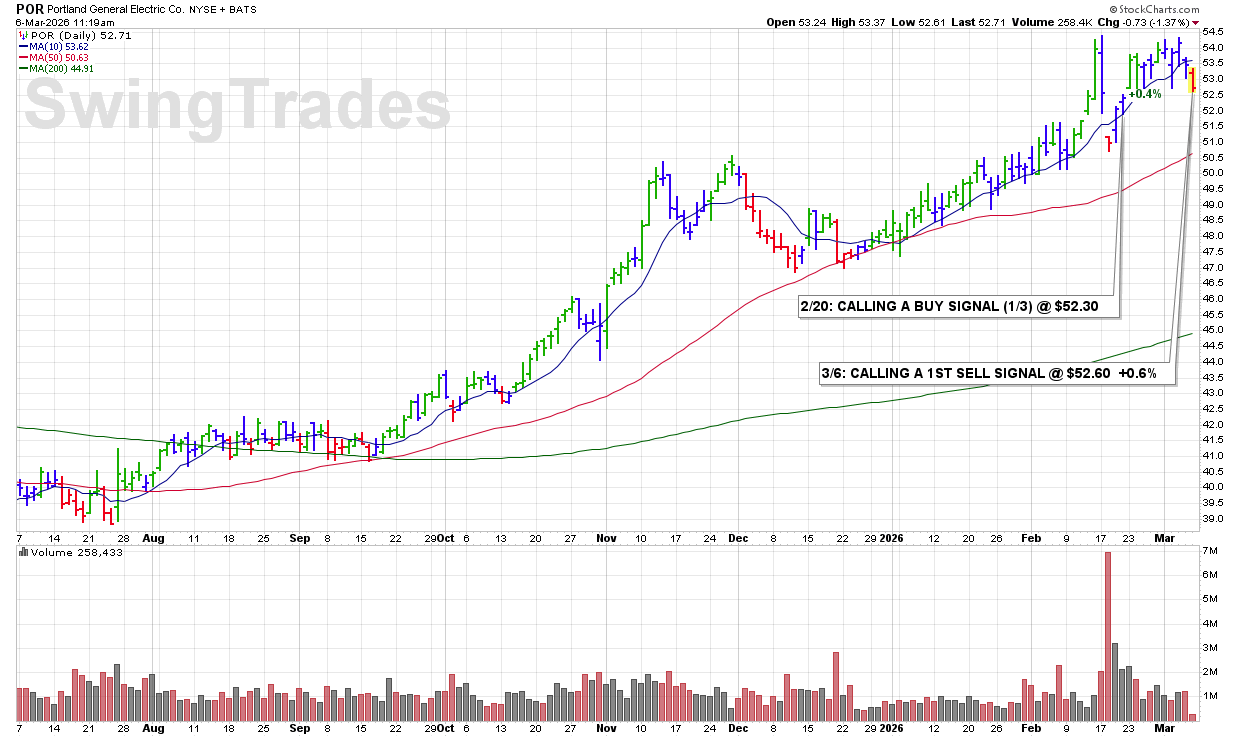
11:13 AM – Shares are clearly breaking below their 10 DMA with an increase in volume. That violation signals weakening short-term momentum and triggers a 1st SELL SIGNAL under our rules.
ULTRA Trader’s Tip: Volume Confirms the Violation
• Breaks of the 10 DMA carry more weight when volume expands.
• Increased volume signals institutional selling, not random price movement.
• Acting early on rule violations prevents small problems from becoming larger ones.
CLICK/TAP CHART TO ZOOM
Chart services courtesy of stockcharts.com. Annotations by James Taulman.
9:40 AM – Shares are breaking below support at the round-$25 level. When a stock loses a key psychological support level, it often signals increasing selling pressure. Calling a 1st SELL SIGNAL here to reduce exposure and manage risk.
ULTRA Trader’s Tip: Respect Psychological Support Levels
• Round-number levels often act as natural support or resistance.
• When price breaks those levels, it can trigger additional selling.
• Acting early keeps losses controlled while preserving flexibility.

CLICK/TAP CHART TO ZOOM
Chart services courtesy of stockcharts.com. Annotations by James Taulman.
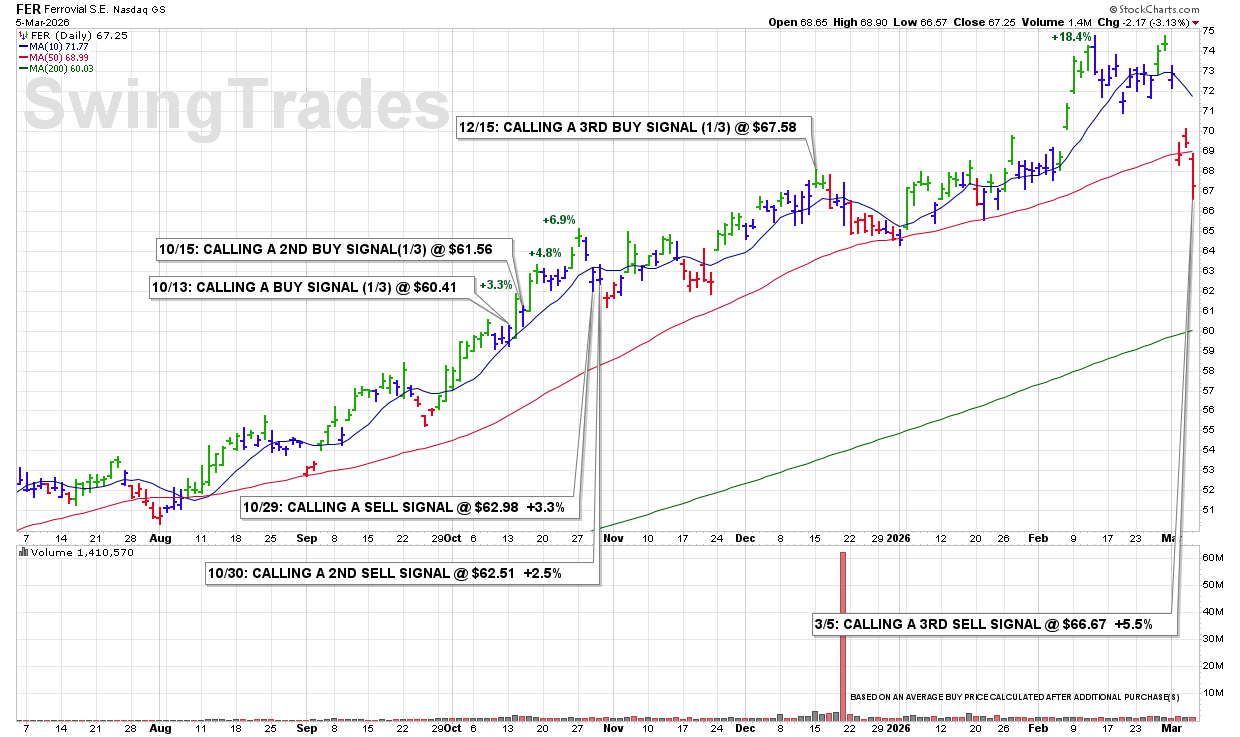
2:31 PM – Shares have committed a clear violation of the 50 DMA, and that is a SELL SIGNAL under our rules. When a stock loses this key intermediate support level, it signals a shift in trend and increasing downside risk. Calling a 3RD and FINAL SELL SIGNAL here.
ULTRA Trader’s Tip: The 50 DMA Signals Trend Change
• The 50 DMA often marks the line between uptrend stability and deeper weakness.
• When a stock violates that level, institutions are often stepping aside.
• Following SELL SIGNAL rules protects capital and prevents small gains from turning into losses.
CLICK/TAP CHART TO ZOOM
Chart services courtesy of stockcharts.com. Annotations by James Taulman.
2:29 PM – Shares continue to decline today on above-average volume. The stock never recovered from its earnings selloff. There have been several bearish signals since that reaction — beginning with the turnback from the 10 DMA and break of the 50 DMA on 2/12. Then came the rejection at the 50 DMA on 2/27, followed by back-to-back gap downs starting on 3/2. That sequence confirms sustained technical deterioration. Calling a 3RD and FINAL SELL SIGNAL here.
ULTRA Trader’s Tip: Respect the Sequence of Weakness
• When a stock breaks the 50 DMA after failing at the 10 DMA, momentum has clearly deteriorated.
• Repeated gap downs signal urgency from sellers, not normal volatility.
• Following SELL SIGNAL rules removes hesitation and prevents deeper losses.
CLICK/TAP CHART TO ZOOM
Chart services courtesy of stockcharts.com. Annotations by James Taulman.
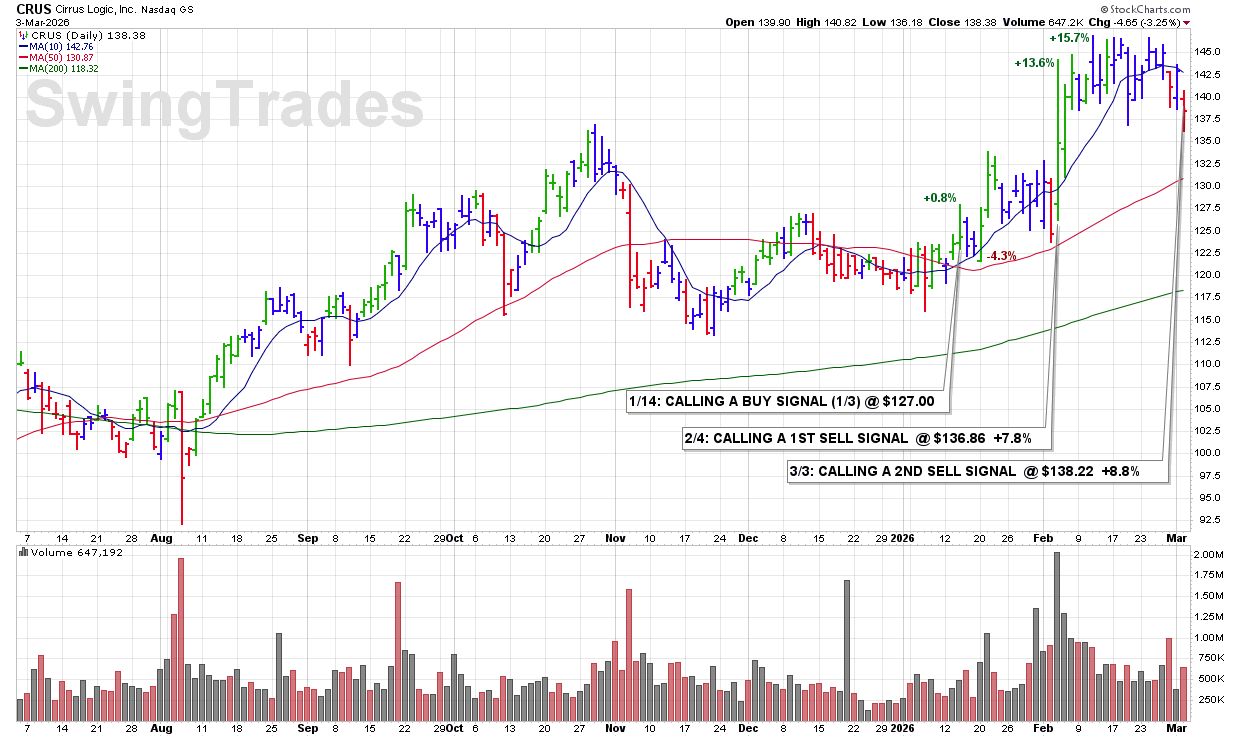
3:28 PM – Shares are getting turned back from the 10 DMA and are clearly breaking support at the round-$140 level as the 10 DMA begins to roll over. Those are bearish technical developments that signal weakening momentum. Calling a 2ND SELL SIGNAL here while the stock is still holding a solid gain.
BUY SIGNALS:
1/14 (1/3) @ $127.00
SELL SIGNALS:
2/4 (1/3) @ $136.86 +7.8%
3/3 (1/3) @ $138.22 +8.8%
OVERALL P/L: +8.3%
ULTRA Trader’s Tip: Rejection at the 10 DMA Matters
• When a stock is rejected at the 10 DMA, short-term momentum is weakening.
• Breaks of round-number support often accelerate selling pressure.
• Scaling out during early technical deterioration helps preserve gains.
CLICK/TAP CHART TO ZOOM
Chart services courtesy of stockcharts.com. Annotations by James Taulman.
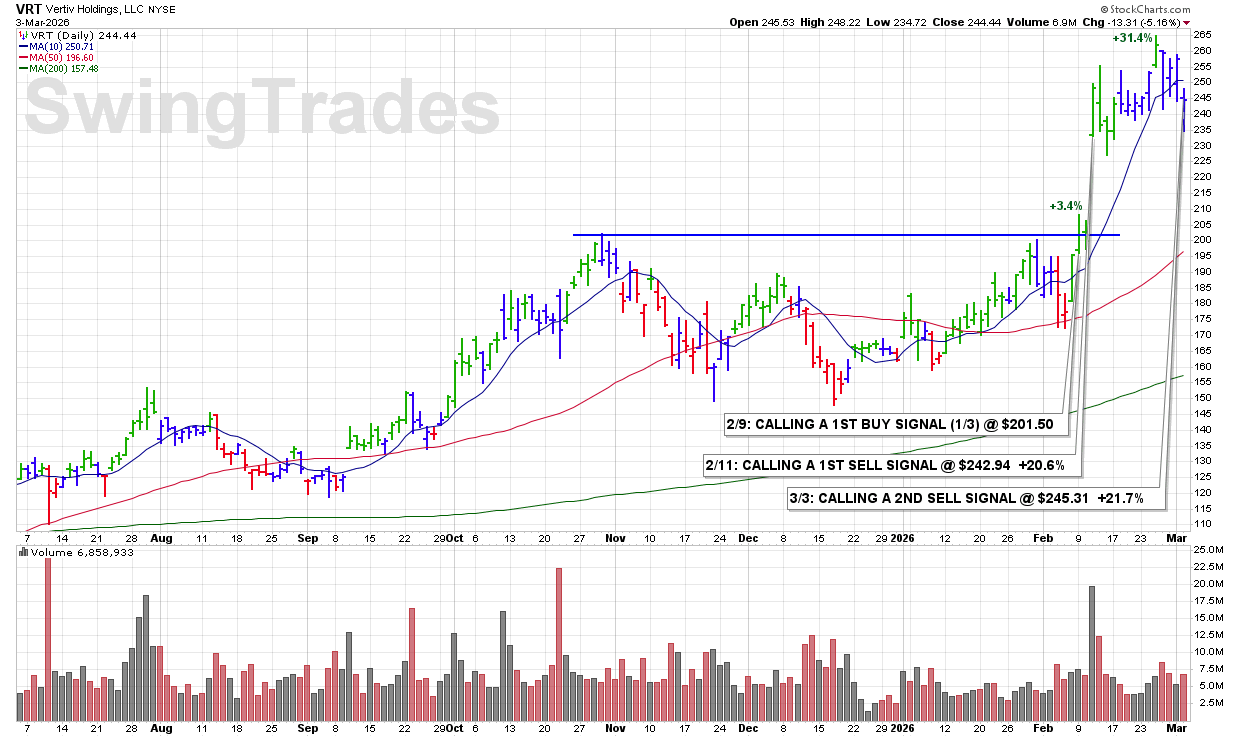
3:24 PM – Shares are clearly breaking below the 10 DMA, and that is a SELL SIGNAL under our rules. With the stock violating this key short-term support level, it signals a shift in momentum. Calling a 2ND SELL SIGNAL here to lock in additional gains while the stock is still well above our entry.
BUY SIGNALS:
2/9 (1/3) @ $201.50
SELL SIGNALS:
2/11 (1/3) @ $242.94 +20.6%
3/3 (1/3) @ $245.31 +21.7%
OVERALL P/L: +21.1%
ULTRA Trader’s Tip: Violations of the 10 DMA Matter
• The 10 DMA is the heartbeat of short-term momentum.
• When a stock breaks that line, the first job is protecting gains.
• Scaling out into rule violations keeps profits intact while reducing exposure.
CLICK/TAP CHART TO ZOOM
Chart services courtesy of stockcharts.com. Annotations by James Taulman.
9:57 AM – The stock is getting turned back from its 10 DMA and breaking below round-$200 support. That combination signals weakening momentum. Calling a 3rd and FINAL SELL SIGNAL here this morning against a volatile market backdrop. Being nimble in a difficult market environment is prudent, especially while booking modest gains.
BUY SIGNALS:
1/13 (1/3) @ $188.94
SELL SIGNALS:
2/11 (1/3) @ $204.19 +8.1%
2/26 (1/3) @ $203.24 +7.6%
3/3 (1/3) @ $198.10 +4.8%
OVERALL P/L: +6.8%
ULTRA Trader’s Tip: Respect Round-Number Breaks
• Round-number levels often act as psychological support and resistance.
• When price breaks a level like $200 while also failing at the 10 DMA, momentum is shifting.
• Taking profits during rule violations keeps gains intact during volatile markets.

CLICK/TAP CHART TO ZOOM
Chart services courtesy of stockcharts.com. Annotations by James Taulman.
9:51 AM – Shares are making new lows today and the 10 DMA is just beginning to roll over. That signals weakening short-term momentum and the early stages of a developing downtrend. When a stock begins losing support and fails to stabilize, risk increases quickly. Calling a 2ND SELL SIGNAL here.
BUY SIGNALS:
2/20 (1/3) @ $25.43
SELL SIGNALS:
3/2 (1/3) @ $24.34 -4.3%
3/3 (1/3) @ $24.05 -5.4%
OVERALL P/L: -4.9%
ULTRA Trader’s Tip: Downtrends Start Small
• A rolling 10 DMA is often the first sign that momentum is fading.
• New lows following a support break confirm developing technical weakness.
• Scaling out early keeps losses controlled before a downtrend accelerates.

CLICK/TAP CHART TO ZOOM
Chart services courtesy of stockcharts.com. Annotations by James Taulman.
9:41 AM – Shares gapped down this morning and broke below stacked support at the 10 DMA and the round-$350 level. While the stock carries high ranks and solid fundamentals, this is swing trading, and a break of the 10 DMA is a SELL SIGNAL on our books. With gains now exceeding +22% on the final 1/3, it makes sense – rather than risk giving them back in a volatile market.
BUY SIGNALS:
12/10 (1/3) @ $278.29
SELL SIGNALS:
12/17 (1/3) @ $274.54 -1.3%
1/19 (1/3) @ $302.44 +8.7%
3/3 (1/3) @ $339.62 +22.04%
OVERALL P/L: +9.8%
ULTRA Trader’s Tip: Protect Gains When Support Breaks
• A gap below the 10 DMA signals a sudden shift in short-term momentum.
• When key support levels break together, downside pressure can accelerate quickly.
• Booking profits into rule violations protects gains before volatility erodes them.

CLICK/TAP CHART TO ZOOM
Chart services courtesy of stockcharts.com. Annotations by James Taulman.
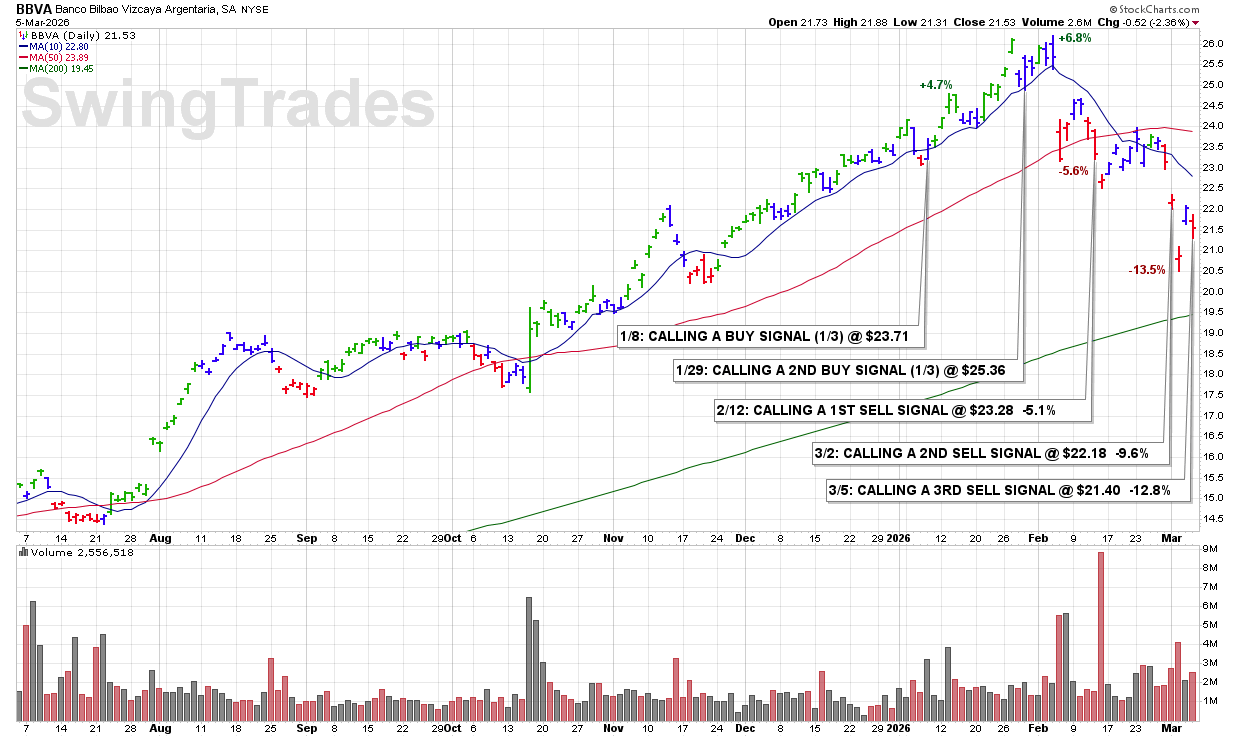
10:00 AM – The stock opened with a gap down this morning after recently being turned back from its 50 DMA. That rejection at a key intermediate resistance level was an early warning. Now the downside follow-through confirms continued technical deterioration. When a stock fails at the 50 DMA and then gaps lower, risk increases quickly. Calling a 2nd SELL SIGNAL.
BUY SIGNALS:
1/8 (1/3) @ $23.71
1/29 (1/3) @ $25.36
SELL SIGNALS:
2/12 (1/3) @ $23.28 -5.1%
3/2 (1/3) @ $22.18 -9.6%
OVERALL P/L: -7.4%

CLICK/TAP CHART TO ZOOM
Chart services courtesy of stockcharts.com. Annotations by James Taulman.
9:51 AM – Shares are breaking below the 10 DMA with little sign of institutional support. The stock has failed to show immediate upside follow-through after entry, and momentum is now deteriorating. For a swing trade, underperformance combined with a clear technical violation warrants action. Calling a 1st SELL SIGNAL here.
BUY SIGNALS:
2/20 (1/3) @ $25.43
SELL SIGNALS:
3/2 (1/3) @ $24.34 -4.3%
OVERALL P/L: -4.3%
ULTRA Trader’s Tip: Small Losses Are Strategic
• A clean break below the 10 DMA is a rule-based exit — no debate required.
• Swing trades should work quickly. If they don’t, risk must be reduced.
• Keeping losses small preserves both capital and mental clarity for the next opportunity.

CLICK/TAP CHART TO ZOOM
Chart services courtesy of stockcharts.com. Annotations by James Taulman.
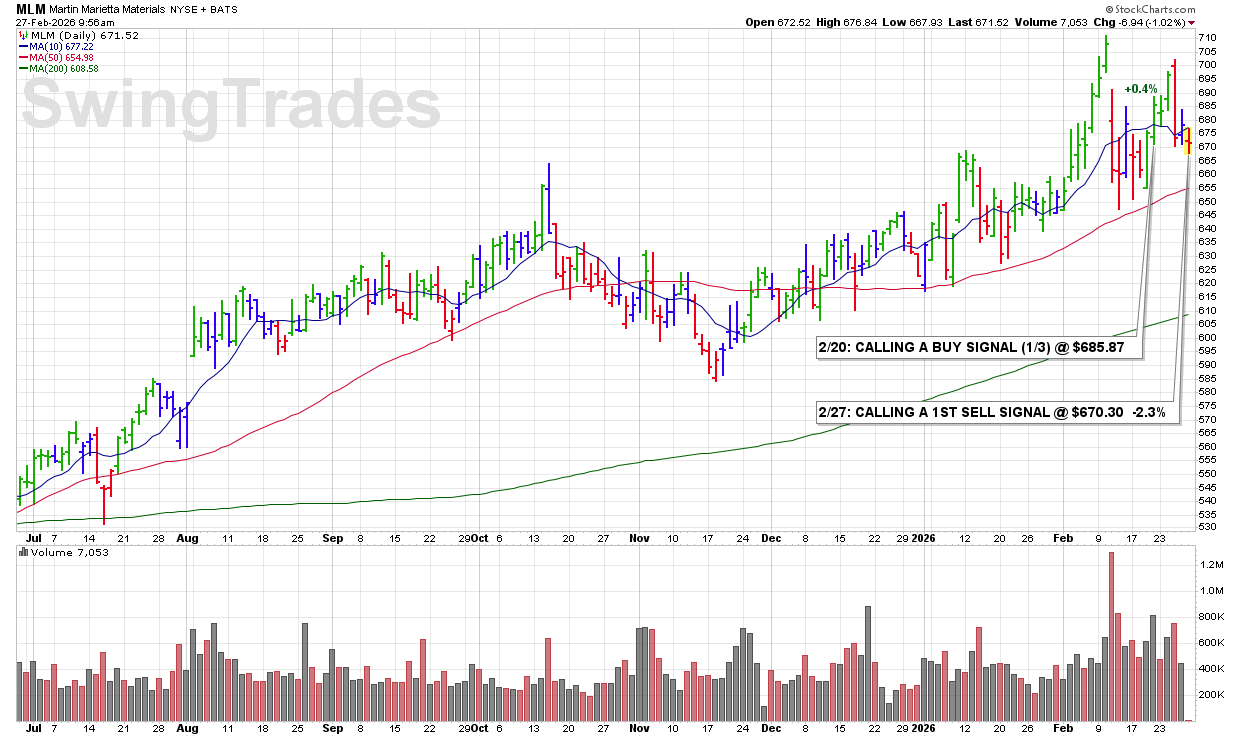
9:48 AM – Calling a 1st SELL SIGNAL here as shares are clearly breaking below the 10 DMA, and more importantly, the stock is underperforming for a swing trade. The sharp turn-back from round-$700 resistance on Wednesday was an early sign of technical weakness. When a stock fails at a key psychological level and then violates the 10 DMA, that’s a shift in short-term character.
BUY SIGNALS:
2/20 (1/3) @ $685.87
SELL SIGNALS:
2/27 (1/3) @ $670.30 -2.3%
OVERALL P/L: -2.3%
ULTRA Trader’s Tip: Underperformance Is a Clue
• A swing trade should show relative strength quickly. When it lags, pay attention.
• Rejection at a round-number resistance level often signals supply overhead.
• Breaking the 10 DMA after that rejection confirms momentum deterioration — act early, not late.
CLICK/TAP CHART TO ZOOM
Chart services courtesy of stockcharts.com. Annotations by James Taulman.
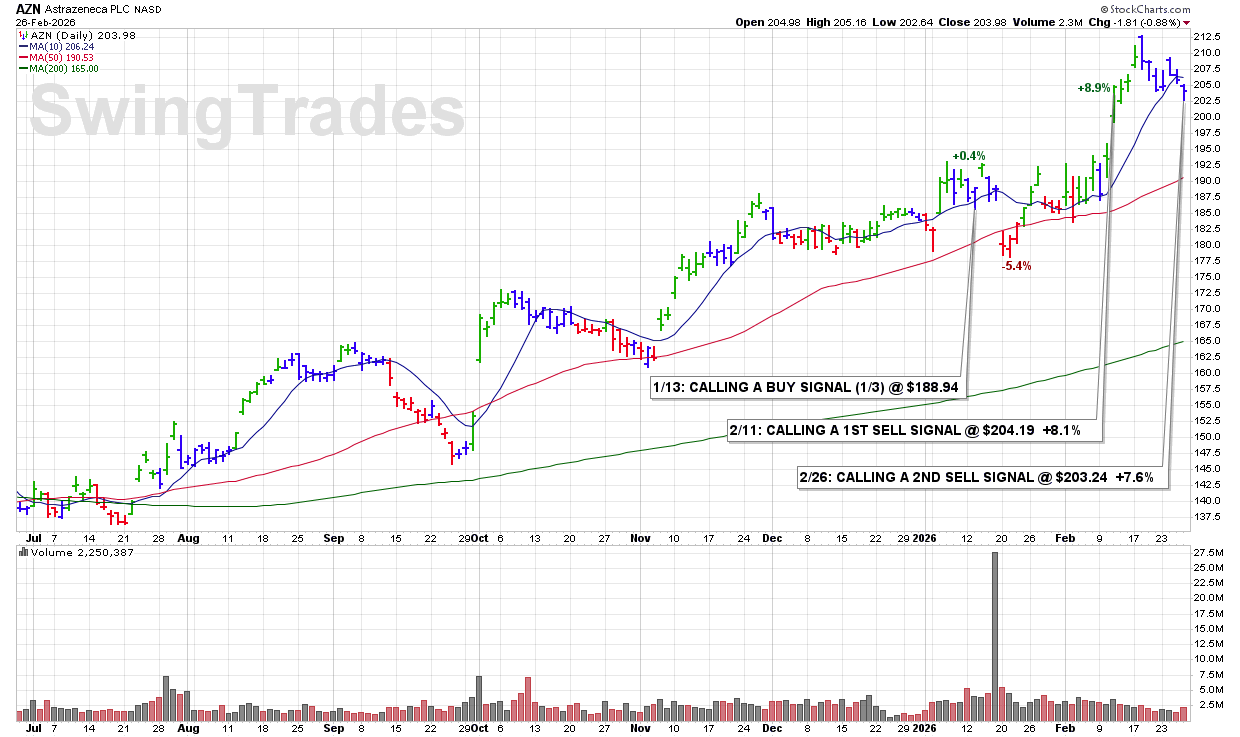
10:44 AM – Shares are breaking below the 10 DMA with a sharp increase in volume. That is a default SELL SIGNAL under our rules. Momentum is shifting, and volume confirms it. Next clear support sits near the round $200 level. A decisive break below that area would trigger the FINAL SELL SIGNAL — and still lock in a solid winner.
BUY SIGNALS:
1/13 (1/3) @ $188.94
SELL SIGNALS:
2/11 (1/3) @ $204.19 +8.1%
2/26 (1/3) @ $203.24 +7.6%
OVERALL P/L: +7.9%
ULTRA Trader’s Tip: The 10 DMA Rules
• A break below the 10 DMA is a SELL SIGNAL — especially when volume expands.
• Increased volume signals institutional distribution, not random movement.
• Following this rule violation preserves gains and prevents a winner from turning into a problem.
CLICK/TAP CHART TO ZOOM
Chart services courtesy of stockcharts.com. Annotations by James Taulman.
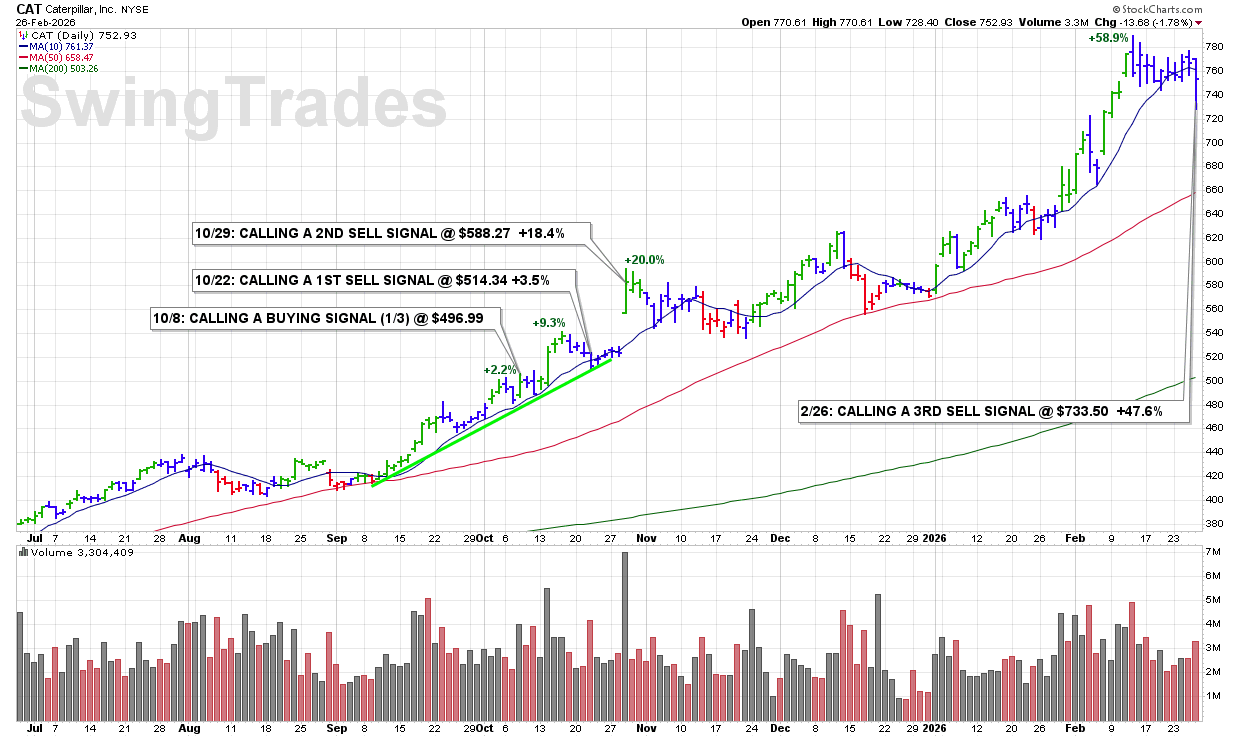
10:31 AM – Finally calling a third and FINAL SELL SIGNAL this morning as shares are clearly breaking below the 10 DMA with an increase in volume. That violation confirms a shift in short-term momentum. After a powerful advance, we now follow the rule and lock in gains as leadership begins to weaken.
SELL SIGNALS:
10/22 (1/3) @ $514.34 +3.5%
10/29 (1/3) @ $588.27 +18.4%
2/26 (1/3) @ $733.50 +47.6%
OVERALL P/L: +23.2%
ULTRA Trader’s Tip: Sell Into Rule Violations, Not Emotion
• A break below the 10 DMA with volume is a non-negotiable SELL SIGNAL.
• Large gains mean nothing if you ignore momentum deterioration.
• Scaling out in thirds allows you to participate in major moves — while still exiting with discipline when character changes.
CLICK/TAP CHART TO ZOOM
Chart services courtesy of stockcharts.com. Annotations by James Taulman.
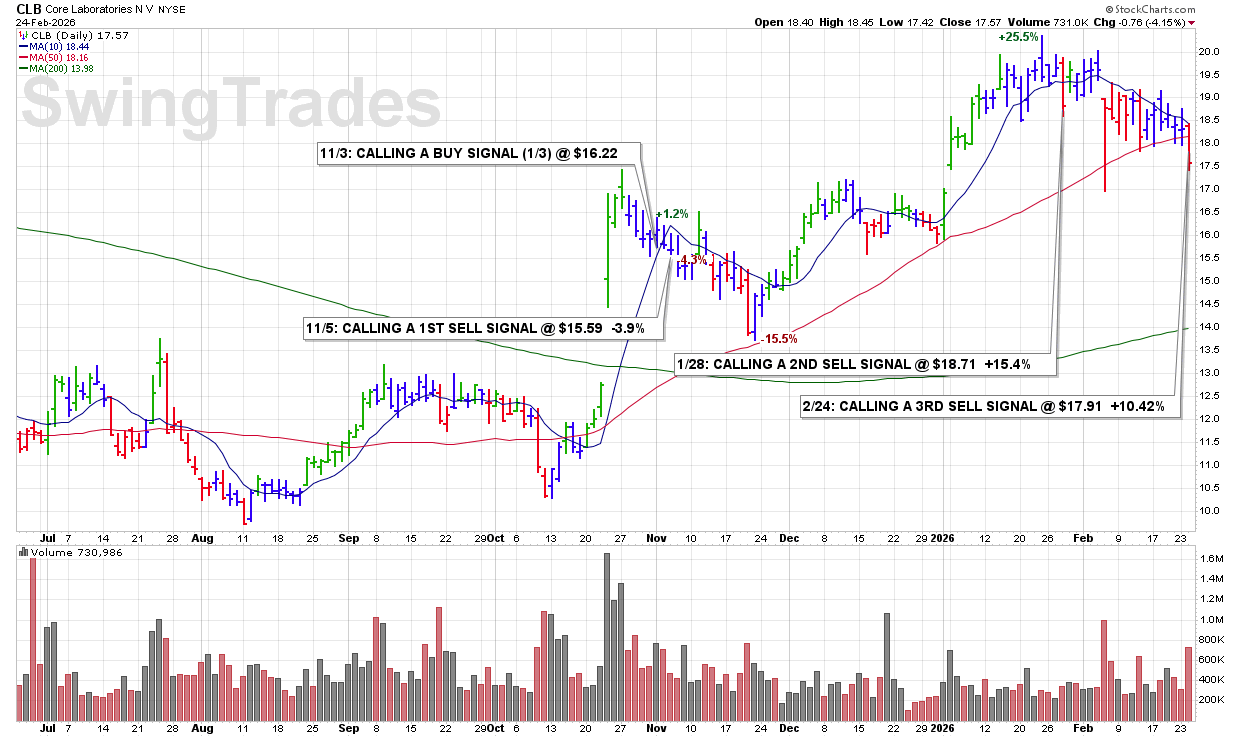
1:51 PM – After repeatedly running into resistance at the 10 DMA throughout February and forming a pattern of lower highs, shares are now committing another technical violation by breaking below the 50 DMA. That confirms continued deterioration in trend structure. Calling a 3RD and FINAL SELL SIGNAL here.
SELL SIGNALS:
11/5 (1/3) @ $15.59 -3.9%
1/28 (1/3) @ $18.71 +15.4%
2/24 (1/3) @ $17.91 +10.42%
OVERALL P/L: +7.3%
ULTRA Trader’s Tip: Multiple Failures at the 10 DMA Signal Trend Change
• Repeated rejection at the 10 DMA often precedes deeper weakness.
• Lower highs confirm developing downtrend pressure.
• A break of the 50 DMA removes intermediate institutional support.
• Protect gains before a controlled pullback becomes a larger decline.
CLICK/TAP CHART TO ZOOM
Chart services courtesy of stockcharts.com. Annotations by James Taulman.
1:47 PM – Shares have quieted down and are now breaking below the ROUND-$20 support level. After a strong, quick run higher, momentum is starting to fade as merger talks continue to create uncertainty. This is swing trading. When a stock delivers sharp gains and then begins to stall and violate support, it’s time to lock in profits and rotate into another selection with potentially quicker upside.
SELL SIGNALS:
1/13 (1/3) @ $17.05 +9.1%
1/26 (1/3) @ $17.38 +11.2%
2/24 (1/3) @ $19.73 +26.23%
OVERALL P/L: +15.5%
ULTRA Trader’s Tip: Take Strength — Don’t Marry It
• Strong gains are a gift — but only if you capture them.
• When momentum fades and support breaks, character has changed.
• Swing trading is about rotation, not attachment.
• Book profits. Reallocate. Stay in moving stocks.

CLICK/TAP CHART TO ZOOM
Chart services courtesy of stockcharts.com. Annotations by James Taulman.
PRIVACY POLICY | TERMS & CONDITIONS