Ongoing updates for GATX will be posted at the link below, as soon as each one is made available.
https://buyingbreakouts.com/category/gatx/
You can bookmark the page for future reference.
Ongoing updates for GATX will be posted at the link below, as soon as each one is made available.
https://buyingbreakouts.com/category/gatx/
You can bookmark the page for future reference.
Ongoing updates for GLAD will be posted at the link below, as soon as each one is made available.
https://buyingbreakouts.com/category/glad/
You can bookmark the page for future reference.
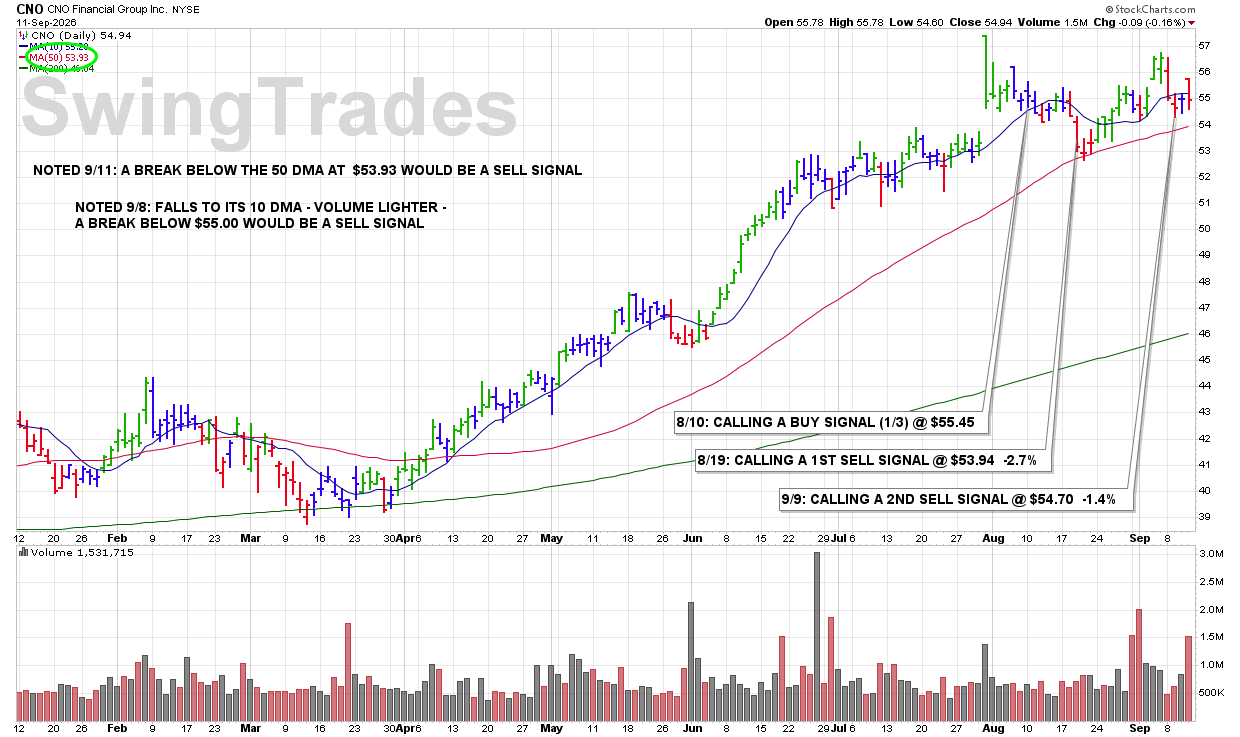
Ongoing updates for CNO will be posted at the link below, as soon as each one is made available.
https://buyingbreakouts.com/category/cno/
You can bookmark the page for future reference.
9:05 PM – We are currently reporting on this stock as an active holding and continue to monitor the stock closely for any technical SELL SIGNALS.
The focus always remains on price/volume action around key support levels, including the 10 DMA, 50 DMA, and any nearby trendline or ROUND-$ support.

CLICK/TAP CHART TO ZOOM
Chart services courtesy of stockcharts.com. Annotations by James Taulman.
9:00 PM – We are currently reporting on this stock as an active holding and continue to monitor the stock closely for any technical SELL SIGNALS.
The focus always remains on price/volume action around key support levels, including the 10 DMA, 50 DMA, and any nearby trendline or ROUND-$ support.
CLICK/TAP CHART TO ZOOM
Chart services courtesy of stockcharts.com. Annotations by James Taulman.
10:12 AM – As reported last night, “a break below $55.00 would be a SELL SIGNAL.” This morning shares are trading below that level while volume is running above average. That drop below the ROUND-$55 support level, accompanied by increased volume, is enough to trigger our 2ND SELL SIGNAL.
ULTRA Trader’s Tip: Define the Sell Level Before It Breaks
• Identifying important support in advance gives us an objective level to act on.
• A break below ROUND-$55 shows that the previously identified support is no longer holding.
• Increased volume adds significance to the violation and reinforces the SELL SIGNAL.
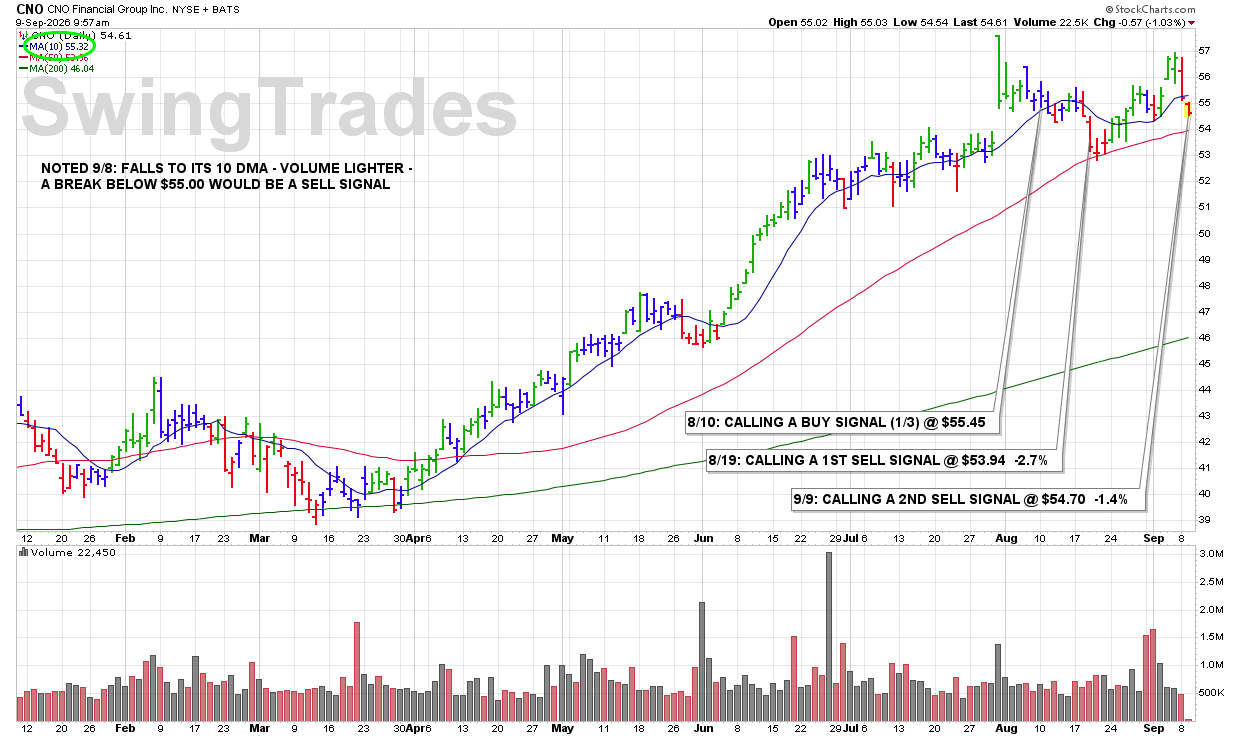
CLICK/TAP CHART TO ZOOM
Chart services courtesy of stockcharts.com. Annotations by James Taulman.
Ongoing updates for CNO will be posted at the link below, as soon as each one is made available.
https://buyingbreakouts.com/category/cno/
You can bookmark the page for future reference.
Latest Chart Update: MCK
9:55 PM – We are currently reporting on this stock as an active holding and continue to monitor the stock closely for any technical SELL SIGNALS.
The focus always remains on price/volume action around key support levels, including the 10 DMA, 50 DMA, and any nearby trendline or ROUND-$ support.

CLICK/TAP CHART TO ZOOM
Chart services courtesy of stockcharts.com. Annotations by James Taulman.
Latest Chart Update: MYE
9:40 PM – We are currently reporting on this stock as an active holding and continue to monitor the stock closely for any technical SELL SIGNALS.
The focus always remains on price/volume action around key support levels, including the 10 DMA, 50 DMA, and any nearby trendline or ROUND-$ support.
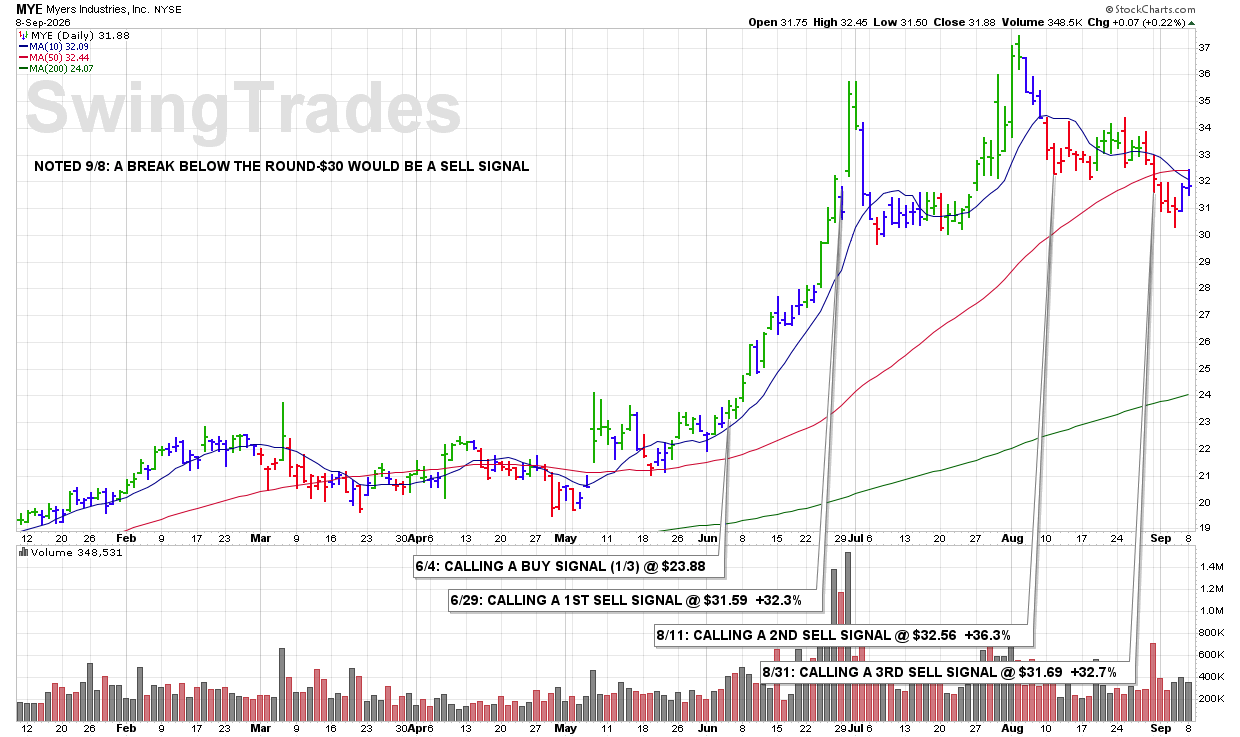
CLICK/TAP CHART TO ZOOM
Chart services courtesy of stockcharts.com. Annotations by James Taulman.
Latest Chart Update: AIT
9:35 PM – We are currently reporting on this stock as an active holding and continue to monitor the stock closely for any technical SELL SIGNALS.
The focus always remains on price/volume action around key support levels, including the 10 DMA, 50 DMA, and any nearby trendline or ROUND-$ support.
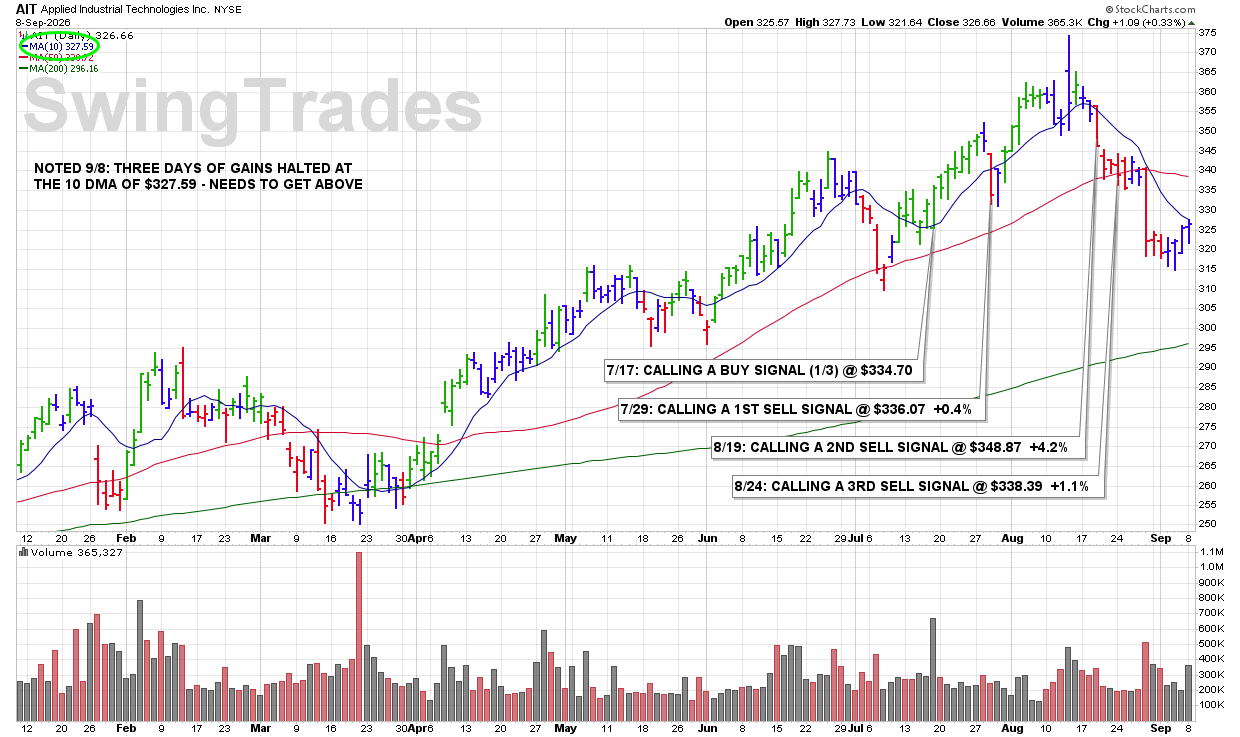
CLICK/TAP CHART TO ZOOM
Chart services courtesy of stockcharts.com. Annotations by James Taulman.
Latest Chart Update: CNO
9:30 PM – We are currently reporting on this stock as an active holding and continue to monitor the stock closely for any technical SELL SIGNALS.
The focus always remains on price/volume action around key support levels, including the 10 DMA, 50 DMA, and any nearby trendline or ROUND-$ support.
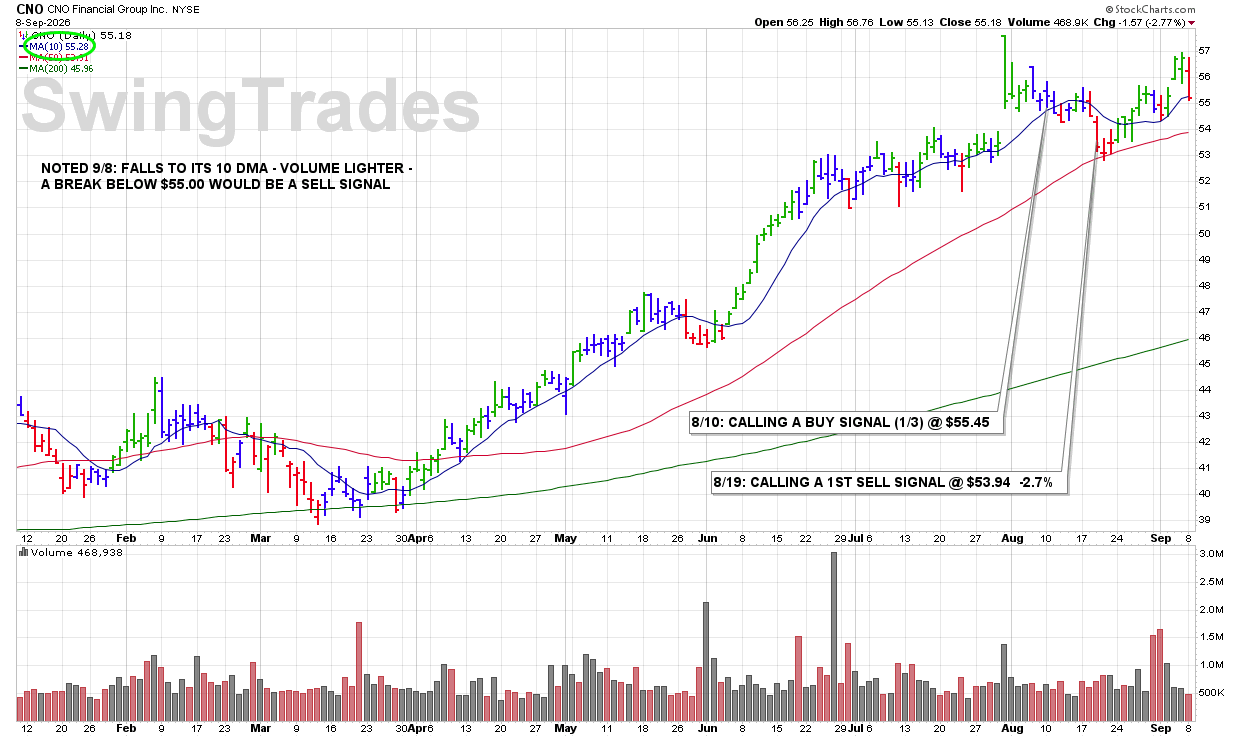
CLICK/TAP CHART TO ZOOM
Chart services courtesy of stockcharts.com. Annotations by James Taulman.
10:05 PM – Calling a FINAL SELL SIGNAL on Byline Bancorp as bearish technical action continues to mount. The 10 DMA has repeatedly weighed on the stock and acted as resistance, while a clear downtrend has developed from the early-August highs near $40.00. Today’s move to a new recent closing low adds another bearish sign and confirms the continued deterioration.
ULTRA Trader’s Tip: Repeated Resistance Can Define the Trend
• When a stock repeatedly fails at the 10 DMA, that line can shift from support to resistance.
• A pattern of lower prices developing from prior highs is evidence that a downtrend is taking shape.
• New recent lows add confirmation that weakness is continuing and support taking the final SELL SIGNAL.
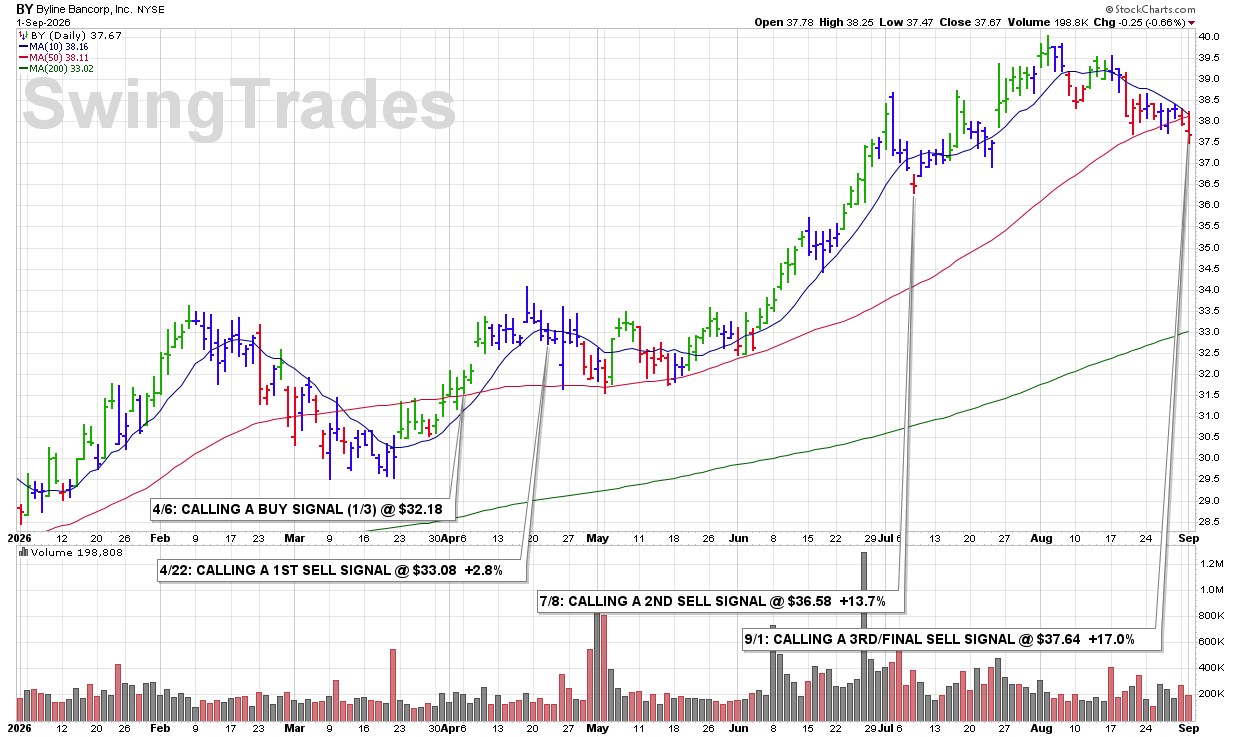
CLICK/TAP CHART TO ZOOM
Chart services courtesy of stockcharts.com. Annotations by James Taulman.
Ongoing updates for BY will be posted at the link below, as soon as each one is made available.
https://buyingbreakouts.com/category/by/
You can bookmark the page for future reference.
1:05 PM – Calling a 3RD and FINAL SELL SIGNAL this afternoon as shares clearly break below their 50 DMA support while volume is on pace to finish above the daily average. That is a significant technical violation and completes all three SELL SIGNALS on this selection.
With each SELL SIGNAL locking in more than a +30% gain, MYE finishes as a clear winning ULTRA swing trade.
ULTRA Trader’s Tip: Scale Out and Protect a Big Winner
• The 50 DMA is an important support level, and a decisive break below it is a major technical warning.
• Scaling out through multiple SELL SIGNALS allows us to systematically protect gains as a stock weakens.
• Completing all three SELL SIGNALS with gains above +30% shows the value of letting strength work while still respecting technical violations.

CLICK/TAP CHART TO ZOOM
Chart services courtesy of stockcharts.com. Annotations by James Taulman.
Ongoing updates for MYE will be posted at the link below, as soon as each one is made available.
https://buyingbreakouts.com/category/mye/
You can bookmark the page for future reference.
3:14 PM – Calling a 3RD and FINAL SELL SIGNAL here before the close as shares dip into their 50 DMA support after already showing several bearish technical signs. With weakness continuing to build and major support now being tested, I’m closing out this selection under our rules.
ULTRA Trader’s Tip: Multiple Weakness Signals Add Up
• One bearish sign may be manageable, but several technical violations together deserve more attention.
• A test of the 50 DMA becomes more significant when the stock has already been showing ongoing weakness.
• When bearish evidence continues to stack up, follow the rules and reduce exposure.

CLICK/TAP CHART TO ZOOM
Chart services courtesy of stockcharts.com. Annotations by James Taulman.
3:59 PM – Calling a 2ND and FINAL SELL SIGNAL just before the close as shares sell off this afternoon and break below the ROUND-$55 support level while volume runs 28% above average. The combination of continued price weakness, a loss of support, and increased selling volume confirms further technical deterioration and closes out coverage on this selection.
ULTRA Trader’s Tip: Increased Volume Confirms the Weakness
• Breaking a previously identified support level is an important technical violation.
• When that break occurs on above-average volume, it adds conviction to the bearish action.
• When price and volume confirm continued weakness, follow the signal and move on.
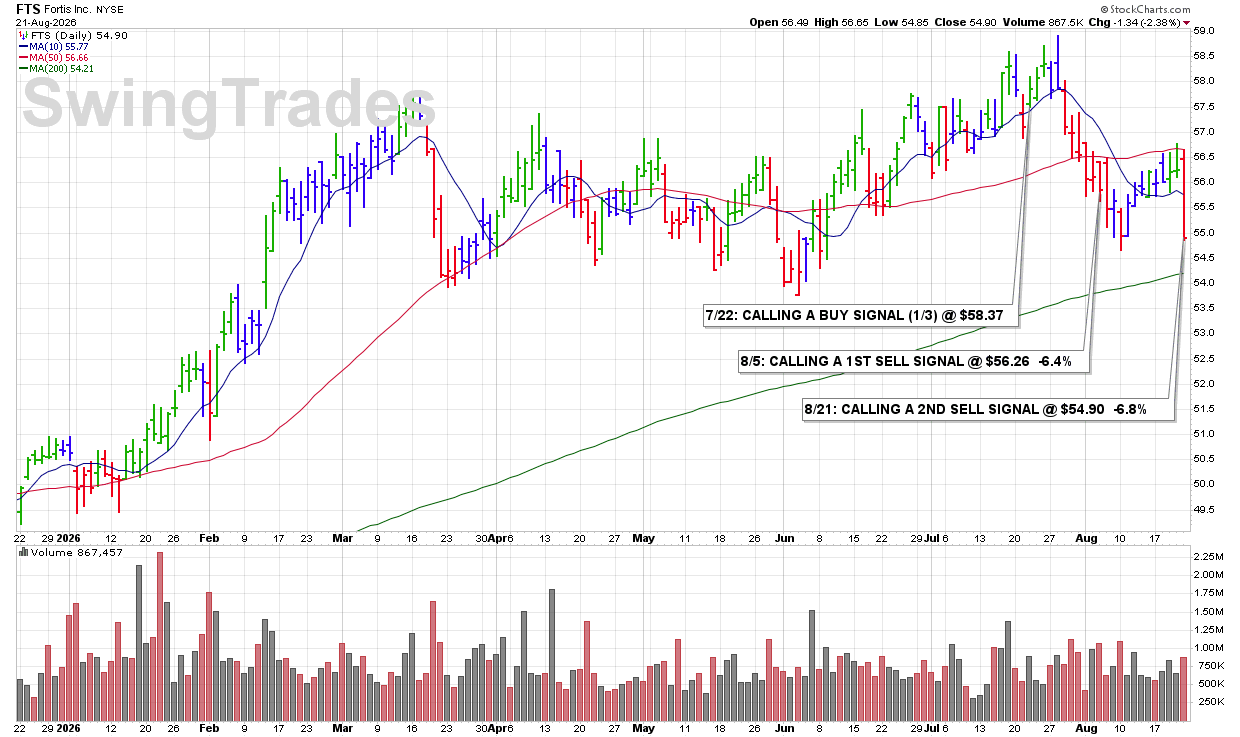
CLICK/TAP CHART TO ZOOM
Chart services courtesy of stockcharts.com. Annotations by James Taulman.
3:36 PM – Calling a 2ND SELL SIGNAL as shares break below our noted 1st SUPPORT at the ROUND-$350 level and appear set to close near the session lows. The next significant support is the 50 DMA, currently at $338.46, approximately 2.3% below the current price. A break of that level would represent another significant technical violation.
ULTRA Trader’s Tip: Support Levels Give Us a Roadmap
• Identifying support levels in advance removes guesswork when a stock begins weakening.
• When one level fails, immediately know where the next important technical support lies.
• If weakness continues and the next major support level also breaks, that provides additional evidence to reduce exposure.
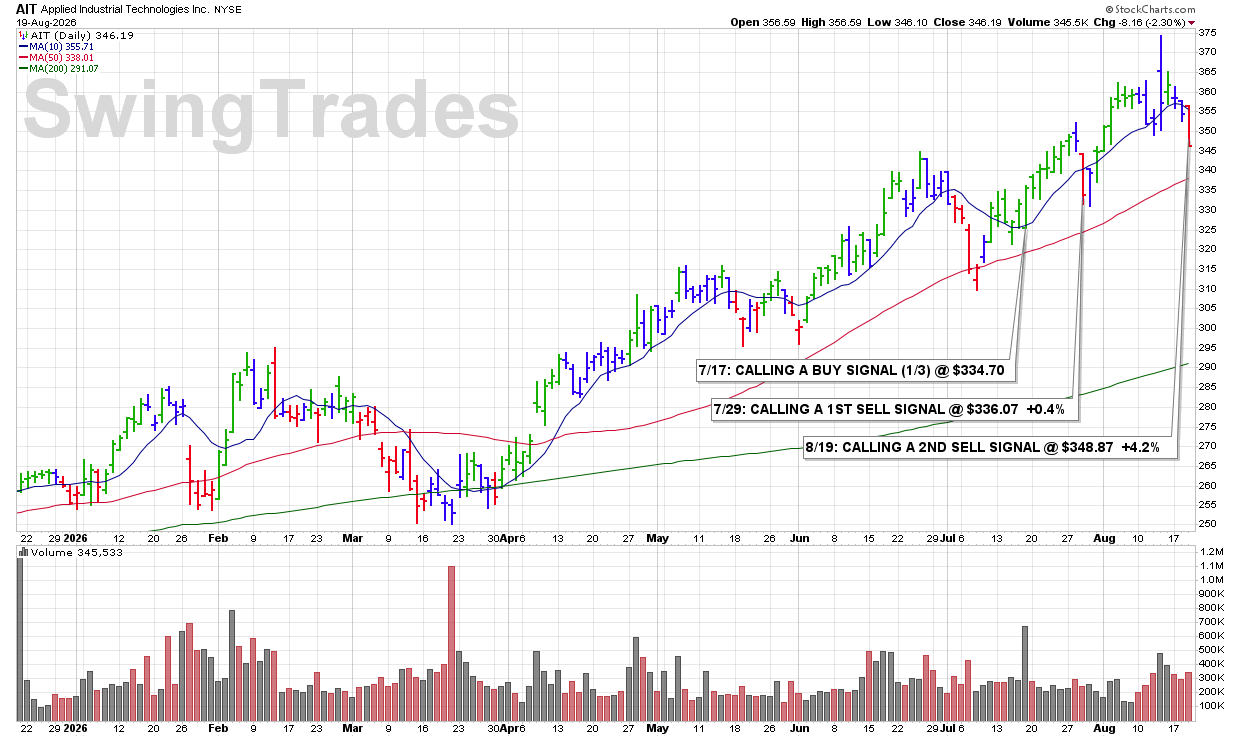
CLICK/TAP CHART TO ZOOM
Chart services courtesy of stockcharts.com. Annotations by James Taulman.
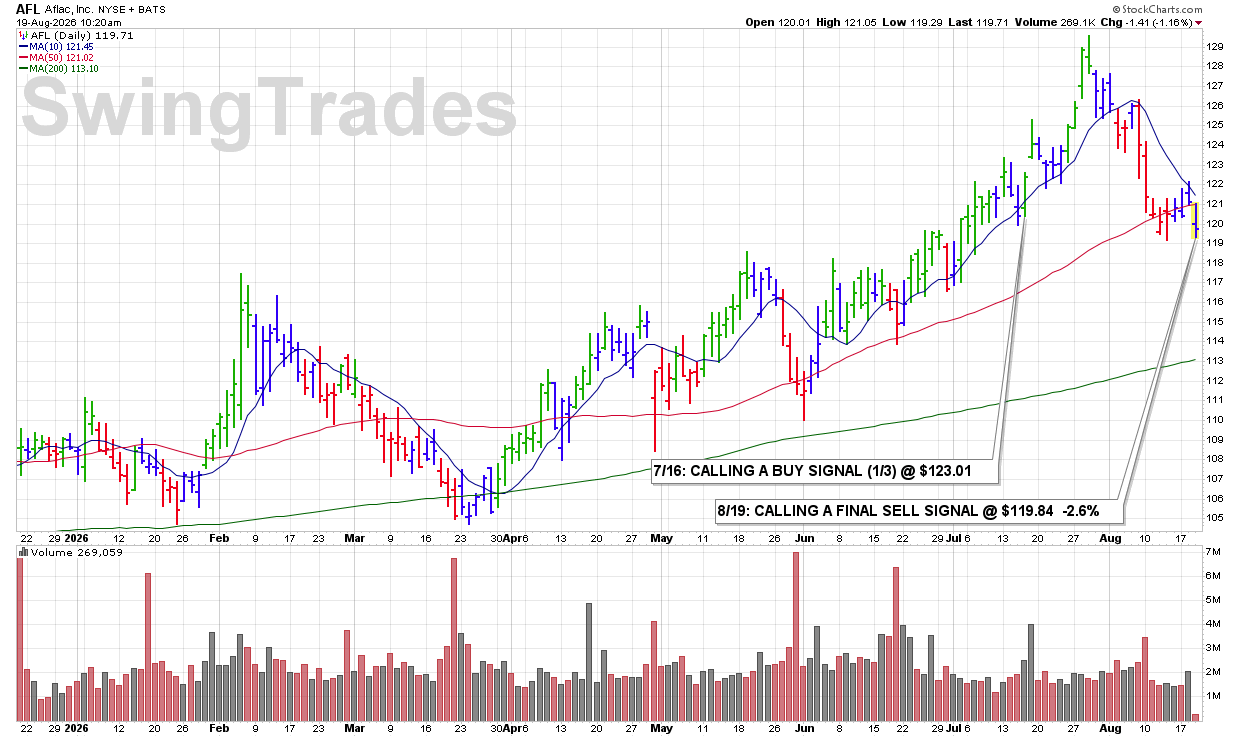
10:11 AM – The stock is gapping down this morning and breaking below our previously noted ROUND-$120 support on increased volume. The combination of a gap lower, loss of support, and expanding selling volume represents multiple bearish technical violations. Calling a 2ND yet FINAL SELL SIGNAL here and to close out coverage on this selection.
ULTRA Trader’s Tip: Multiple Violations Strengthen the Signal
• A gap lower immediately shows increased selling pressure.
• Breaking a previously identified support level adds another bearish technical violation.
• When weakness is accompanied by increased volume, the evidence becomes even stronger—respect the signal and move on.
CLICK/TAP CHART TO ZOOM
Chart services courtesy of stockcharts.com. Annotations by James Taulman.
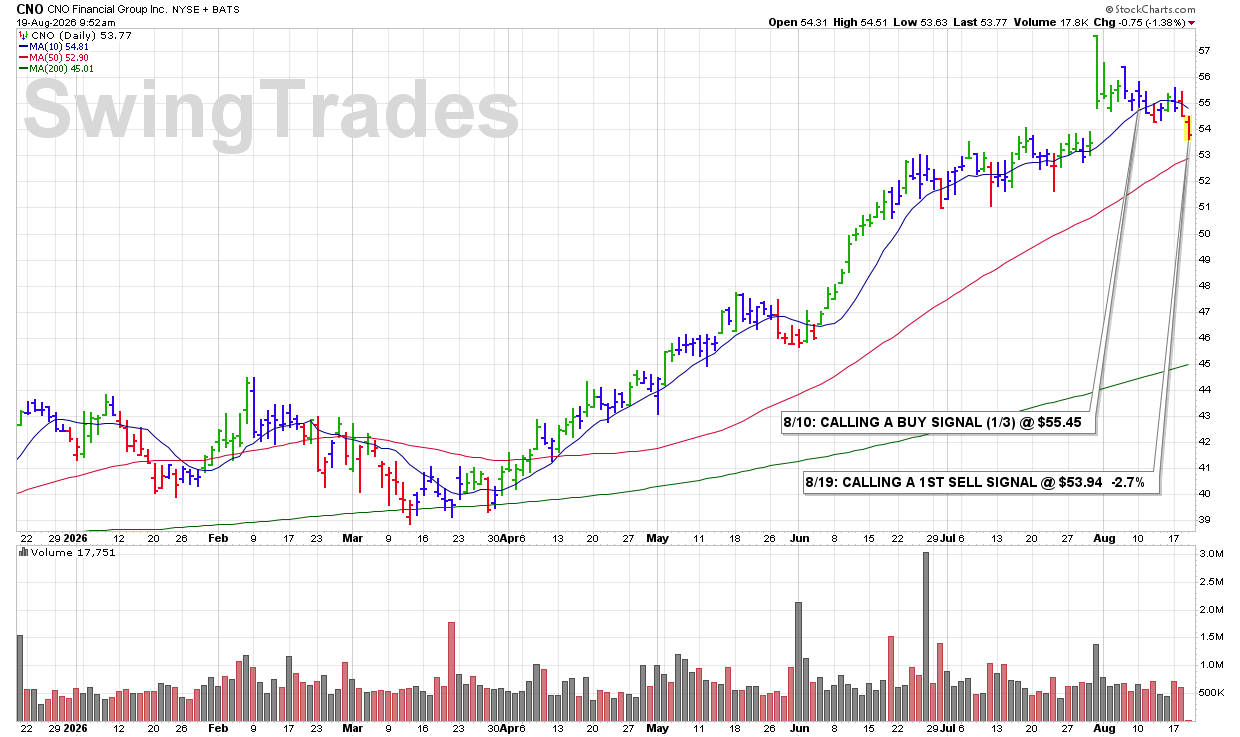
9:37 AM – Calling a 1ST SELL SIGNAL this morning as shares sell off on increased volume and clearly lose support at the 10 DMA. That combination of declining price, expanding volume, and a break of our primary technical support level represents a standard SELL SIGNAL under our rules.
ULTRA Trader’s Tip: Price and Volume Should Confirm Each Other
• A break below the 10 DMA is an important technical warning.
• When that break occurs with increased selling volume, the violation carries greater significance.
• Responding to weakness early helps keep a manageable loss from developing into something larger.
CLICK/TAP CHART TO ZOOM
Chart services courtesy of stockcharts.com. Annotations by James Taulman.
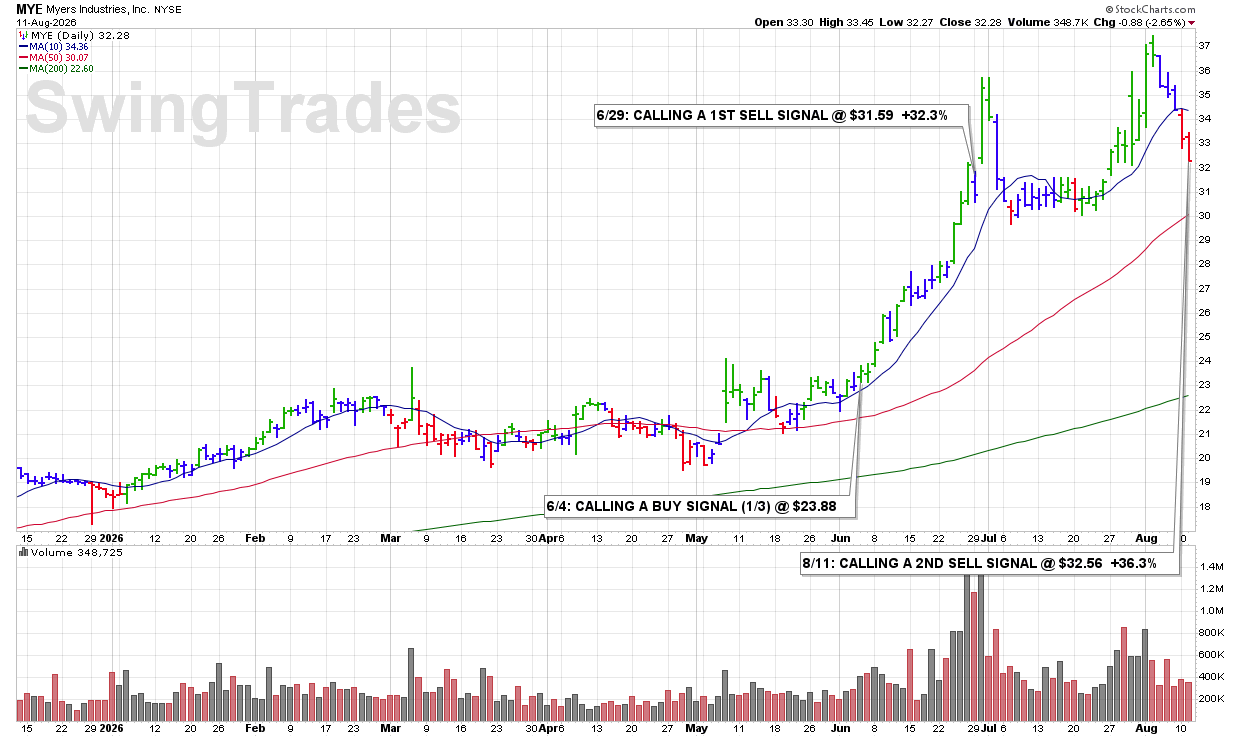
3:44 PM – Calling a 2ND SELL SIGNAL as we head into today’s close. The stock has clearly lost its 10 DMA (blue line) and has continued to exhibit bearish technical action with a string of down days from its recent high. With a substantial +36.3% gain still intact, the continued deterioration is another signal to take additional profits and reduce exposure.
ULTRA Trader’s Tip: Protect Big Winners as Weakness Develops
• A strong previous gain does not override current bearish technical action.
• A string of declining sessions followed by a clear 10 DMA violation signals that momentum has changed.
• Scaling out allows you to systematically protect profits as technical weakness develops rather than waiting for the entire gain to disappear.
CLICK/TAP CHART TO ZOOM
Chart services courtesy of stockcharts.com. Annotations by James Taulman.
10:05 AM – Shares of this insurance leader are currently trading higher from the 10 DMA with an increase in volume. This is my most common BUY SIGNAL—price advancing from proven 10 DMA support with expanding volume. Calling for an initial 1/3 position here.
ULTRA Trader’s Tip: The 10 DMA Is Our Primary BUY SIGNAL
• A stock advancing from its 10 DMA shows that short-term support is holding.
• Increased volume adds confirmation that meaningful buying demand is behind the move.
• Starting with a 1/3 position allows us to participate while leaving room to add as additional technical strength develops.

CLICK/TAP CHART TO ZOOM
Chart services courtesy of stockcharts.com. Annotations by James Taulman.
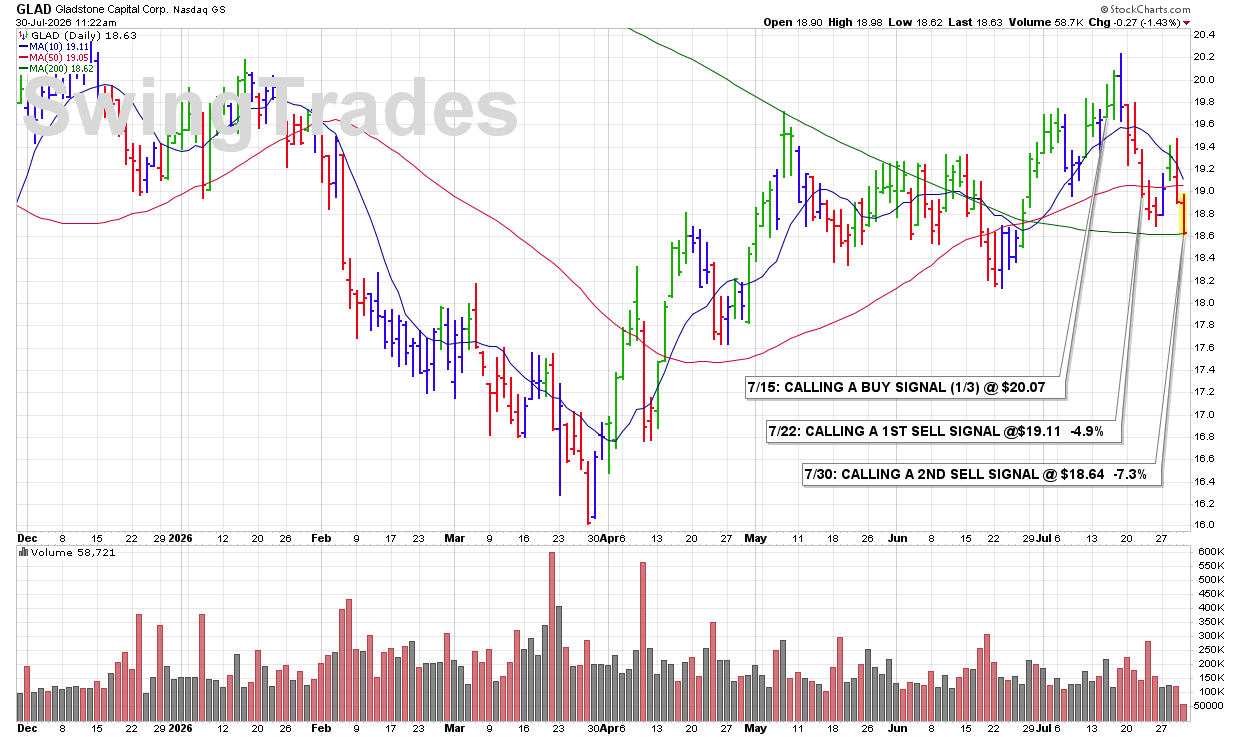
7/30 THU: GLAD – CALLING A 2ND SELL SIGNAL @ $18.64 -7.3%
11:14 AM – Calling a 2ND SELL SIGNAL as shares continue to trade lower on above-average volume and exhibit persistent technical weakness. The continued decline, combined with elevated selling volume, indicates that downside pressure remains in control and warrants further reducing the position.
ULTRA Trader’s Tip: Respect Weakness When Selling Persists
• Continued price deterioration after an initial sell signal confirms that the stock has not stabilized.
• Above-average volume during a decline can indicate sustained institutional distribution.
• Reducing exposure as weakness progresses helps contain losses and preserve capital for stronger opportunities.
CLICK/TAP CHART TO ZOOM
Chart services courtesy of stockcharts.com. Annotations by James Taulman.
10:12 AM – Calling a 1ST SELL SIGNAL as shares are breaking below the 10 DMA this morning. This represents a technical violation of our primary support level and triggers a standard SELL SIGNAL under the ULTRA Trading System.
ULTRA Trader’s Tip: Follow Your Rules Consistently
• A break below the 10 DMA is an early warning that a stock’s momentum may be weakening.
• Consistently following predefined sell rules helps remove emotion from the decision-making process.
• Small, disciplined sells early can help protect capital if additional technical weakness develops.
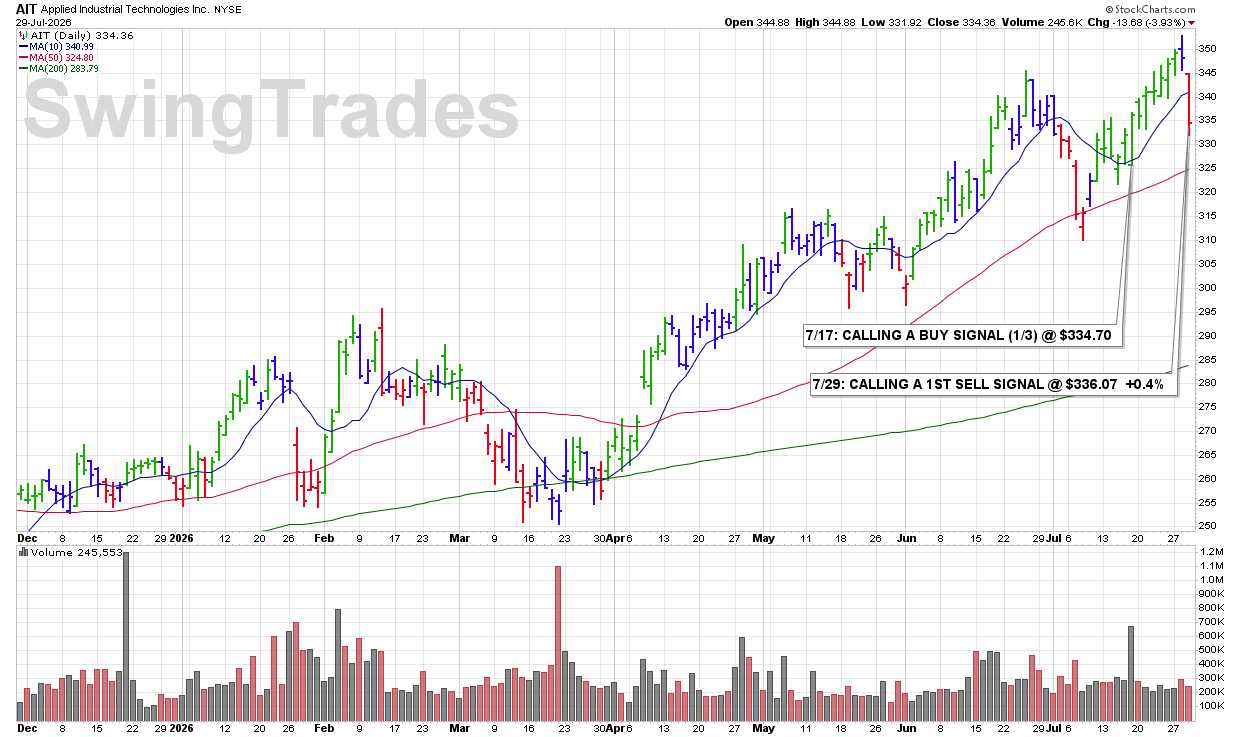
CLICK/TAP CHART TO ZOOM
Chart services courtesy of stockcharts.com. Annotations by James Taulman.
3:32 PM – Shares first broke below the 10 DMA and are now violating the 50 DMA, creating too much technical deterioration to ignore. With multiple technical violations continuing to stack up, I’m calling a 1ST SELL SIGNAL here.
ULTRA Trader’s Tip: Technical Weakness Often Comes in Stages
• Technical deterioration is usually a process rather than a single event.
• Each additional technical sign of deterioration increases the probability that the stock’s trend is changing.
• Respect ongoing technical weakness. It is a SELL SIGNAL.

CLICK/TAP CHART TO ZOOM
Chart services courtesy of stockcharts.com. Annotations by James Taulman.
3:57 PM – Calling an initial BUY SIGNAL in this electric power generation and distribution company just before the close. Yesterday, shares posted bullish, volume-backed gains and closed at a new high. The stock is extending those gains today with volume running approximately 85% above average, providing further confirmation of institutional demand.
ULTRA Trader’s Tip: New Highs With Volume Are Bullish
• A new high close confirms that buyers are willing to pay increasingly higher prices.
• Continued gains on above-average volume suggest the move is being supported by strong demand.
• When bullish action carries into the following session, it provides additional confirmation that the breakout may have staying power.

CLICK/TAP CHART TO ZOOM
Chart services courtesy of stockcharts.com. Annotations by James Taulman.
3:57 PM – Calling an initial BUY SIGNAL on this highly ranked metal products company as shares advance from the 10 DMA and appear poised to close near the session high on more than twice the average daily volume. That combination of strong price action and heavy volume is one of my favorite bullish technical setups. There is admittedly some resistance near ROUND-$340, and that will be an important level to watch going forward.
ULTRA Trader’s Tip: Heavy Volume Adds Conviction
• Advances from the 10 DMA are more meaningful when accompanied by a significant increase in volume.
• Closing near the session high suggests buyers remained in control throughout the trading day.
• Be aware of nearby resistance levels, but a decisive move through them can often lead to another leg higher.

CLICK/TAP CHART TO ZOOM
Chart services courtesy of stockcharts.com. Annotations by James Taulman.
3:53 PM – Shares of this insurance leader are advancing from their 10 DMA with volume running above recent levels. Technically, there is very little overhead supply near these recent price highs, which is constructive bullish action. We consider this a technical BUY SIGNAL.
ULTRA Trader’s Tip: New Highs = Less Resistance
• Stocks trading near new highs typically have less overhead supply from trapped sellers.
• Advances from the 10 DMA accompanied by improving volume are often signs of institutional accumulation.
• Beginning with a 1/3 position allows you to participate while giving the stock an opportunity to confirm its strength before adding more capital.

CLICK/TAP CHART TO ZOOM
Chart services courtesy of stockcharts.com. Annotations by James Taulman.
9:56 AM – Shares are gapping down this morning and clearly breaking below the 10 DMA. This follows a sharp Negative Reversal just a few sessions earlier and confirms further technical deterioration. Calling a 2ND SELL SIGNAL here.
ULTRA Trader’s Tip: Warning Signs Often Arrive in Sequence
• A Negative Reversal can be the first sign that momentum is changing.
• A subsequent break below the 10 DMA confirms that weakness is developing.
• Recognizing the sequence early helps protect gains before the chart deteriorates further.

CLICK/TAP CHART TO ZOOM
Chart services courtesy of stockcharts.com. Annotations by James Taulman.
10:03 AM – Shares are posting new recent lows this morning as the bearish action continues. Calling a 3RD and FINAL SELL SIGNAL here to fully close out coverage of this selection.
ULTRA Trader’s Tip: Continued Weakness Confirms the Trend
• New recent lows indicate that sellers remain in control.
• Repeated technical weakness reduces the probability of a quick recovery.
• A FINAL SELL SIGNAL closes out coverage and allows us to focus on stronger opportunities.

CLICK/TAP CHART TO ZOOM
Chart services courtesy of stockcharts.com. Annotations by James Taulman.
3:42 PM – Shares fell below their 50 DMA today. That is a significant technical violation and triggers a FINAL SELL SIGNAL under our rules.
ULTRA Trader’s Tip: Respect the 50 DMA
• The 50 DMA often serves as a key dividing line between healthy uptrends and weakening charts.
• Stocks that lose this level frequently require time to repair their technical damage.
• Final SELL SIGNALS help preserve capital and prepare you for stronger opportunities ahead.

CLICK/TAP CHART TO ZOOM
Chart services courtesy of stockcharts.com. Annotations by James Taulman.
3:38 PM – After closing below its 10 DMA yesterday, shares now look likely to finish today’s session below the 50 DMA. That additional technical violation triggers a 2ND SELL SIGNAL under our rules.
ULTRA Trader’s Tip: Multiple Technical Violations Increase Risk
• A break of the 10 DMA is often the first warning sign of weakening momentum.
• Losing the 50 DMA shortly afterward shows that sellers are gaining control.
• When technical support levels fail in succession, reducing exposure becomes increasingly prudent.

CLICK/TAP CHART TO ZOOM
Chart services courtesy of stockcharts.com. Annotations by James Taulman.
3:39 PM – Calling a 3RD and FINAL SELL SIGNAL this afternoon as shares continue to sell off with volume running +80% above average. That surge in selling volume confirms the stock’s technical deterioration and supports a complete exit.
ULTRA Trader’s Tip: Heavy Volume Deserves Respect
• Sharp declines on expanding volume often reflect institutional selling.
• Heavy-volume breakdowns typically carry more significance than low-volume pullbacks.
• When price and volume confirm the same bearish message, it usually pays to follow the chart.

CLICK/TAP CHART TO ZOOM
Chart services courtesy of stockcharts.com. Annotations by James Taulman.
10:05 AM – Calling a 1ST SELL SIGNAL here to lock in some solid profits as shares begin to get extended from the 10 DMA. Taking partial profits after a strong advance is consistent with our disciplined trading approach.
ULTRA Trader’s Tip: Selling Into Strength Is a Strategy
• Taking partial profits after a strong run helps reduce risk without abandoning the trade.
• Stocks that become extended from the 10 DMA often pull back to reset.
• Scaling out allows you to protect gains while still participating if the uptrend continues.

CLICK/TAP CHART TO ZOOM
Chart services courtesy of stockcharts.com. Annotations by James Taulman.
Latest Chart Update: TRP
9:10 PM – We are currently reporting on this stock as an active holding and continue to monitor the stock closely for any technical SELL SIGNALS.
The focus always remains on price/volume action around key support levels, including the 10 DMA, 50 DMA, and any nearby trendline or ROUND-$ support.
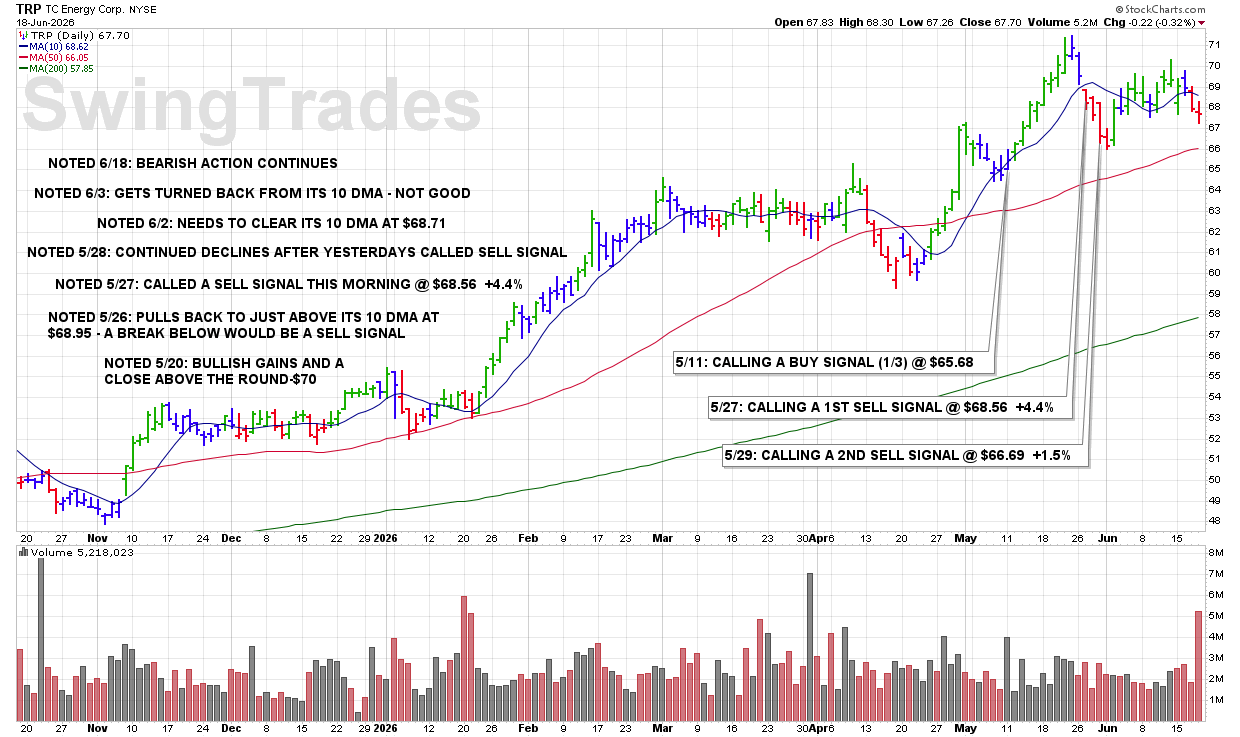
CLICK/TAP CHART TO ZOOM
Chart services courtesy of stockcharts.com. Annotations by James Taulman.
Latest Chart Update: CLH
9:35 PM – We are currently reporting on this stock as an active holding and continue to monitor the stock closely for any technical SELL SIGNALS.
The focus always remains on price/volume action around key support levels, including the 10 DMA, 50 DMA, and any nearby trendline or ROUND-$ support.
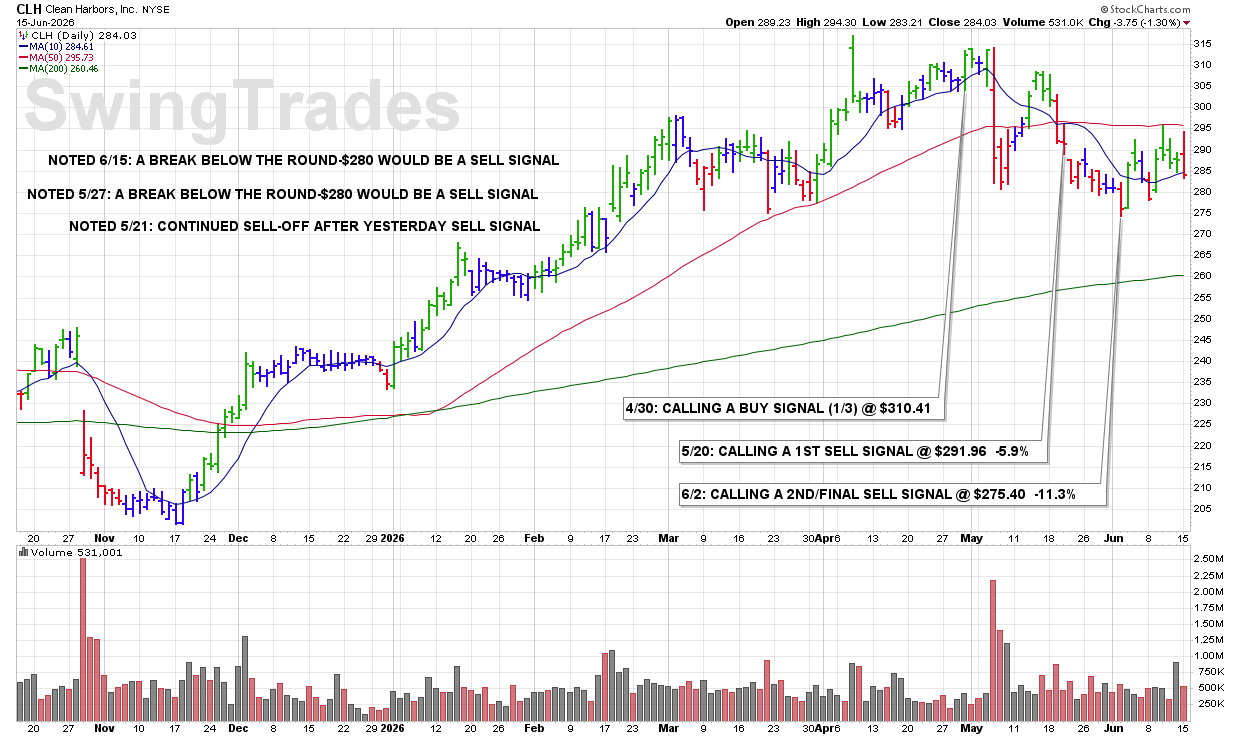
CLICK/TAP CHART TO ZOOM
Chart services courtesy of stockcharts.com. Annotations by James Taulman.
Latest Chart Update: MYE
9:15 PM -We are currently reporting on this stock as an active holding and continue to monitor the stock closely for any technical SELL SIGNALS.
The focus always remains on price/volume action around key support levels, including the 10 DMA, 50 DMA, and any nearby trendline or ROUND-$ support.
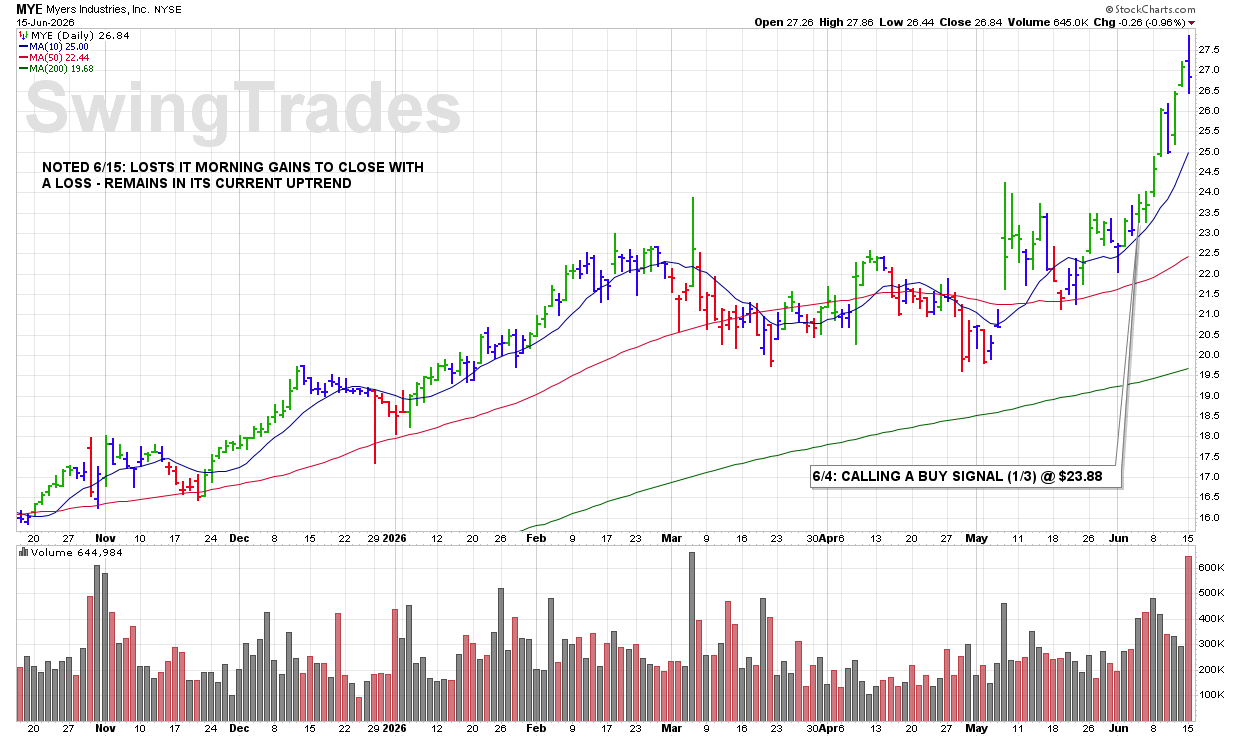
CLICK/TAP CHART TO ZOOM
Chart services courtesy of stockcharts.com. Annotations by James Taulman.
Latest Chart Update: BY
9:10 PM -We are currently reporting on this stock as an active holding and continue to monitor the stock closely for any technical SELL SIGNALS.
The focus always remains on price/volume action around key support levels, including the 10 DMA, 50 DMA, and any nearby trendline or ROUND-$ support.
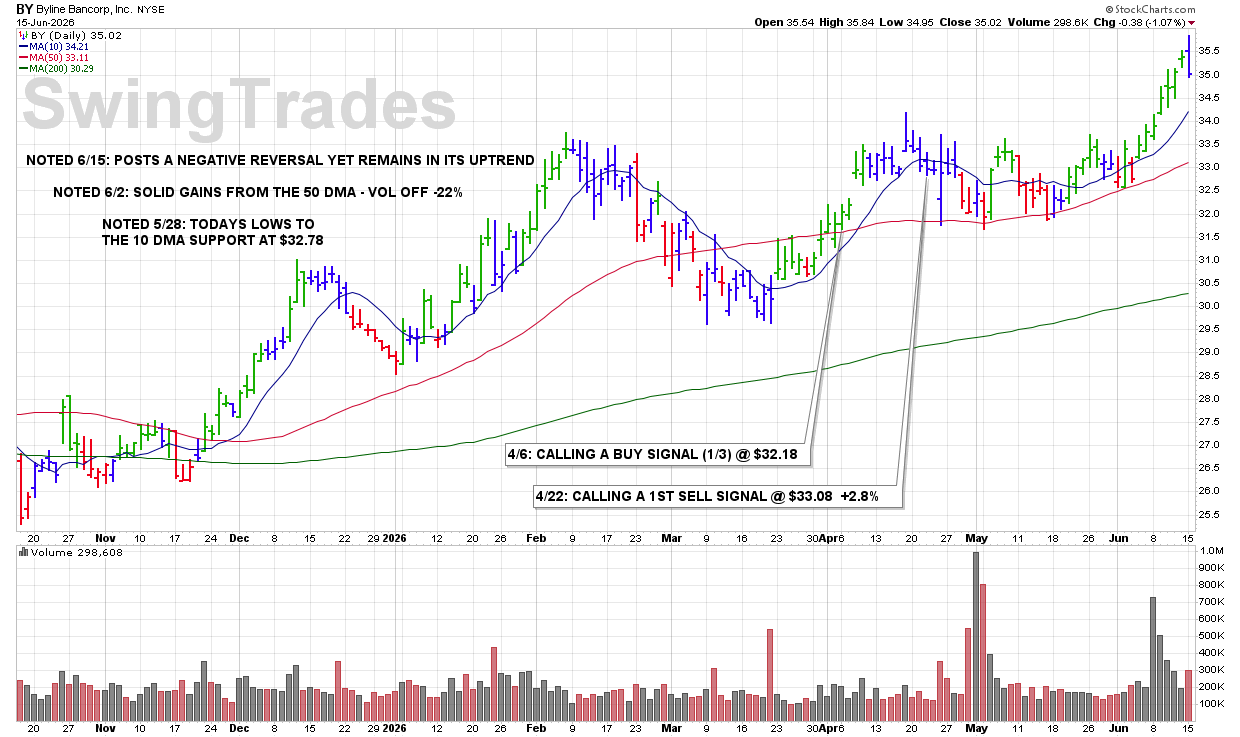
CLICK/TAP CHART TO ZOOM
Chart services courtesy of stockcharts.com. Annotations by James Taulman.
3:39 PM – The stock has been turned back from its 10 DMA and appears likely to post a new recent low close. That continued weakness triggers a 3RD and FINAL SELL SIGNAL.
ULTRA Trader’s Tip: Lower Lows Confirm Weakness
• Failed rallies into the 10 DMA often signal sellers remain in control.
• New low closes suggest downside momentum is still building.
• Final SELL SIGNALS are designed to remove capital from stocks that are no longer acting right.

CLICK/TAP CHART TO ZOOM
Chart services courtesy of stockcharts.com. Annotations by James Taulman.
3:38 PM – The stock is clearly breaking below the 10 DMA. After recent signs of weakening momentum, a downtrend may now be developing. I’m calling a 3RD and FINAL SELL SIGNAL here this afternoon.
ULTRA Trader’s Tip: Trends Deserve Respect
• Strong stocks typically hold above their 10 DMA during sustained advances.
• Repeated breaks of support often signal a shift from accumulation to distribution.
• The goal is to capture the bulk of a move, not hold through the entire reversal.

CLICK/TAP CHART TO ZOOM
Chart services courtesy of stockcharts.com. Annotations by James Taulman.
3:50 PM – Calling an early BUY SIGNAL on MYE as we head into today’s close. A move above $24 would provide stronger confirmation; however, today’s price action, combined with nearly double the stock’s normal volume, is showing clear signs of strength. A 1/3 position entry here also offers a price that is more closely aligned with the 10 DMA.
ULTRA Trader’s Tip: Early Entries vs. Confirmed Breakouts
• Early entries can offer a better risk/reward profile by keeping purchases closer to support.
• Breakouts above resistance provide stronger confirmation but often come at a higher price.
• Volume is a key ingredient. Increased volume suggests institutional demand may be entering the stock.

CLICK/TAP CHART TO ZOOM
Chart services courtesy of stockcharts.com. Annotations by James Taulman.
Latest Chart Update: JCI
9:20 PM – We are currently reporting on this stock as an active holding and continue to monitor the stock closely for any technical SELL SIGNALS.
The focus always remains on price/volume action around key support levels, including the 10 DMA, 50 DMA, and any nearby trendline or ROUND-$ support.
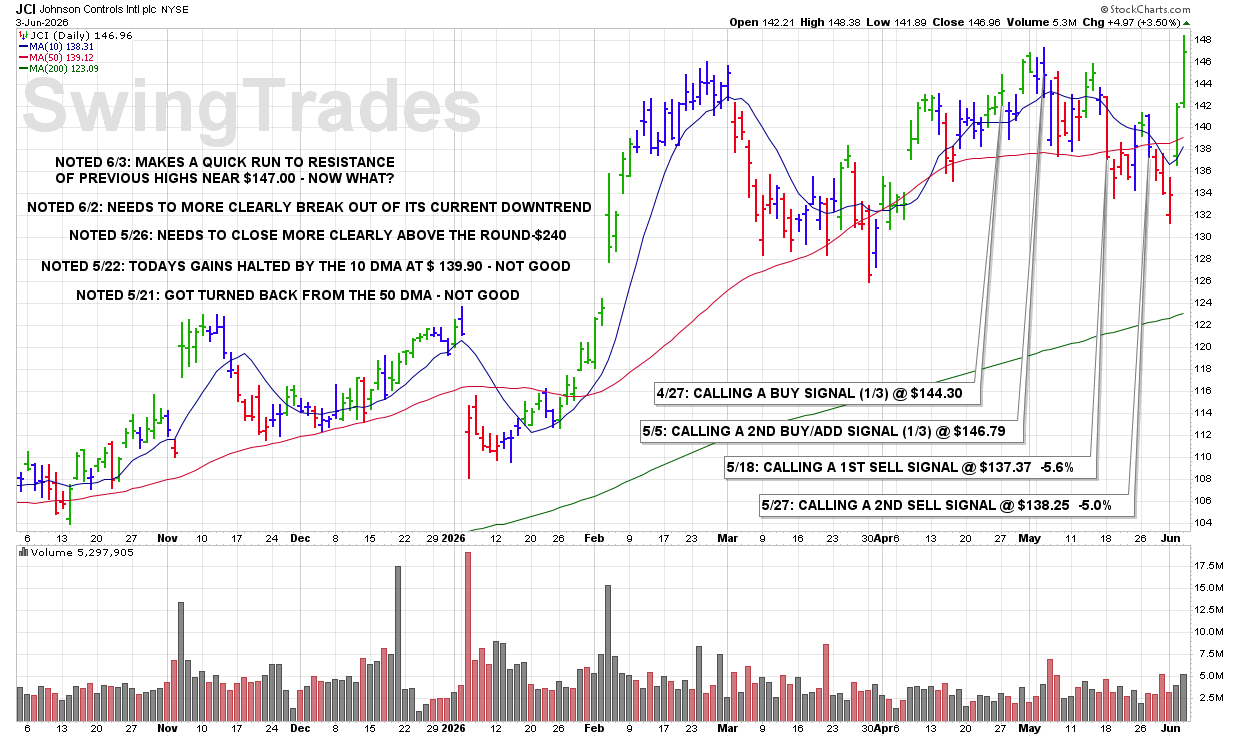
CLICK/TAP CHART TO ZOOM
Chart services courtesy of stockcharts.com. Annotations by James Taulman.
Latest Chart Update: NSIT
9:15 PM – We are currently reporting on this stock as an active holding and continue to monitor the stock closely for any technical SELL SIGNALS.
The focus always remains on price/volume action around key support levels, including the 10 DMA, 50 DMA, and any nearby trendline or ROUND-$ support.
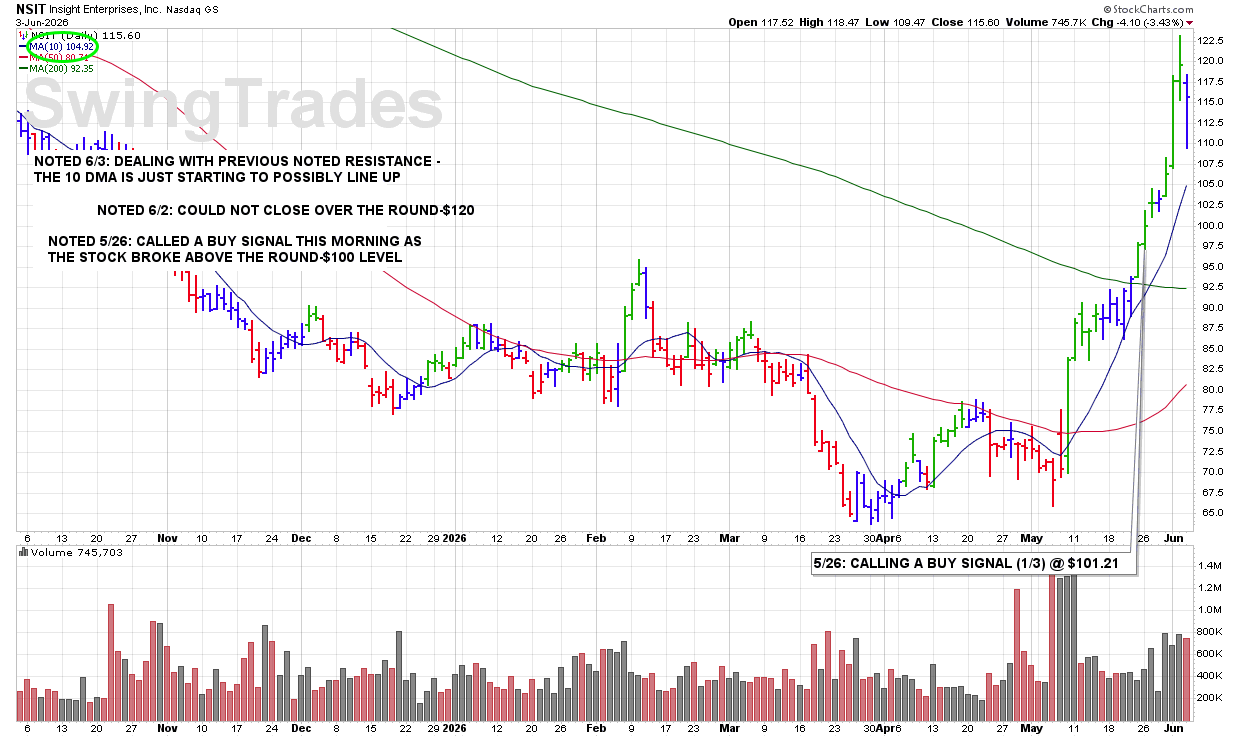
CLICK/TAP CHART TO ZOOM
Chart services courtesy of stockcharts.com. Annotations by James Taulman.
Latest Chart Update: VOD
9:05 PM – We are currently reporting on this stock as an active holding and continue to monitor the stock closely for any technical SELL SIGNALS.
The focus always remains on price/volume action around key support levels, including the 10 DMA, 50 DMA, and any nearby trendline or ROUND-$ support.

CLICK/TAP CHART TO ZOOM
Chart services courtesy of stockcharts.com. Annotations by James Taulman.
Latest Chart Update: TRP
9:00 PM – We are currently reporting on this stock as an active holding and continue to monitor the stock closely for any technical SELL SIGNALS.
The focus always remains on price/volume action around key support levels, including the 10 DMA, 50 DMA, and any nearby trendline or ROUND-$ support.

CLICK/TAP CHART TO ZOOM
Chart services courtesy of stockcharts.com. Annotations by James Taulman.
Latest Chart Update: TRP
10:45 PM – We are currently reporting on this stock as an active holding and continue to monitor the stock closely for any technical SELL SIGNALS.
The focus always remains on price/volume action around key support levels, including the 10 DMA, 50 DMA, and any nearby trendline or ROUND-$ support.

CLICK/TAP CHART TO ZOOM
Chart services courtesy of stockcharts.com. Annotations by James Taulman.
Latest Chart Update: TFSL
10:40 PM – We are currently reporting on this stock as an active holding and continue to monitor the stock closely for any technical SELL SIGNALS.
The focus always remains on price/volume action around key support levels, including the 10 DMA, 50 DMA, and any nearby trendline or ROUND-$ support.
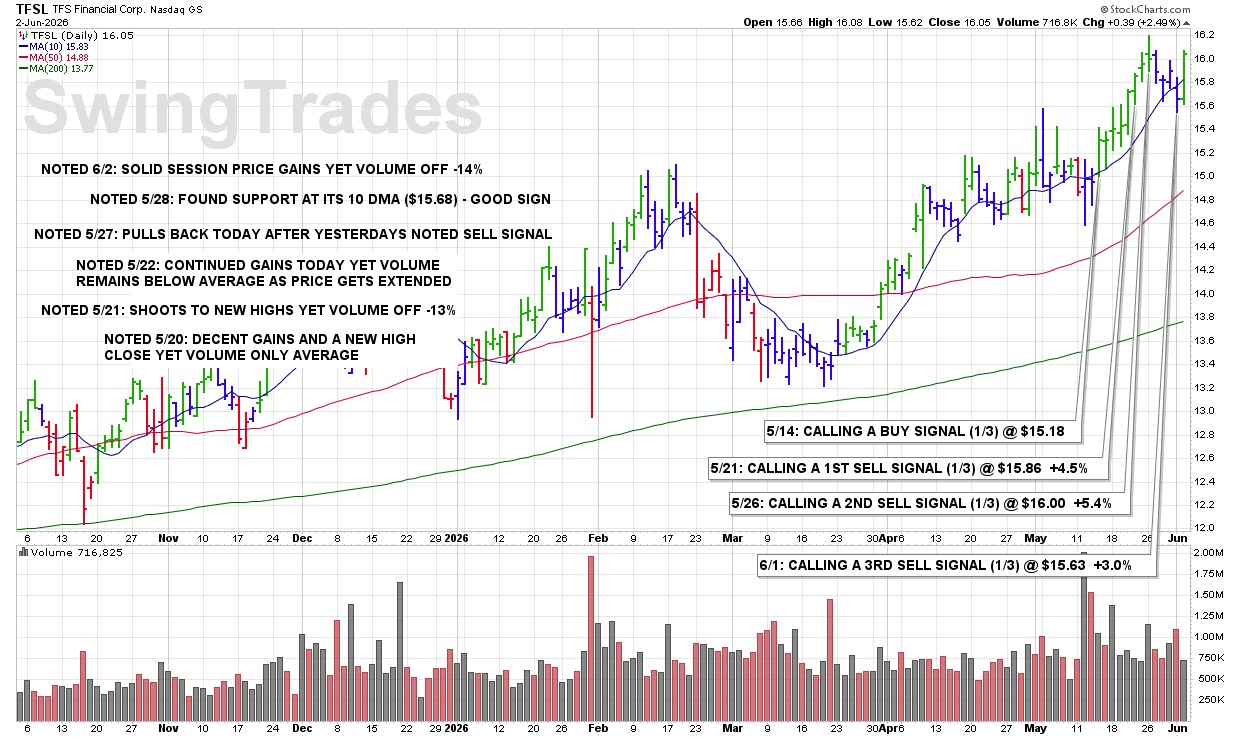
CLICK/TAP CHART TO ZOOM
Chart services courtesy of stockcharts.com. Annotations by James Taulman.
Latest Chart Update: NSIT
10:30 PM – We are currently reporting on this stock as an active holding and continue to monitor the stock closely for any technical SELL SIGNALS.
The focus always remains on price/volume action around key support levels, including the 10 DMA, 50 DMA, and any nearby trendline or ROUND-$ support.
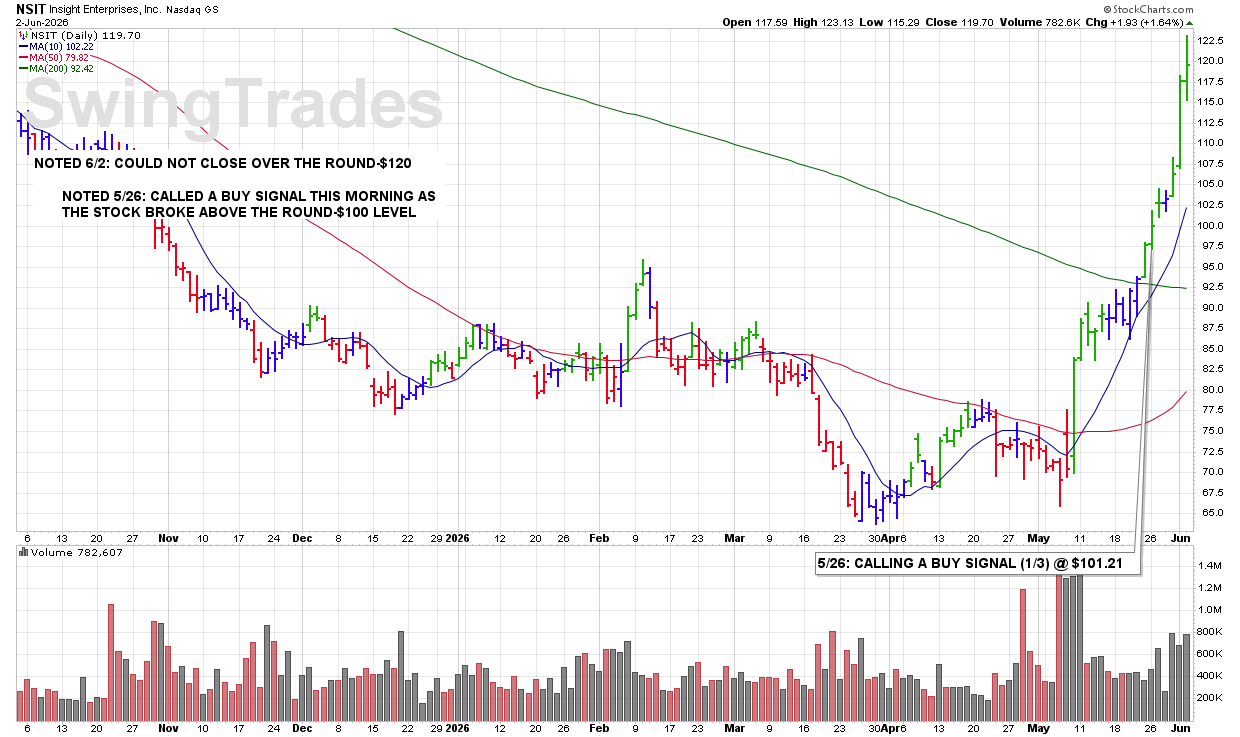
CLICK/TAP CHART TO ZOOM
Chart services courtesy of stockcharts.com. Annotations by James Taulman.
Latest Chart Update: MGA
10:25 PM – We are currently reporting on this stock as an active holding and continue to monitor the stock closely for any technical SELL SIGNALS.
The focus always remains on price/volume action around key support levels, including the 10 DMA, 50 DMA, and any nearby trendline or ROUND-$ support.
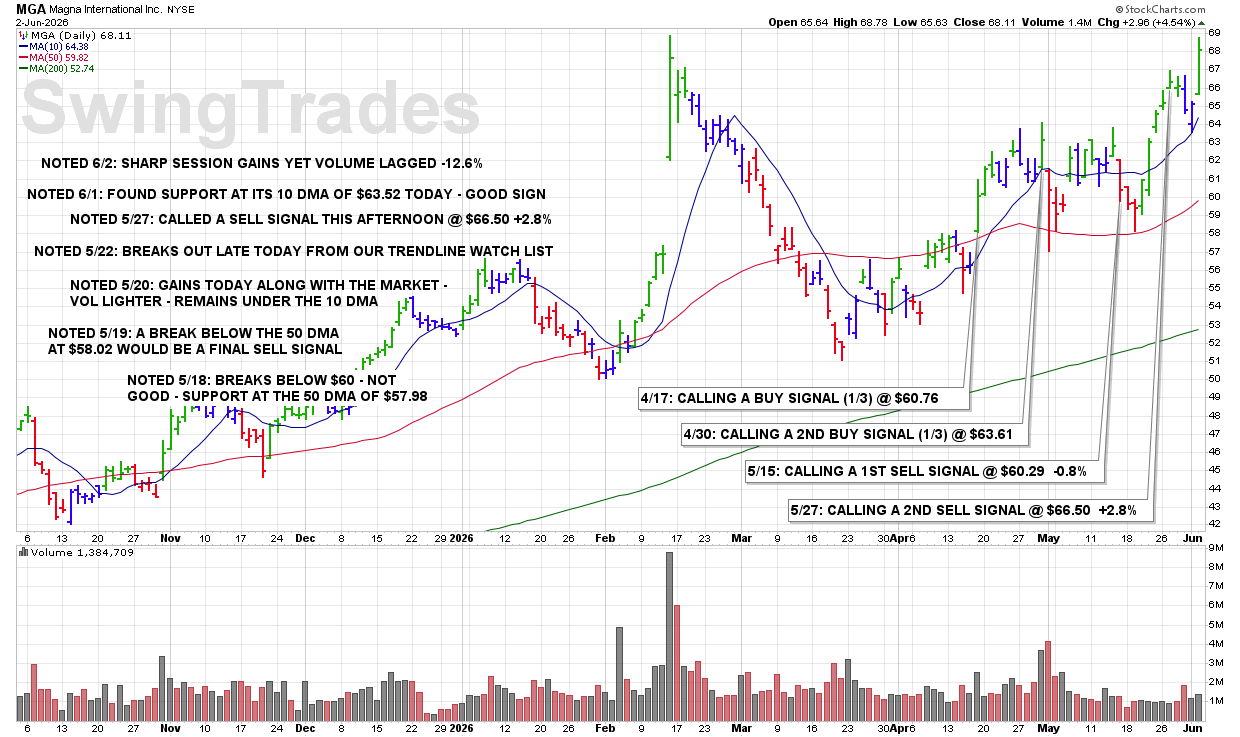
CLICK/TAP CHART TO ZOOM
Chart services courtesy of stockcharts.com. Annotations by James Taulman.
Latest Chart Update: JCI
10:20 PM – We are currently reporting on this stock as an active holding and continue to monitor the stock closely for any technical SELL SIGNALS.
The focus always remains on price/volume action around key support levels, including the 10 DMA, 50 DMA, and any nearby trendline or ROUND-$ support.

CLICK/TAP CHART TO ZOOM
Chart services courtesy of stockcharts.com. Annotations by James Taulman.
Latest Chart Update: JCI
10:15 PM – We are currently reporting on this stock as an active holding and continue to monitor the stock closely for any technical SELL SIGNALS.
The focus always remains on price/volume action around key support levels, including the 10 DMA, 50 DMA, and any nearby trendline or ROUND-$ support.
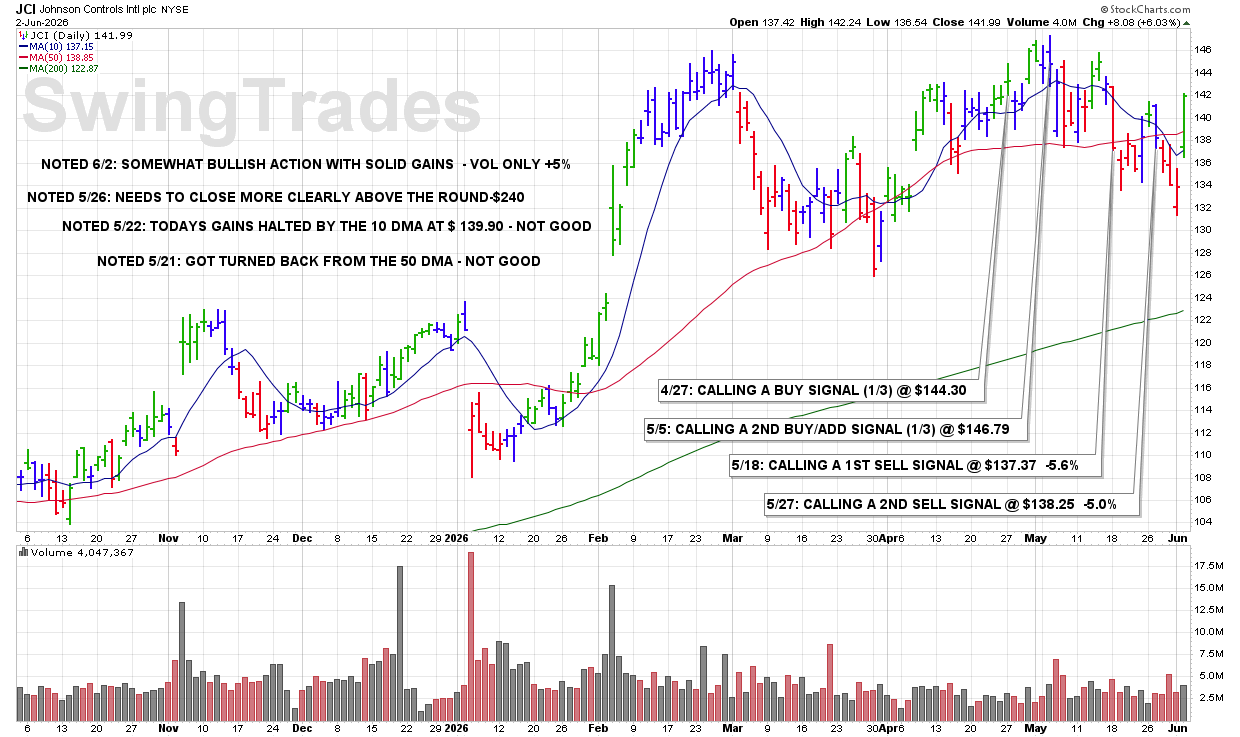
CLICK/TAP CHART TO ZOOM
Chart services courtesy of stockcharts.com. Annotations by James Taulman.
Latest Chart Update: IBP
10:10 PM – We are currently reporting on this stock as an active holding and continue to monitor the stock closely for any technical SELL SIGNALS.
The focus always remains on price/volume action around key support levels, including the 10 DMA, 50 DMA, and any nearby trendline or ROUND-$ support.
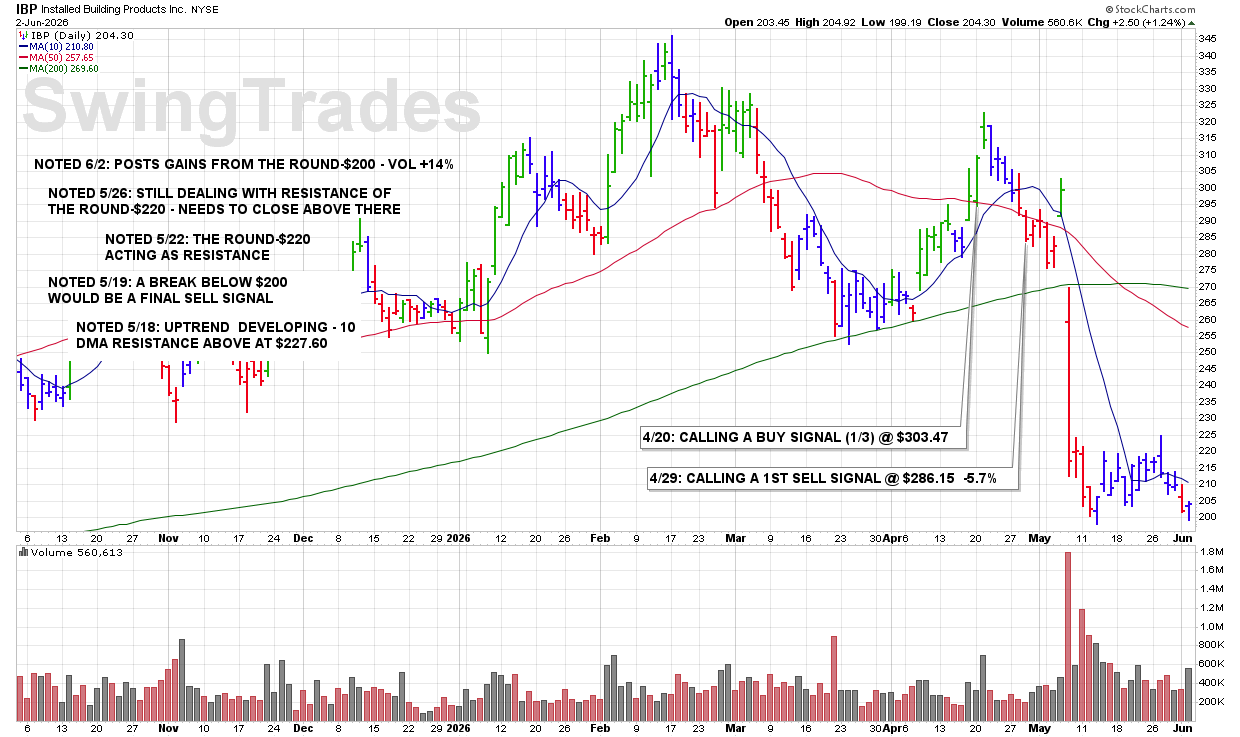
CLICK/TAP CHART TO ZOOM
Chart services courtesy of stockcharts.com. Annotations by James Taulman.
Latest Chart Update: BY
10:05 PM – We are currently reporting on this stock as an active holding and continue to monitor the stock closely for any technical SELL SIGNALS.
The focus always remains on price/volume action around key support levels, including the 10 DMA, 50 DMA, and any nearby trendline or ROUND-$ support.
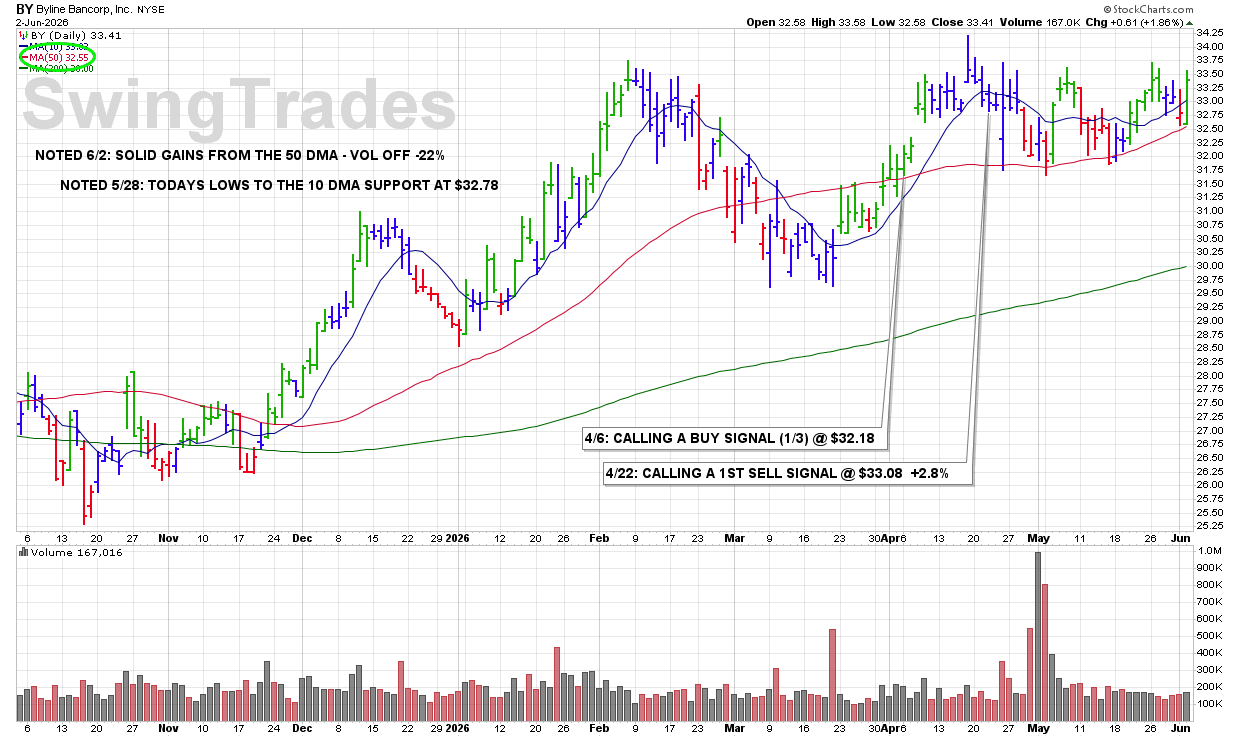
CLICK/TAP CHART TO ZOOM
Chart services courtesy of stockcharts.com. Annotations by James Taulman.
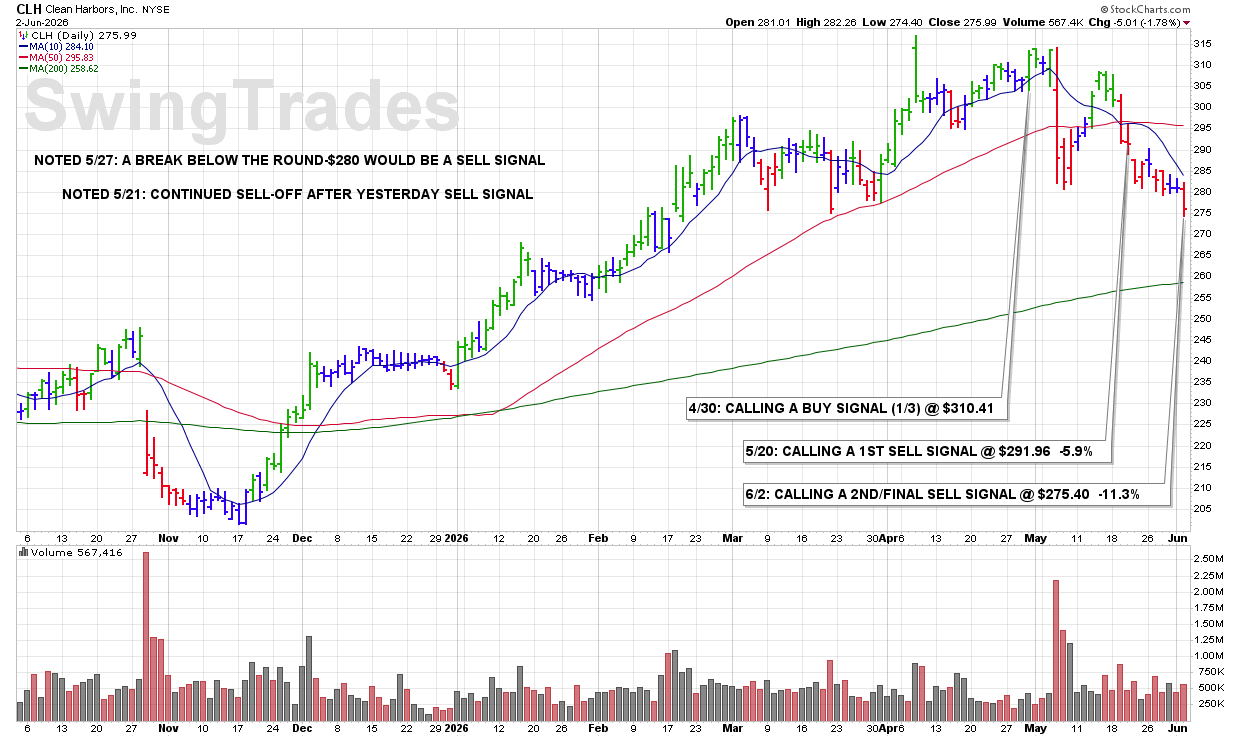
3:26 PM – Shares are clearly breaking below the noted support level at ROUND-$280. While this is only the 2ND SELL SIGNAL, the magnitude of the technical deterioration warrants a FINAL SELL SIGNAL.
ULTRA Trader’s Tip: Price Levels Matter
• Round-number levels often act as important support and resistance zones.
• When a stock decisively breaks a widely watched support level, additional selling can follow.
• The goal is not to be right on every trade, but to keep losses controlled when the chart changes character.
CLICK/TAP CHART TO ZOOM
Chart services courtesy of stockcharts.com. Annotations by James Taulman.
Latest Chart Update: MGA
9:35 PM – We are currently reporting on this stock as an active holding and continue to monitor the stock closely for any technical SELL SIGNALS.
The focus always remains on price/volume action around key support levels, including the 10 DMA, 50 DMA, and any nearby trendline or ROUND-$ support.

CLICK/TAP CHART TO ZOOM
Chart services courtesy of stockcharts.com. Annotations by James Taulman.
3:27 PM – Shares are selling off on above-average volume and appear likely to close below their 10 DMA. That combination signals weakening momentum and triggers a 3RD and FINAL SELL SIGNAL on this profitable swing trade.
ULTRA Trader’s Tip: Finish the Trade the Same Way You Started It
• The 10 DMA is the heartbeat of our trading system.
• Higher-volume selling often confirms a shift in momentum.
• Following sell rules consistently is what turns individual trades into long-term performance.

CLICK/TAP CHART TO ZOOM
Chart services courtesy of stockcharts.com. Annotations by James Taulman.
2:45 PM – Shares are selling off with an increase in volume following the recent loss of the 10 DMA. With no meaningful support nearby until approximately ROUND-$65 and the 50 MDA, I am calling a 2ND SELL SIGNAL here before the close.
ULTRA Trader’s Tip: Respect Volume on the Way Down
• Selling pressure accompanied by higher volume deserves attention.
• Once the 10 DMA is lost, downside momentum can accelerate quickly.
• Reducing exposure as support levels disappear helps preserve gains and limit risk.

CLICK/TAP CHART TO ZOOM
Chart services courtesy of stockcharts.com. Annotations by James Taulman.
Latest Chart Update: BY
9:20 PM – We are currently reporting on this stock as an active holding and continue to monitor the stock closely for any technical SELL SIGNALS.
The focus always remains on price/volume action around key support levels, including the 10 DMA, 50 DMA, and any nearby trendline or ROUND-$ support.
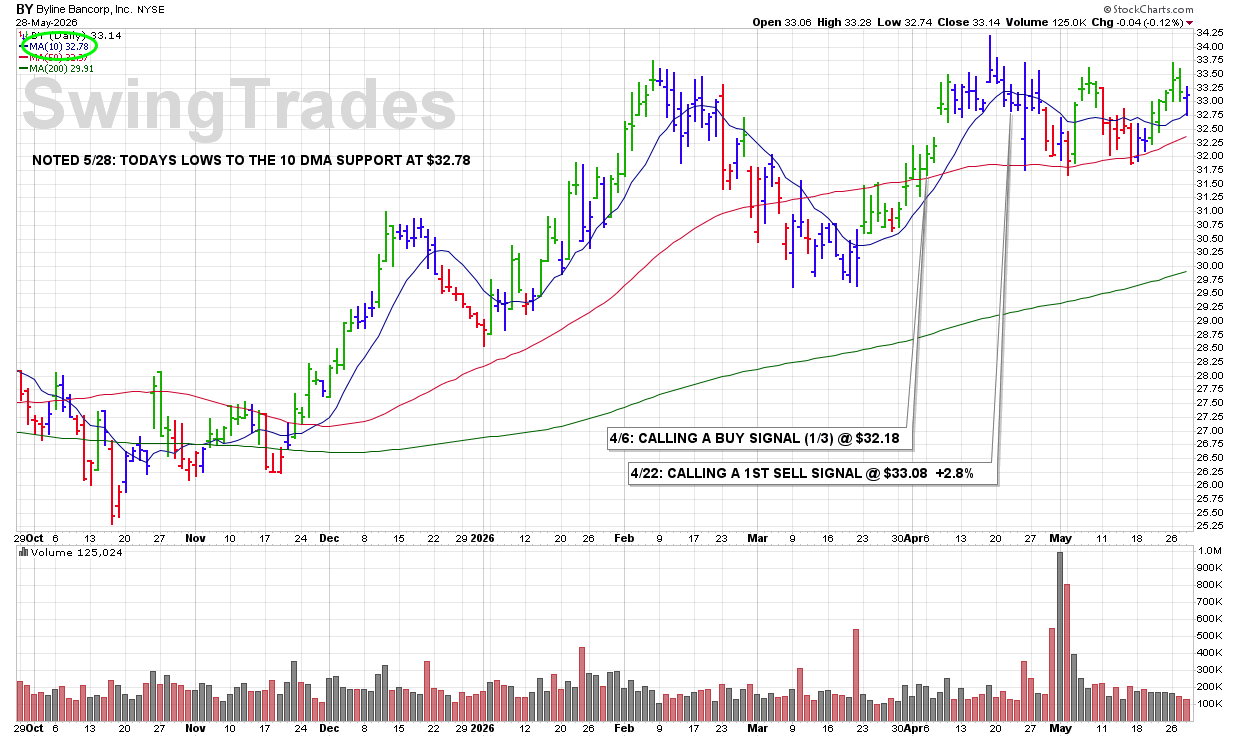
CLICK/TAP CHART TO ZOOM
Chart services courtesy of stockcharts.com. Annotations by James Taulman.
Latest Chart Update: FIVE
9:15 PM – We are currently reporting on this stock as an active holding and continue to monitor the stock closely for any technical SELL SIGNALS.
The focus always remains on price/volume action around key support levels, including the 10 DMA, 50 DMA, and any nearby trendline or ROUND-$ support.

CLICK/TAP CHART TO ZOOM
Chart services courtesy of stockcharts.com. Annotations by James Taulman.
Latest Chart Update: TFSL
9:10 PM – We are currently reporting on this stock as an active holding and continue to monitor the stock closely for any technical SELL SIGNALS.
The focus always remains on price/volume action around key support levels, including the 10 DMA, 50 DMA, and any nearby trendline or ROUND-$ support.

CLICK/TAP CHART TO ZOOM
Chart services courtesy of stockcharts.com. Annotations by James Taulman.
Latest Chart Update: TRP
9:05 PM – We are currently reporting on this stock as an active holding and continue to monitor the stock closely for any technical SELL SIGNALS.
The focus always remains on price/volume action around key support levels, including the 10 DMA, 50 DMA, and any nearby trendline or ROUND-$ support.

CLICK/TAP CHART TO ZOOM
Chart services courtesy of stockcharts.com. Annotations by James Taulman.
Latest Chart Update: VOD
9:00 PM – We are currently reporting on this stock as an active holding and continue to monitor the stock closely for any technical SELL SIGNALS.
The focus always remains on price/volume action around key support levels, including the 10 DMA, 50 DMA, and any nearby trendline or ROUND-$ support.
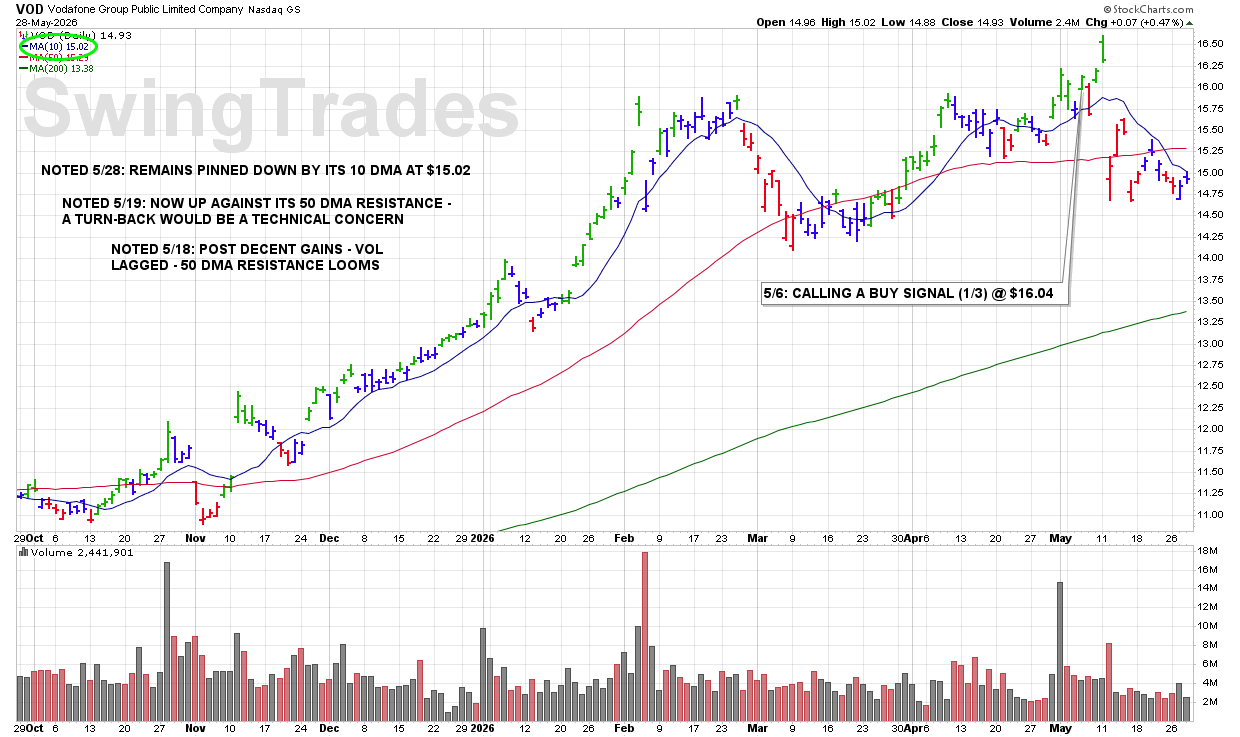
CLICK/TAP CHART TO ZOOM
Chart services courtesy of stockcharts.com. Annotations by James Taulman.
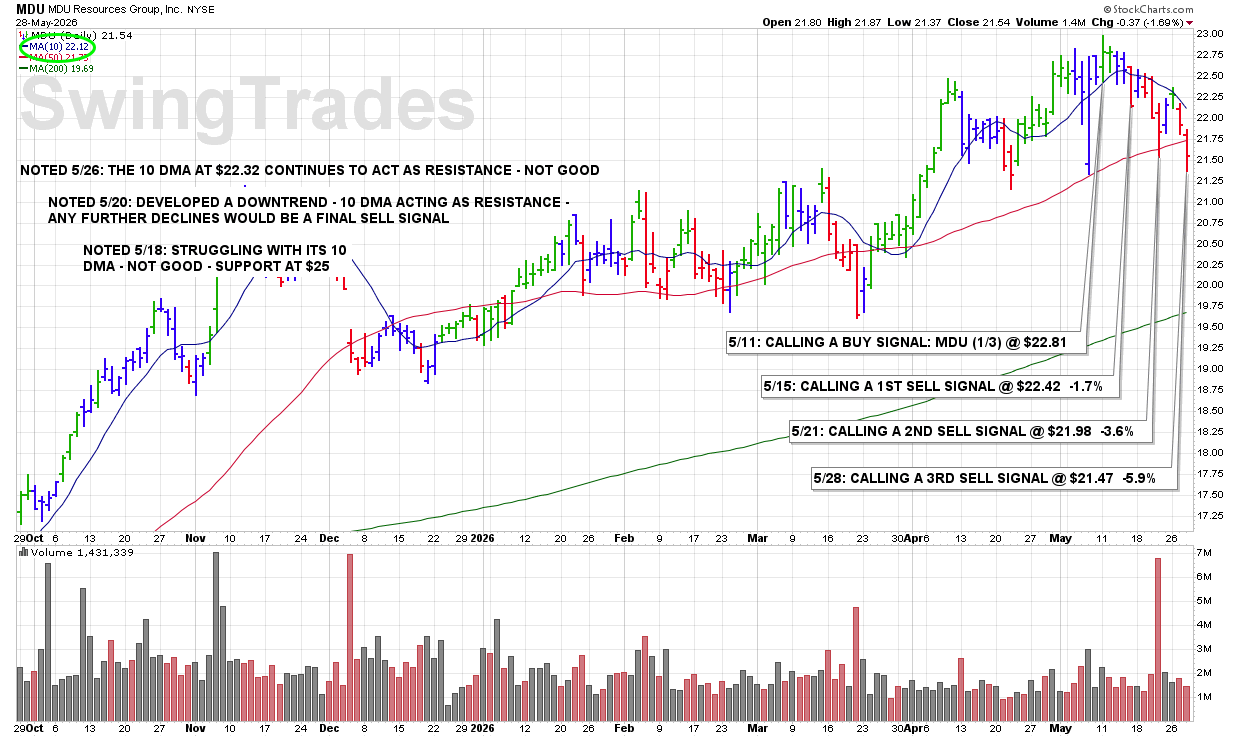
3:27 PM – The stock is breaking below the 50 DMA. That is a significant technical violation and triggers a 3RD and FINAL SELL SIGNAL under our rules.
ULTRA Trader’s Tip: The 50 DMA Is Major Support
• The 50 DMA often serves as an important institutional support level.
• Breaks below this line signal increasing intermediate-term weakness.
• Final exits help preserve capital when a stock’s technical character changes.
CLICK/TAP CHART TO ZOOM
Chart services courtesy of stockcharts.com. Annotations by James Taulman.
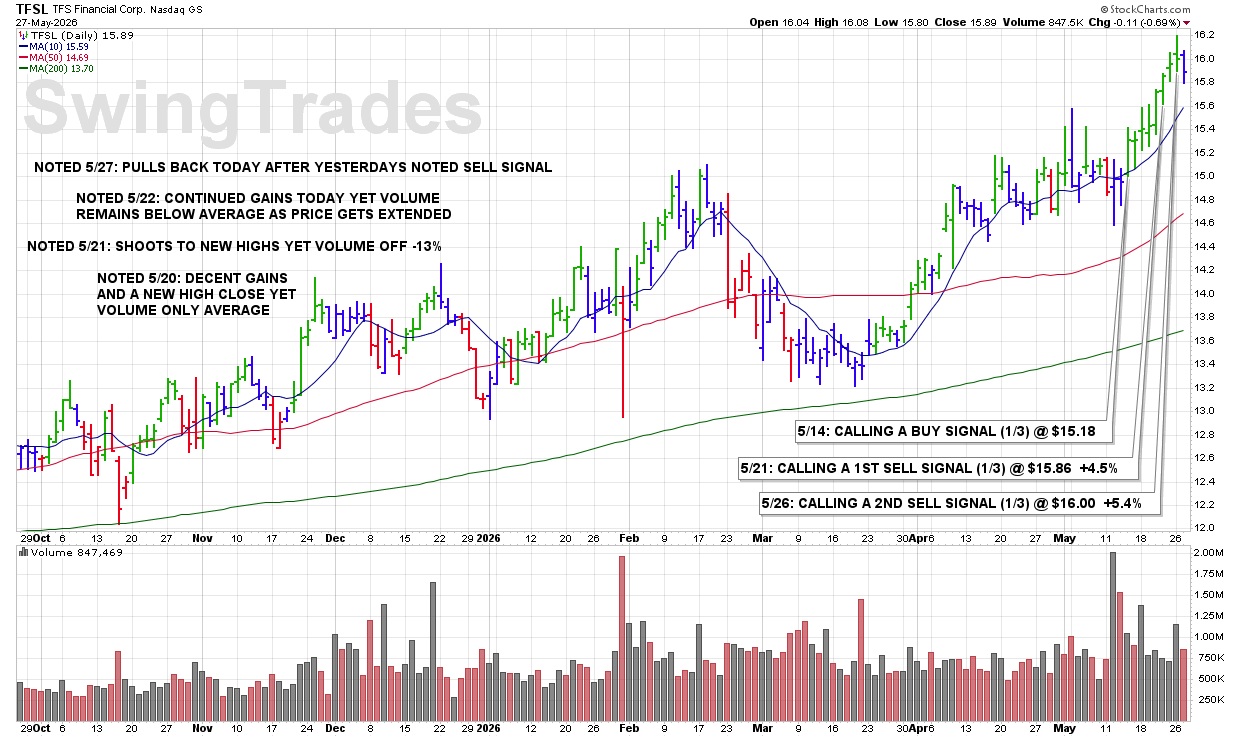
Latest Chart Update: TFSL
8:45 PM – We are currently reporting on this stock as an active holding and continue to monitor the stock closely for any technical SELL SIGNALS.
The focus always remains on price/volume action around key support levels, including the 10 DMA, 50 DMA, and any nearby trendline or ROUND-$ support.
CLICK/TAP CHART TO ZOOM
Chart services courtesy of stockcharts.com. Annotations by James Taulman.
Latest Chart Update: TRP
8:40 PM – We are currently reporting on this stock as an active holding and continue to monitor the stock closely for any technical SELL SIGNALS.
The focus always remains on price/volume action around key support levels, including the 10 DMA, 50 DMA, and any nearby trendline or ROUND-$ support.

CLICK/TAP CHART TO ZOOM
Chart services courtesy of stockcharts.com. Annotations by James Taulman.
Latest Chart Update: CLH
8:35 PM – We are currently reporting on this stock as an active holding and continue to monitor the stock closely for any technical SELL SIGNALS.
The focus always remains on price/volume action around key support levels, including the 10 DMA, 50 DMA, and any nearby trendline or ROUND-$ support.

CLICK/TAP CHART TO ZOOM
Chart services courtesy of stockcharts.com. Annotations by James Taulman.
Latest Chart Update: MGA
8:30 PM – We are currently reporting on this stock as an active holding and continue to monitor the stock closely for any technical SELL SIGNALS.
The focus always remains on price/volume action around key support levels, including the 10 DMA, 50 DMA, and any nearby trendline or ROUND-$ support.

CLICK/TAP CHART TO ZOOM
Chart services courtesy of stockcharts.com. Annotations by James Taulman.
3:38 PM – Calling a 2ND SELL SIGNAL this afternoon as the stock continues trading higher and becomes extended from its 10 DMA, while volume remains well below average. The lack of strong volume support raises the risk of a pullback.
ULTRA Trader’s Tip: Weak Volume Behind Gains Is a Warning
• Strong advances are more reliable when supported by strong volume.
• Stocks extended too far above the 10 DMA often become vulnerable to pullbacks.
• Taking partial profits into weak-volume strength helps protect gains.

CLICK/TAP CHART TO ZOOM
Chart services courtesy of stockcharts.com. Annotations by James Taulman.
3:36 PM – Calling a 2ND SELL SIGNAL here as the stock is essentially being turned back from its 10 DMA this afternoon and appears likely to close below the 50 DMA. That combination signals continued technical deterioration.
ULTRA Trader’s Tip: Failed Rebounds Are Bearish
• Stocks rejected at the 10 DMA often struggle to regain momentum.
• A close below the 50 DMA confirms increasing technical weakness.
• Multiple failed recovery attempts usually signal sellers remain in control.

CLICK/TAP CHART TO ZOOM
Chart services courtesy of stockcharts.com. Annotations by James Taulman.
3:34 PM – This stock is triggering a SELL SIGNAL as it breaks below the 10 DMA, ROUND-$135, and appears likely to close below the 200 DMA. Those stacked technical violations signal meaningful technical deterioration.
ULTRA Trader’s Tip: Multiple Breaks Increase Risk
• Breaks of the 10 DMA often signal weakening short-term momentum.
• Losses of key price levels like ROUND-$135 add to the bearish picture.
• A close below the 200 DMA signals institutions may be stepping away from the stock.

CLICK/TAP CHART TO ZOOM
Chart services courtesy of stockcharts.com. Annotations by James Taulman.
9:41 AM – Calling a 1ST SELL SIGNAL this morning as shares are breaking below the 10 DMA. That technical violation signals weakening short-term momentum.
ULTRA Trader’s Tip: The First Break Is the First Warning
• Breaks below the 10 DMA are early signs momentum may be shifting.
• Acting on initial SELL SIGNALS helps protect gains before weakness expands.
• Good risk management is about responding early, not reacting late.

CLICK/TAP CHART TO ZOOM
Chart services courtesy of stockcharts.com. Annotations by James Taulman.
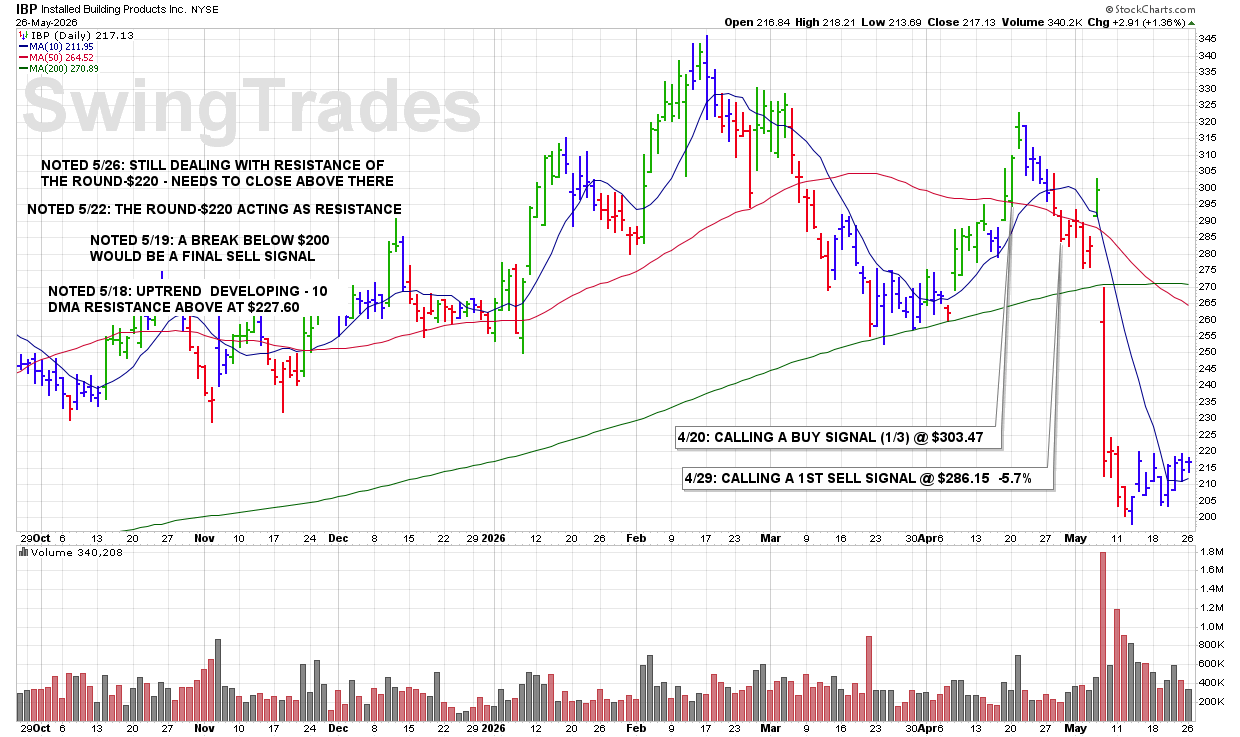
Latest Chart Update: IBP
10:20 PM – We are currently reporting on this stock as an active holding and continue to monitor the stock closely for any technical SELL SIGNALS.
The focus always remains on price/volume action around key support levels, including the 10 DMA, 50 DMA, and any nearby trendline or ROUND-$ support.
CLICK/TAP CHART TO ZOOM
Chart services courtesy of stockcharts.com. Annotations by James Taulman.
Latest Chart Update: JCI
10:15 PM – We are currently reporting on this stock as an active holding and continue to monitor the stock closely for any technical SELL SIGNALS.
The focus always remains on price/volume action around key support levels, including the 10 DMA, 50 DMA, and any nearby trendline or ROUND-$ support.

CLICK/TAP CHART TO ZOOM
Chart services courtesy of stockcharts.com. Annotations by James Taulman.
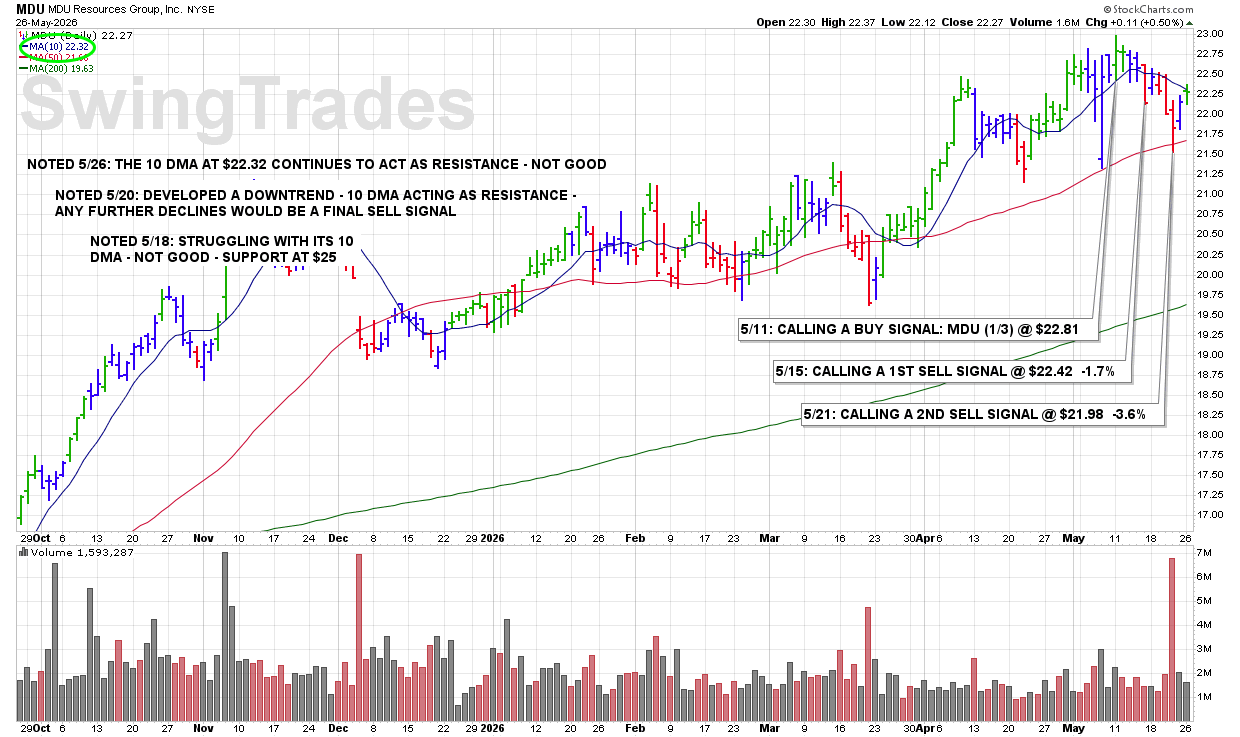
Latest Chart Update: MDU
10:10 PM – We are currently reporting on this stock as an active holding and continue to monitor the stock closely for any technical SELL SIGNALS.
The focus always remains on price/volume action around key support levels, including the 10 DMA, 50 DMA, and any nearby trendline or ROUND-$ support.
CLICK/TAP CHART TO ZOOM
Chart services courtesy of stockcharts.com. Annotations by James Taulman.
Latest Chart Update: NSIT
10:05 PM – We are currently reporting on this stock as an active holding and continue to monitor the stock closely for any technical SELL SIGNALS.
The focus always remains on price/volume action around key support levels, including the 10 DMA, 50 DMA, and any nearby trendline or ROUND-$ support.
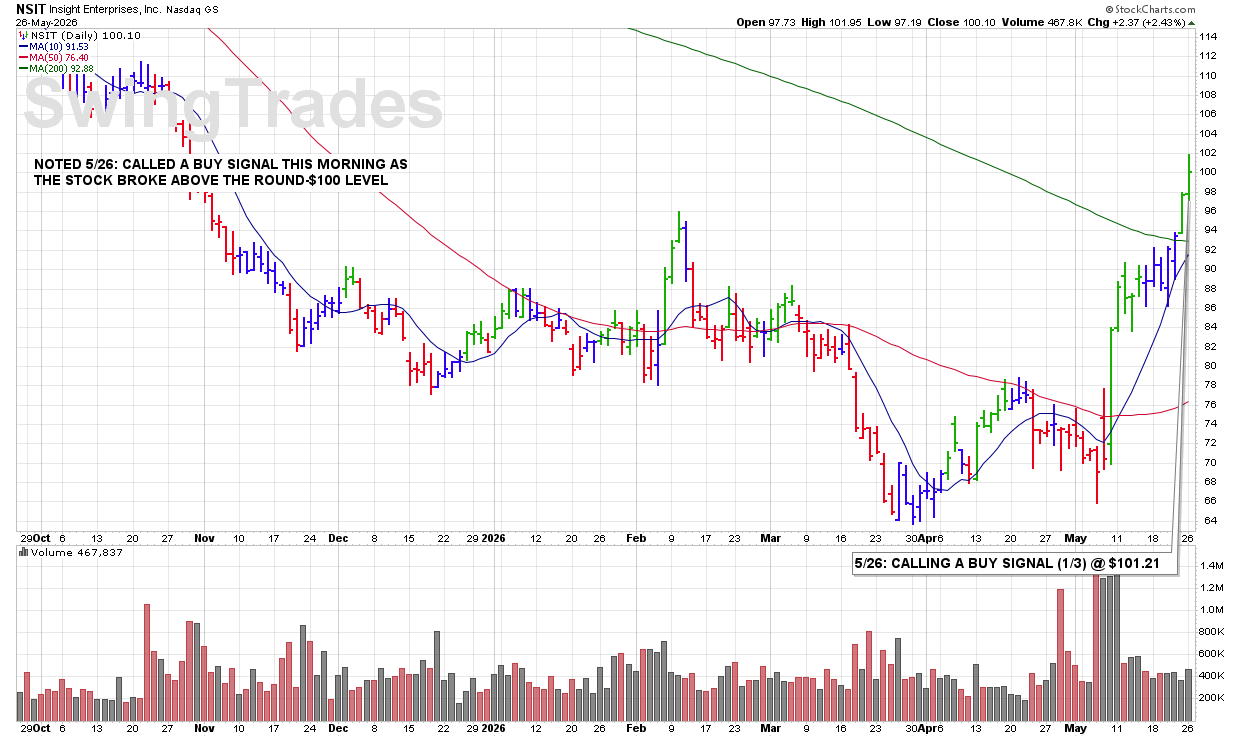
CLICK/TAP CHART TO ZOOM
Chart services courtesy of stockcharts.com. Annotations by James Taulman.
Latest Chart Update: TRP
10:00 PM – We are currently reporting on this stock as an active holding and continue to monitor the stock closely for any technical SELL SIGNALS.
The focus always remains on price/volume action around key support levels, including the 10 DMA, 50 DMA, and any nearby trendline or ROUND-$ support.

CLICK/TAP CHART TO ZOOM
Chart services courtesy of stockcharts.com. Annotations by James Taulman.
3:46 PM – Calling a 2ND profit-taking SELL SIGNAL here before the close as shares continue to hold recent gains.
ULTRA Trader’s Tip: Scale Out Into Strength
• Selling in stages helps lock in gains while the trend remains intact.
• Partial exits reduce emotional pressure and portfolio risk.
• Strong trading is about managing positions, not chasing perfection.

CLICK/TAP CHART TO ZOOM
Chart services courtesy of stockcharts.com. Annotations by James Taulman.
Latest Chart Update: MGA
8:20 PM – We are currently reporting on this stock as an active holding and continue to monitor the stock closely for any technical SELL SIGNALS.
The focus always remains on price/volume action around key support levels, including the 10 DMA, 50 DMA, and any nearby trendline or ROUND-$ support.

CLICK/TAP CHART TO ZOOM
Chart services courtesy of stockcharts.com. Annotations by James Taulman.
Latest Chart Update: IBP
8:10 PM – We are currently reporting on this stock as an active holding and continue to monitor the stock closely for any technical SELL SIGNALS.
The focus always remains on price/volume action around key support levels, including the 10 DMA, 50 DMA, and any nearby trendline or ROUND-$ support.
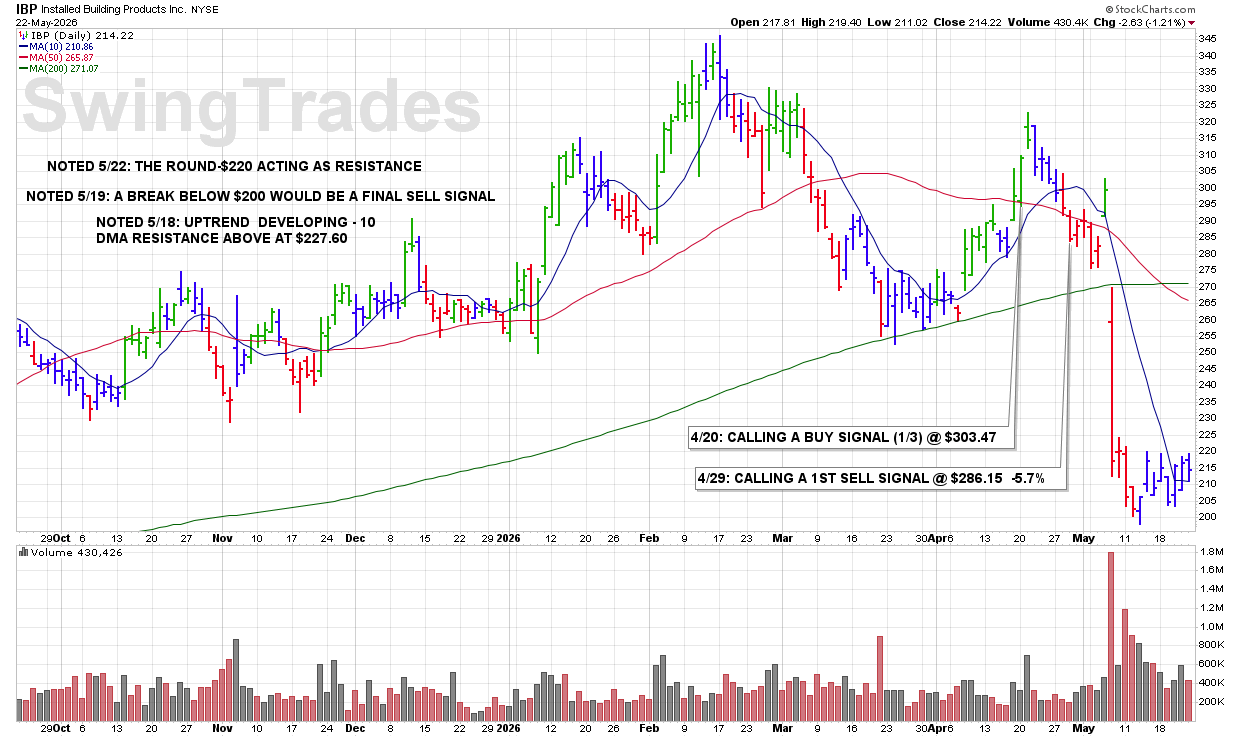
CLICK/TAP CHART TO ZOOM
Chart services courtesy of stockcharts.com. Annotations by James Taulman.
Latest Chart Update: JCI
8:05 PM – We are currently reporting on this stock as an active holding and continue to monitor the stock closely for any technical SELL SIGNALS.
The focus always remains on price/volume action around key support levels, including the 10 DMA, 50 DMA, and any nearby trendline or ROUND-$ support.
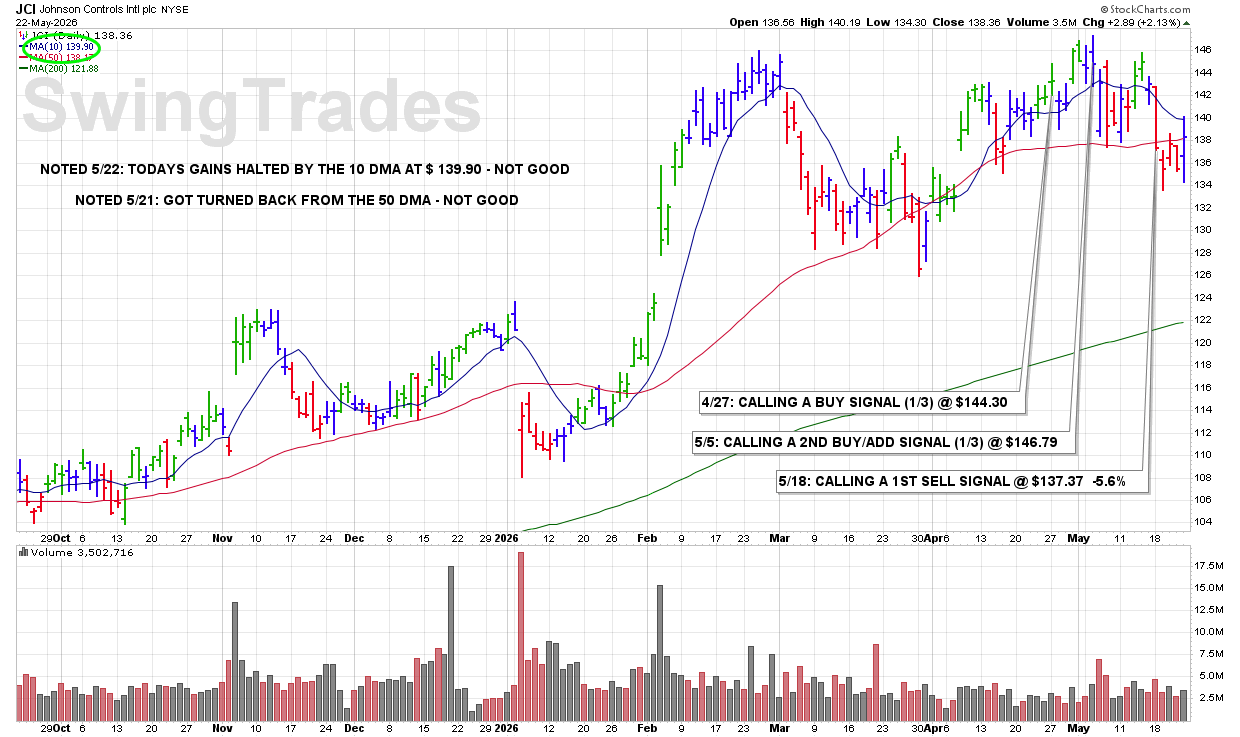
CLICK/TAP CHART TO ZOOM
Chart services courtesy of stockcharts.com. Annotations by James Taulman.
Latest Chart Update: TFSL
8:00 PM – We are currently reporting on this stock as an active holding and continue to monitor the stock closely for any technical SELL SIGNALS.
The focus always remains on price/volume action around key support levels, including the 10 DMA, 50 DMA, and any nearby trendline or ROUND-$ support.
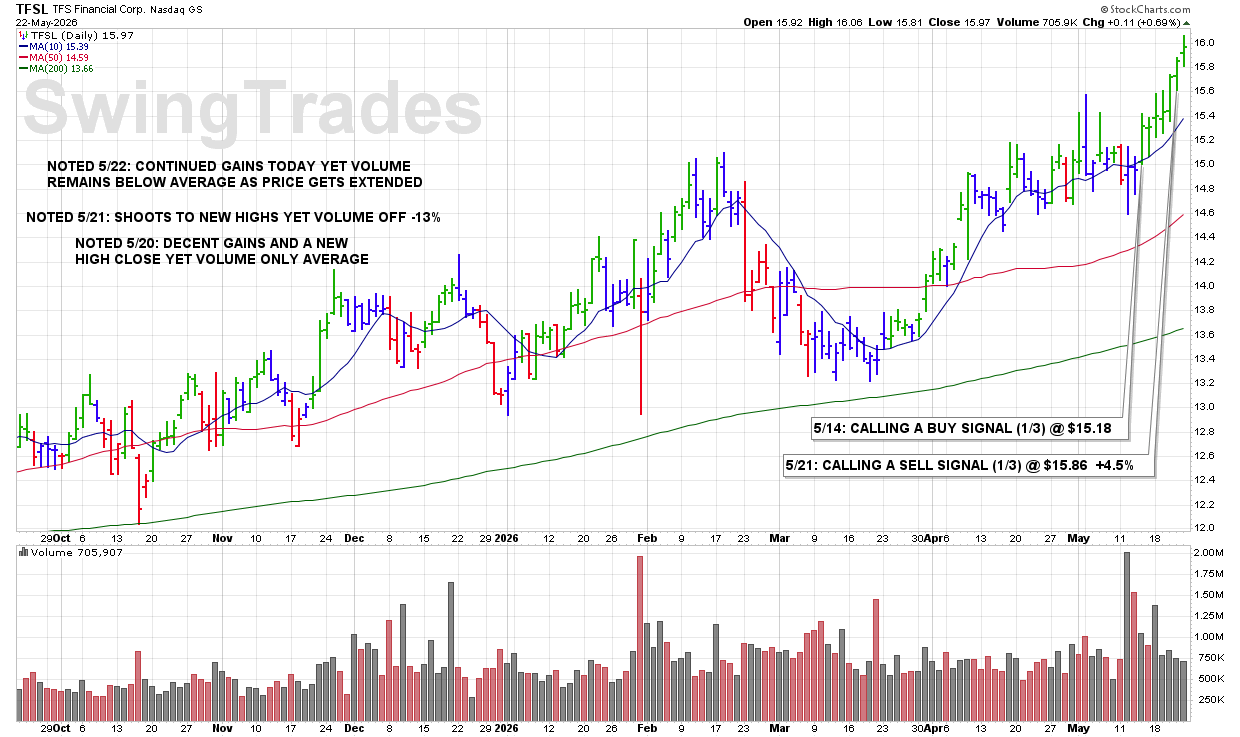
CLICK/TAP CHART TO ZOOM
Chart services courtesy of stockcharts.com. Annotations by James Taulman.
Latest Chart Update: TFSL
10:25 PM – We are currently reporting on this stock as an active holding and continue to monitor the stock closely for any technical SELL SIGNALS.
The focus always remains on price/volume action around key support levels, including the 10 DMA, 50 DMA, and any nearby trendline or ROUND-$ support.

CLICK/TAP CHART TO ZOOM
Chart services courtesy of stockcharts.com. Annotations by James Taulman.
Latest Chart Update: FIVE
10:20 PM – We are currently reporting on this stock as an active holding and continue to monitor the stock closely for any technical SELL SIGNALS.
The focus always remains on price/volume action around key support levels, including the 10 DMA, 50 DMA, and any nearby trendline or ROUND-$ support.

CLICK/TAP CHART TO ZOOM
Chart services courtesy of stockcharts.com. Annotations by James Taulman.
Latest Chart Update: JCI
10:15 PM – We are currently reporting on this stock as an active holding and continue to monitor the stock closely for any technical SELL SIGNALS.
The focus always remains on price/volume action around key support levels, including the 10 DMA, 50 DMA, and any nearby trendline or ROUND-$ support.
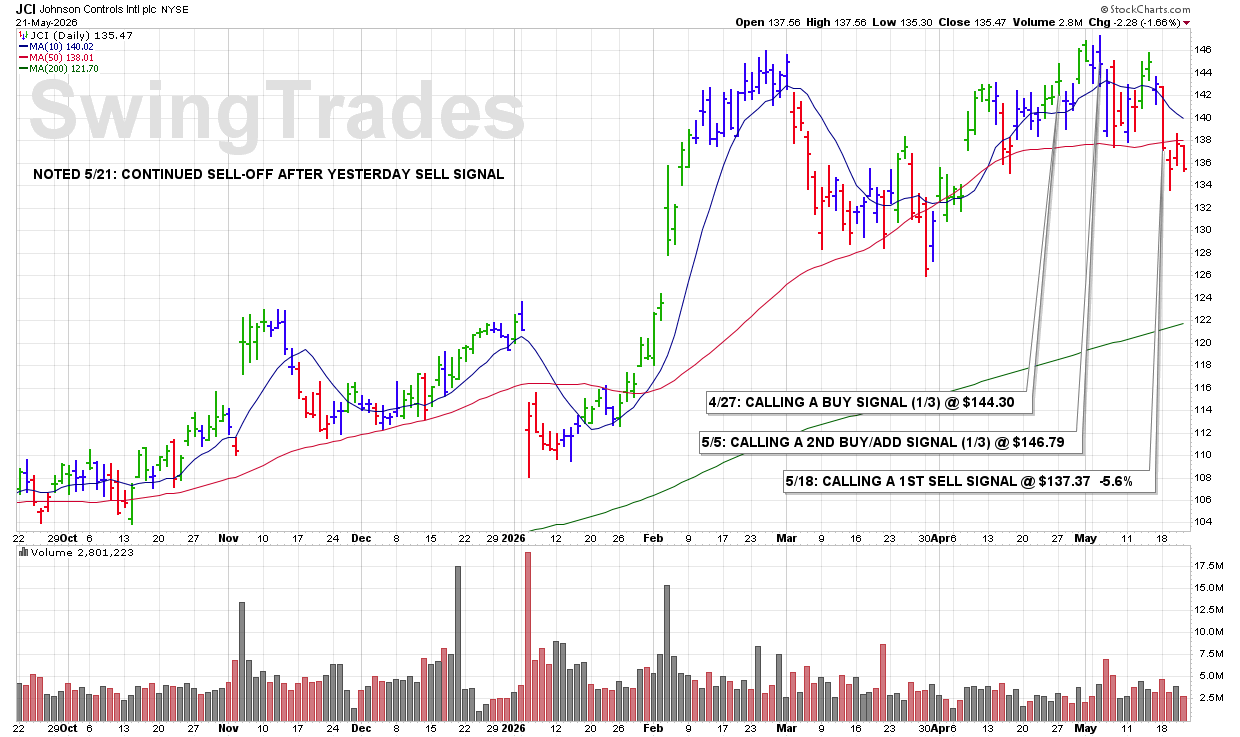
CLICK/TAP CHART TO ZOOM
Chart services courtesy of stockcharts.com. Annotations by James Taulman.
Latest Chart Update: CLH
10:10 PM – We are currently reporting on this stock as an active holding and continue to monitor the stock closely for any technical SELL SIGNALS.
The focus always remains on price/volume action around key support levels, including the 10 DMA, 50 DMA, and any nearby trendline or ROUND-$ support.
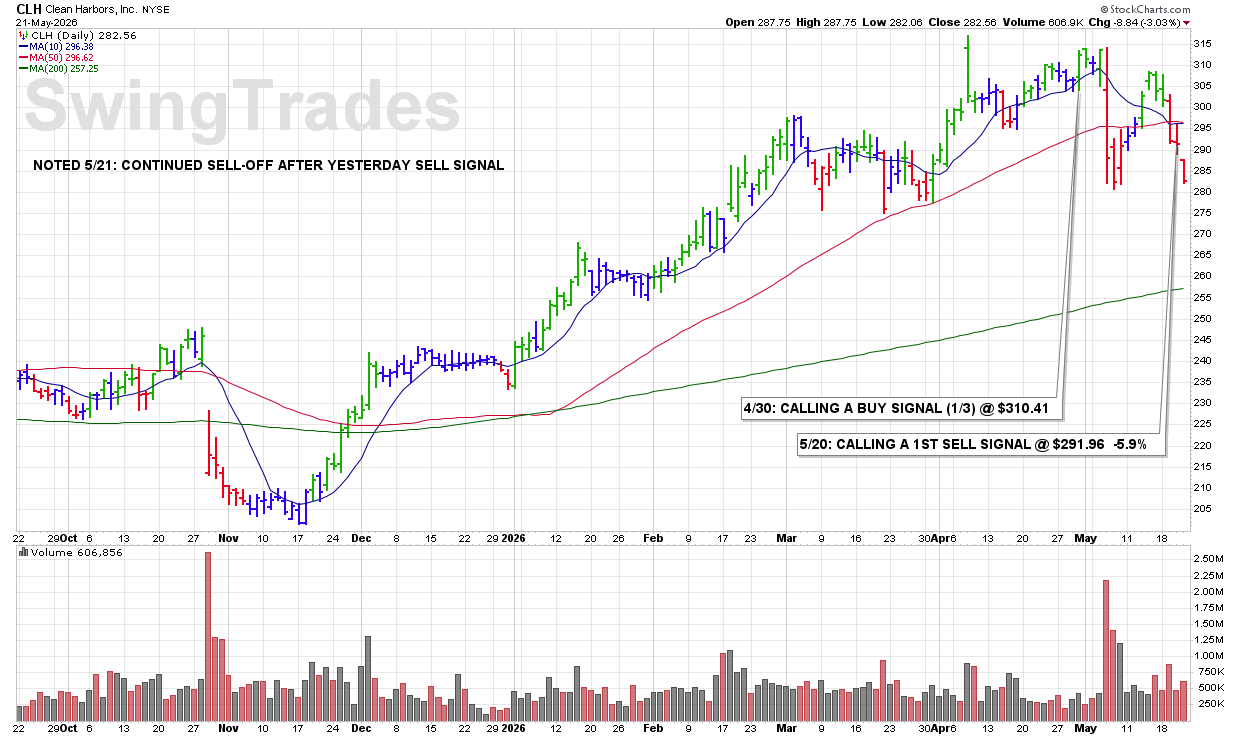
CLICK/TAP CHART TO ZOOM
Chart services courtesy of stockcharts.com. Annotations by James Taulman.
3:29 PM – Calling a 1ST SELL SIGNAL here to lock in some profits following the recent advance.
ULTRA Trader’s Tip: Taking Partial Profits Reduces Pressure
• Selling in thirds allows you to lock in gains while still participating in the trend.
• Partial profit-taking helps reduce emotional decision-making.
• Strong trading is about managing positions, not trying to pick exact tops.
CLICK/TAP CHART TO ZOOM
Chart services courtesy of stockcharts.com. Annotations by James Taulman.
9:51 AM – Calling a 2ND SELL SIGNAL here as the stock is selling off and breaking below ROUND-$22 support with a sharp increase in volume. That combination signals increasing technical weakness and institutional selling pressure.
ULTRA Trader’s Tip: Volume Accelerates the Message
• Breaks of key support levels become more significant on heavy volume.
• Sharp sell-offs often signal institutions are exiting positions.
• Scaling out early helps preserve capital when downside momentum builds.

CLICK/TAP CHART TO ZOOM
Chart services courtesy of stockcharts.com. Annotations by James Taulman.
Latest Chart Update: AFG
10:10 PM – We are currently reporting on this stock as an active holding and continue to monitor the stock closely for any technical SELL SIGNALS.
The focus always remains on price/volume action around key support levels, including the 10 DMA, 50 DMA, and any nearby trendline or ROUND-$ support.

CLICK/TAP CHART TO ZOOM
Chart services courtesy of stockcharts.com. Annotations by James Taulman.
Latest Chart Update: AUPH
10:05 PM – We are currently reporting on this stock as an active holding and continue to monitor the stock closely for any technical SELL SIGNALS.
The focus always remains on price/volume action around key support levels, including the 10 DMA, 50 DMA, and any nearby trendline or ROUND-$ support.
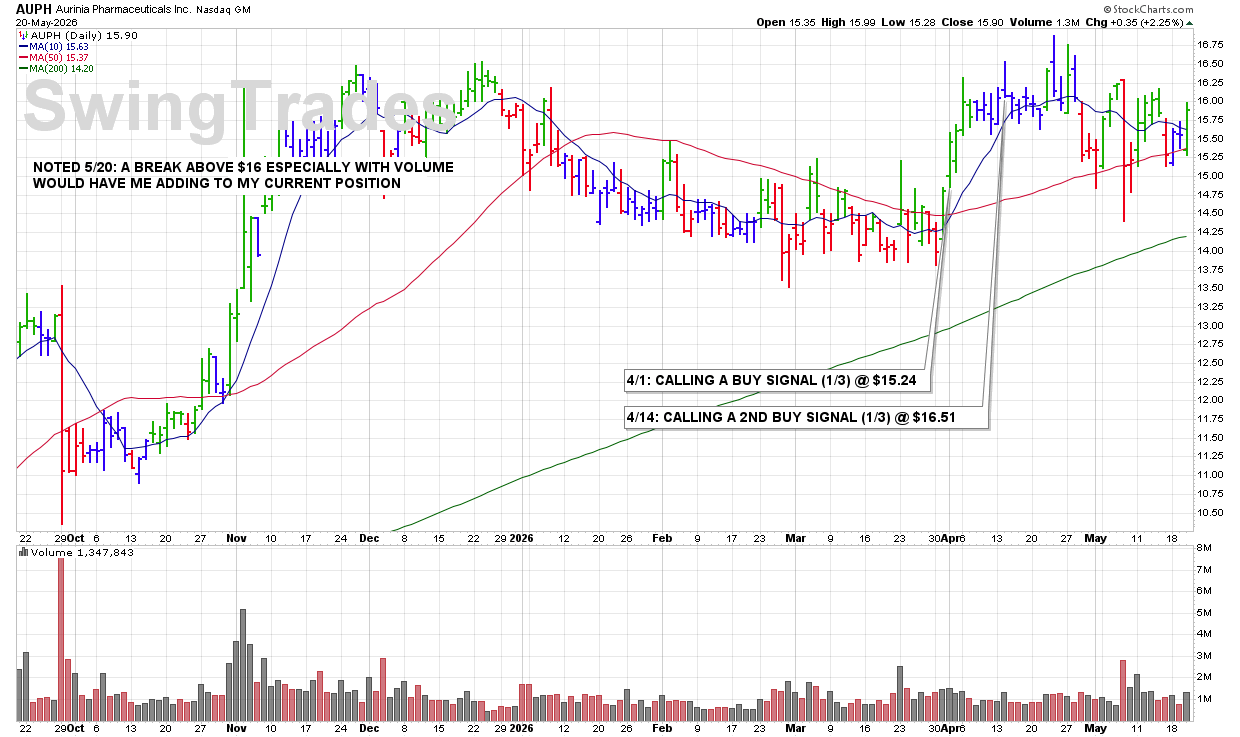
CLICK/TAP CHART TO ZOOM
Chart services courtesy of stockcharts.com. Annotations by James Taulman.
Latest Chart Update: TFSL
10:03 PM – We are currently reporting on this stock as an active holding and continue to monitor the stock closely for any technical SELL SIGNALS.
The focus always remains on price/volume action around key support levels, including the 10 DMA, 50 DMA, and any nearby trendline or ROUND-$ support.

CLICK/TAP CHART TO ZOOM
Chart services courtesy of stockcharts.com. Annotations by James Taulman.
Latest Chart Update: MGA
10:00 PM – We are currently reporting on this stock as an active holding and continue to monitor the stock closely for any technical SELL SIGNALS.
The focus always remains on price/volume action around key support levels, including the 10 DMA, 50 DMA, and any nearby trendline or ROUND-$ support.
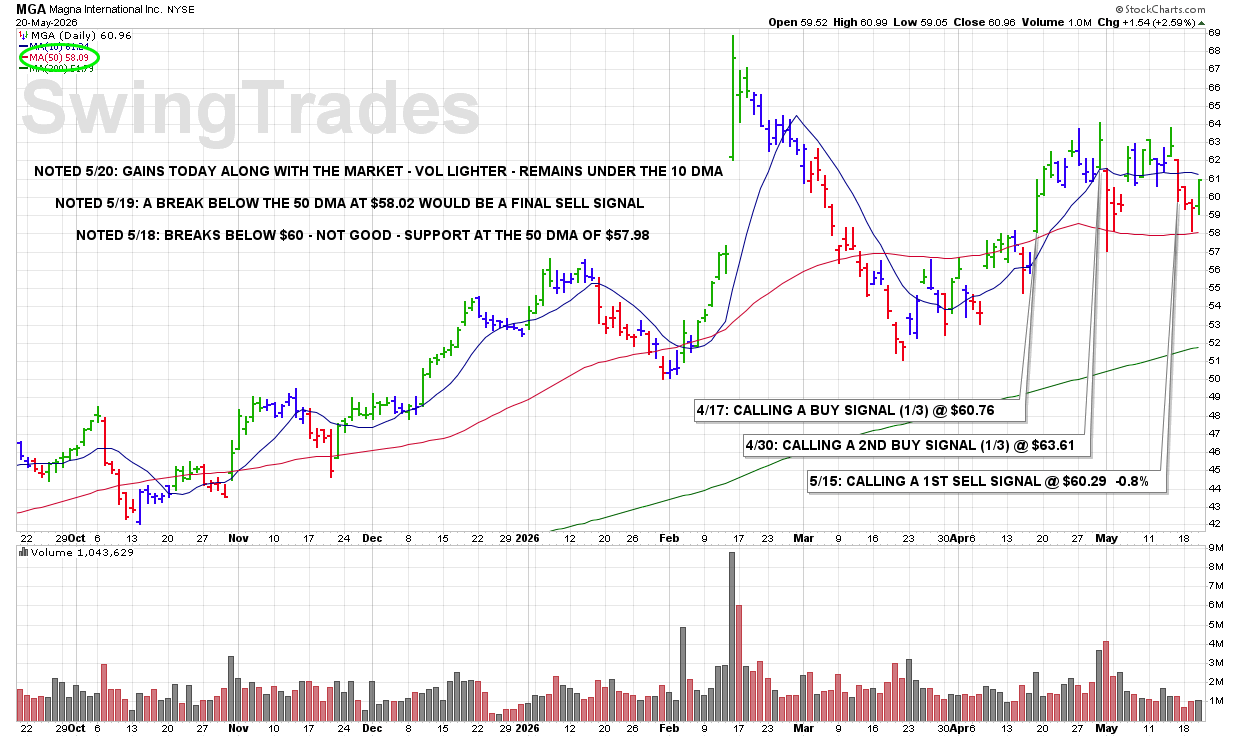
CLICK/TAP CHART TO ZOOM
Chart services courtesy of stockcharts.com. Annotations by James Taulman.
Latest Chart Update: MDU
9:55 PM – We are currently reporting on this stock as an active holding and continue to monitor the stock closely for any technical SELL SIGNALS.
The focus always remains on price/volume action around key support levels, including the 10 DMA, 50 DMA, and any nearby trendline or ROUND-$ support.
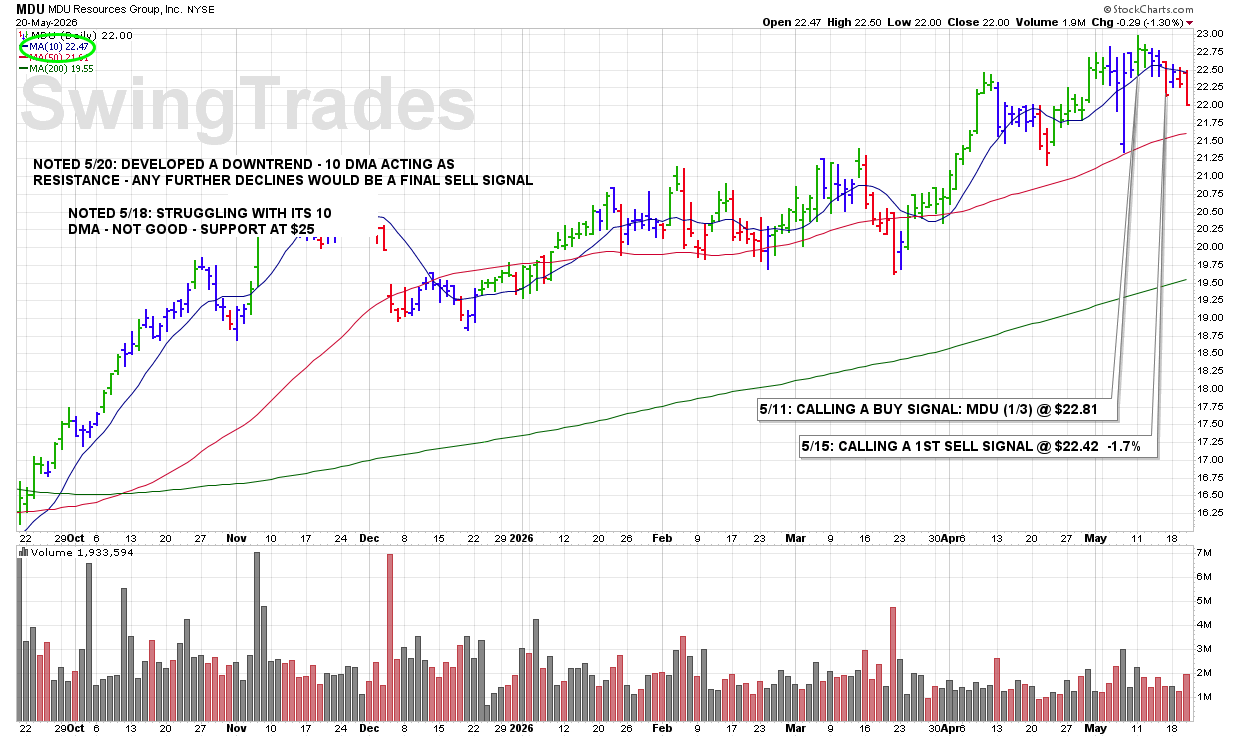
CLICK/TAP CHART TO ZOOM
Chart services courtesy of stockcharts.com. Annotations by James Taulman.
Latest Chart Update: TRP
9:50 PM – We are currently reporting on this stock as an active holding and continue to monitor the stock closely for any technical SELL SIGNALS.
The focus always remains on price/volume action around key support levels, including the 10 DMA, 50 DMA, and any nearby trendline or ROUND-$ support.

CLICK/TAP CHART TO ZOOM
Chart services courtesy of stockcharts.com. Annotations by James Taulman.
Latest Chart Update: CW
9:45 PM – We are currently reporting on this stock as an active holding and continue to monitor the stock closely for any technical SELL SIGNALS.
The focus always remains on price/volume action around key support levels, including the 10 DMA, 50 DMA, and any nearby trendline or ROUND-$ support.
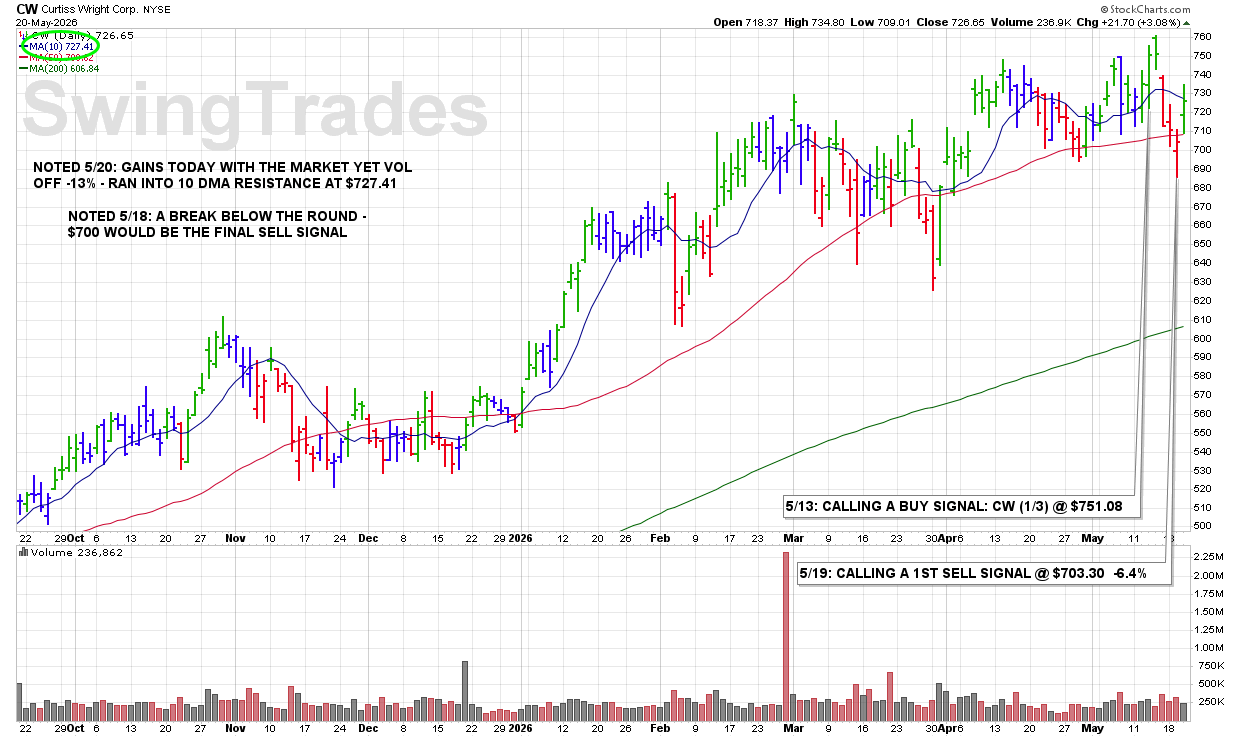
CLICK/TAP CHART TO ZOOM
Chart services courtesy of stockcharts.com. Annotations by James Taulman.
9:37 AM – Calling a 1ST SELL SIGNAL this morning as shares are clearly breaking below the stacked 10 DMA and 50 DMA lines. Those combined technical violations signal weakening momentum and increasing downside risk.
ULTRA Trader’s Tip: Stacked Moving Averages Matter
• When both the 10 DMA and 50 DMA fail together, the message is more bearish.
• Multiple technical violations often lead to additional selling pressure.
• Early risk reduction helps preserve capital during trend deterioration.
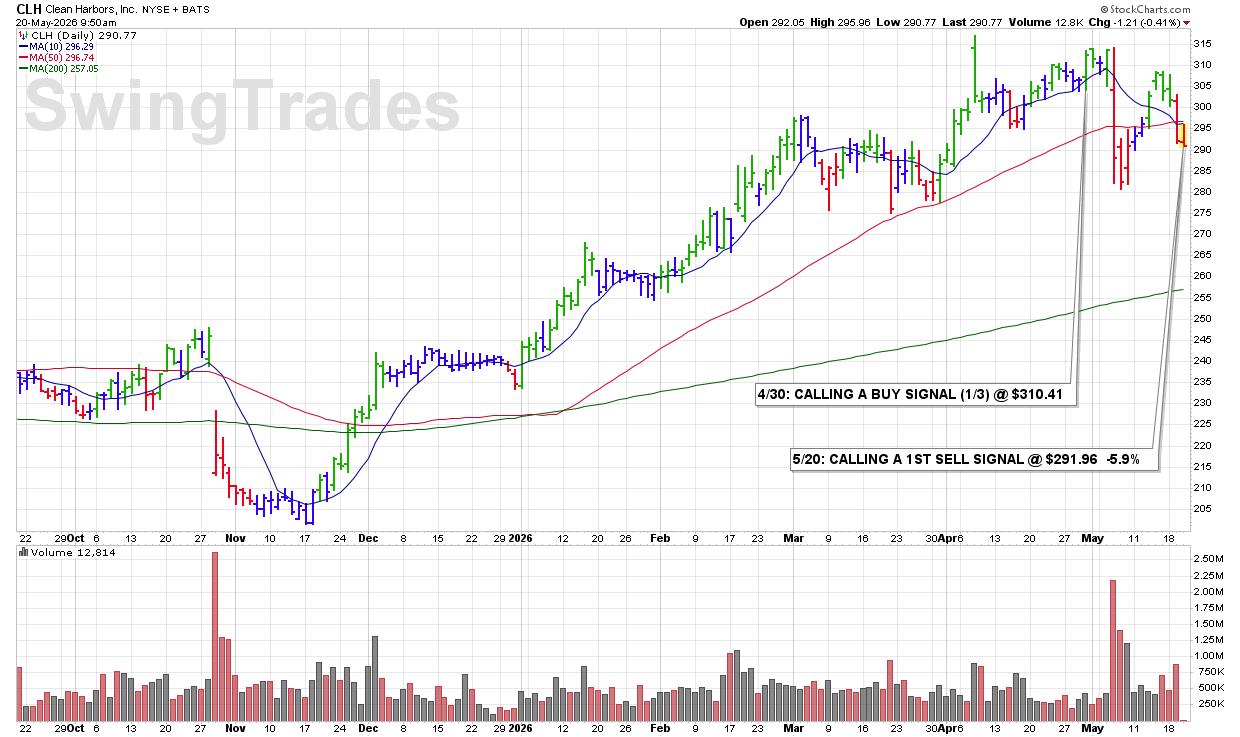
CLICK/TAP CHART TO ZOOM
Chart services courtesy of stockcharts.com. Annotations by James Taulman.
Latest Chart Update: VRT
11:20 PM – We are currently reporting on this stock as an active holding and continue to monitor the stock closely for any technical SELL SIGNALS.
The focus always remains on price/volume action around key support levels, including the 10 DMA, 50 DMA, and any nearby trendline or ROUND-$ support.
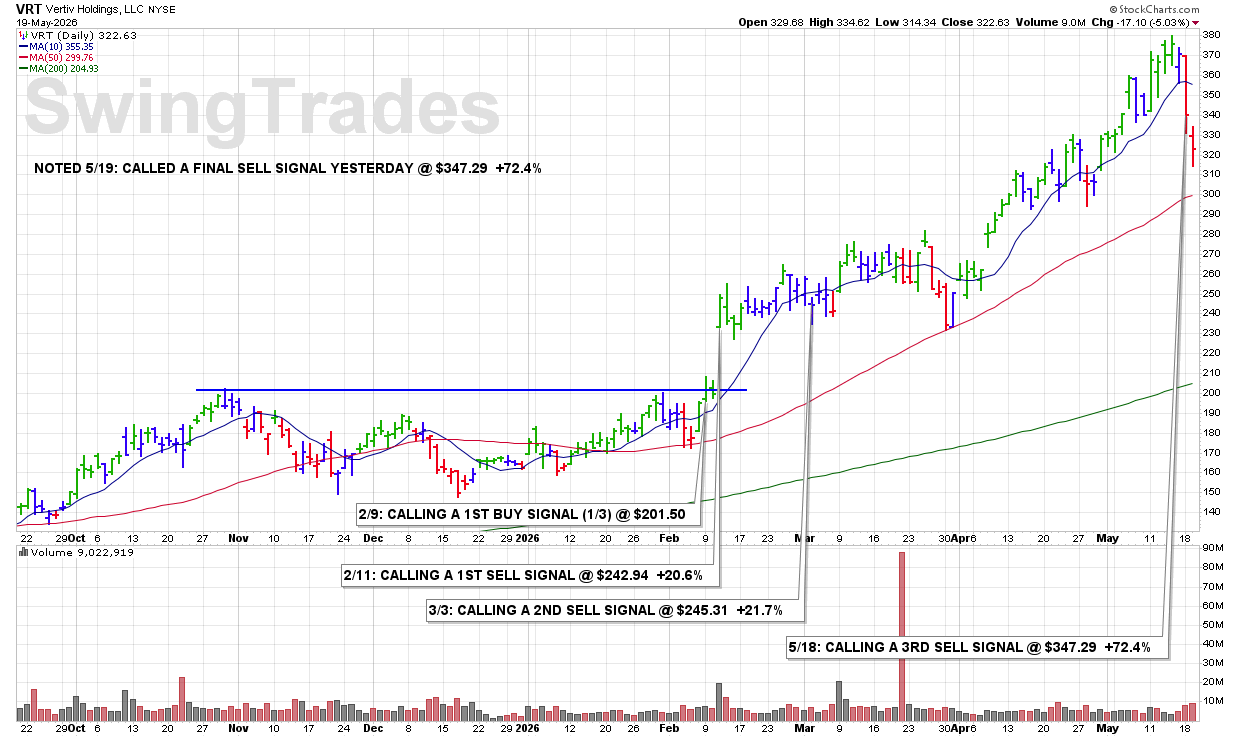
CLICK/TAP CHART TO ZOOM
Chart services courtesy of stockcharts.com. Annotations by James Taulman.
Latest Chart Update: MGA
11:15 PM – We are currently reporting on this stock as an active holding and continue to monitor the stock closely for any technical SELL SIGNALS.
The focus always remains on price/volume action around key support levels, including the 10 DMA, 50 DMA, and any nearby trendline or ROUND-$ support.
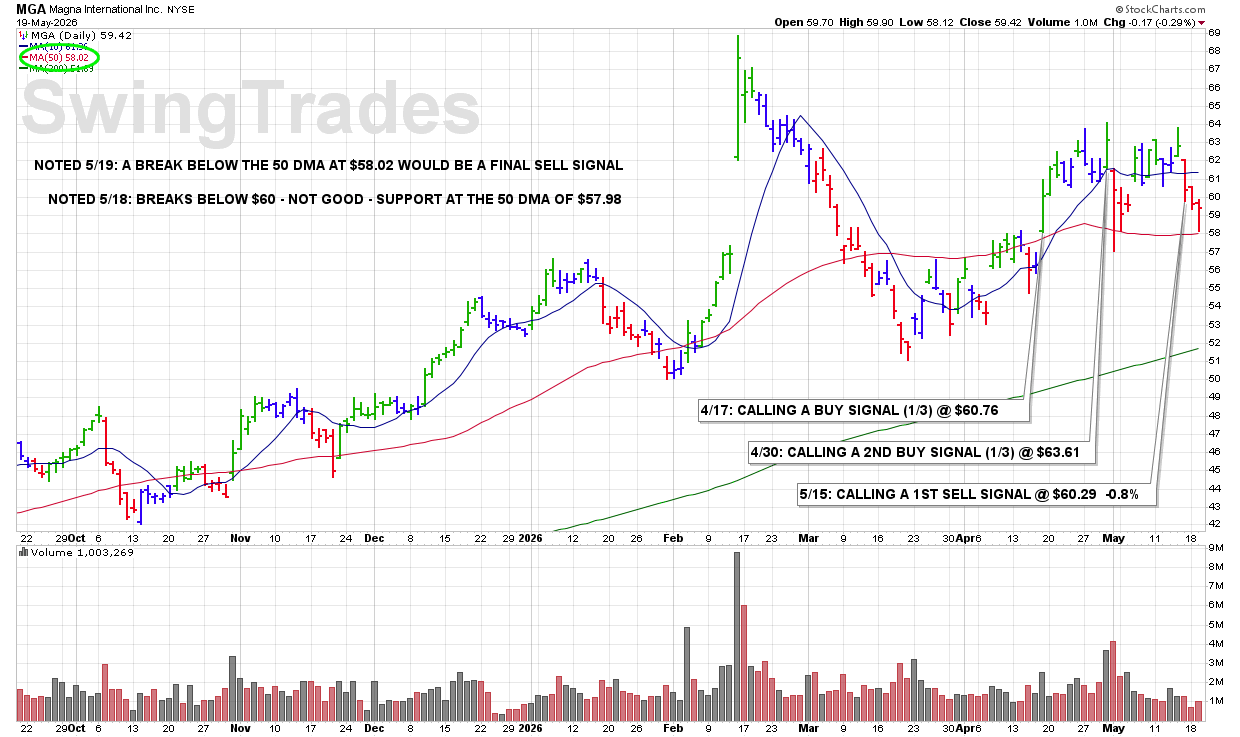
CLICK/TAP CHART TO ZOOM
Chart services courtesy of stockcharts.com. Annotations by James Taulman.
Latest Chart Update: FIVE
11:10 PM – We are currently reporting on this stock as an active holding and continue to monitor the stock closely for any technical SELL SIGNALS.
The focus always remains on price/volume action around key support levels, including the 10 DMA, 50 DMA, and any nearby trendline or ROUND-$ support.

CLICK/TAP CHART TO ZOOM
Chart services courtesy of stockcharts.com. Annotations by James Taulman.
Latest Chart Update: IBP
11:05 PM – We are currently reporting on this stock as an active holding and continue to monitor the stock closely for any technical SELL SIGNALS.
The focus always remains on price/volume action around key support levels, including the 10 DMA, 50 DMA, and any nearby trendline or ROUND-$ support.

CLICK/TAP CHART TO ZOOM
Chart services courtesy of stockcharts.com. Annotations by James Taulman.
Latest Chart Update: VOD
11:00 PM – We are currently reporting on this stock as an active holding and continue to monitor the stock closely for any technical SELL SIGNALS.
The focus always remains on price/volume action around key support levels, including the 10 DMA, 50 DMA, and any nearby trendline or ROUND-$ support.

CLICK/TAP CHART TO ZOOM
Chart services courtesy of stockcharts.com. Annotations by James Taulman.
PRIVACY POLICY | TERMS & CONDITIONS