“I’m grateful to all and every one of my subscribers over the past 20+ years.” – James F. Taulman
“I just started a one month trial last week and jumped on your 5 year deal today.”
– Brian
“I have been with your service for a number of years now and have learned a lot from your insights.”
– Dave
“Your picks are amazing. Anyone who trades stocks would be foolish not to subscribe to your service.”
– Anthony
“FYI, my first purchase based on your 5/12/13 newsletter was URI.
I bought it yesterday, early morning, with a stop order of $56.85. Looks like it shot up enough after that to basically
get my subscription amount back as profit in one day! Look forward to your newsletter.”
– Ram
Have been a subscriber of your ” The Sunday Stock Report” for the last months and enjoy your work and selections.
– Wayne and Pam C.
“I have been watching your letter and you’re excellent to pick break outs. I will be depending upon your expertise.”
-Sarbjit
“I find your analysis very useful and I was pleased to see stocks listed as candidates for shorting. Who knows, we may need that again soon.”
– Glenn
“…keep up the good work.”
– Franklin E.
“GOOG short was a great call! – Thanks”
– Anthony
“I think you are a very genuine, sincere, intelligent, successful individual and seek only to help others.”
– Bob B.
“I have seen that many have benefited from the service and would like to understand how I can best use. I am very keen to learn from
a successful CAN SLIM investor like you…”
– Praveen
Thank you very Much!
Bought some stocks and have a gain in all three based
on your list! Want to keep going!
– George Z.
“I was impressed by your last PowerPoint presentation…”
– Jim R.
“You have great letter…”
– James R.
“Your reports are constantly improving – good work”
– Cole K.
“…appreciate all your work”
– Frank k.
“I already have a two year paid up membership.
Thanks for the super picks you have been making lately.”
– Rick B.
“James, Thanks for the heads-up. I jumped on the HLF
early yesterday and added more later in the day.
By the way, I have locked in profits on GMCR
and MLNX in the last week or so.
Nice to bank a few $$. Thanks again.”
– Brian T.
“…just after one day with you I will tell you I really like the clear detailed direct reports, the updates and the notes ! ! !
They’re greatly appreciated! Thanks.”
– Barry
“Thanks for the updates. For me, these updates add great value to your service by bridging the seven days between the Sunday reports. Great job…”
– Brian
“Thanks for the great job you do James.”
– Sasha
“Thank you for all the great work.”
– Cary W. (12/28/09)
“I have been getting your reports and I am impressed.
I met you several years ago in South Florida.
Thanks for your help.”
– Jeff
“I will look forward to the new
Sunday night set ups. Thanks so much!”
– David H.
“I subscribed to your 3 month trial of the Sunday Setup Report.
I have enjoyed your insight and have profited from your selections.”
– Ron G.
“Thanks James for your response and yes, very helpful information!”
– Pat B.
“Very helpful to have an expert opinion such as yours.”
– Pat
“Very happy to see you sticking to your rules which are founded in CANSLIM. CANSLIM discipline pushed me into mostly cash in 11/07 and I’m still there.”
– Ed
“James, I have definitely benefited from your reports…. Especially during the correction and learned about shorting stocks during that time and had some success. I had never shorted before. Your report was “right-on” with GFA on 4/27. I had a very nice profit, took only half and let the rest ride for now.
Thank you for the good work you do…”
– Pat
“I completed my second trade as a result of your service yesterday. My first [a short selection from your service] where I got a 15% return in 2 weeks. I sold [my second, a long selection from your service] for another 15% gain in a little over 2 weeks. Anyway, some nice quick gains thanks to you.”
– Very Satisfied Subscriber
“James, thanks for pointing out GMCR. I had a 19% gain in just 7 trading sessions!”
– Satisfied Subscriber
“Truly clear and efficient.”
– Laurent L
“Sorry I missed the Friday stock talk. I picked up CPLA near the close Friday and am delighted to see it in your report today. Friday was a really nice day. I’m glad I signed up for your reports.”
– David G.
“Thanks for the info. I like the way it is set up… short and to the point.”
– Charlie
“I’m looking forward to the Sunday Set Up Report… Your service is outstanding.”
– David G.
“The Sunday Set Up Reports are awesome! Keep them coming.”
– Vinay
“A great help; thank you. Took some profit and will watch for a pullback. Appreciate the reply to my inquiry and truly appreciate your Sunday Set Up Reports thanks for what you do to help us “still learning” individual investors.”
– Pat
“These sure are fast-moving stock picks. Good job! ”
– Bob
“I have had some success with reading your Sunday Set-up Reports, thanks for the service.”
– A. O. (10/01/07)
“Hi James… You are Good!! Thanks for the email, I didn’t buy [SNCR] but I appreciate the heads up on it.”
– Pam
“First of all, thanks for a job well done. Second: I’m about to renew my membership”
– Erich B.
“You have established for me that you know your stuff and you present it in a forthright way. I have taken your advice a number of times and related it to the IBD CANSLIM method as presented in the 100’s. Thanks again for your informative site.”
– Homer B.
“I think this service is dynamite!
“- Derrick J.
“Your answers keep me from making mistakes that may be very costly.”
(After asking about buying QI on 07/25/07 – Stock went straight from $15 to 5 cents)
– Leonard
“I really like the service and I do buy the stocks at the breakout. Thank you very much for the service.”
– Peter N.
“Thank you for having me on your mailing list. I am an experienced trader with over 55 years learning the business. I appreciate your work and effort. As for your letter it is good, very good as presented… I do print the letter and keep track of all the recommendations.”
– Joe P.
“I like what I see… Keep up the good work.”
– Vern K.
“… your service will be at the top of my list of ‘must haves’.”
– Jerry K.
“I think that this is a great idea and is appreciated. Keep up the good work.”
– Cole K.
“[The Sunday Setup Report] is a great tool/service… Keep up the good work.
– Ali F.
“The Sunday Setup is a great tool for updating my Watch List on Investors.com. I find your analysis on each stock featured to be concise, timely, & without a lot of hype & superfluous commentary. I like the fact that your reports are tailored for all levels of investment experience & can be followed by novice or experienced persons alike. Your analysis stays with the basics of CANSLIM… I just bought OYOG at midpoint & have done fairly well so far. I recommend your service to anyone who asks me for input on how to better their trading prowess. Thanks for a great service.”
– Steve
“The Sunday breakouts are great… ”
– Alan M. Portfolio Specialist
“You appear to have a very workable formula for selecting successful stocks. Thank you for the information.”
– George K. (07/24/07)
“I think [The Sunday Set-Up Report] is great. I have purchased stock and I am pleased. I think this is a great new part of your service”
– Trudi S. H.
“I have not invested in [the selected stocks] yet but watching them grow in value – Too bad I am enjoying vacation and am not taking advantage but please keep them coming. I have missed it now but will definitely take advantage in future as soon as I return form vacation. Thanks”
– B.K.
“…thanks for your efforts… keep up the good work…”
– Jerrold P. F.
“I am a new subscriber and like what I have seen. I have been following your trades in a watch list and plan to use real money this week or next. I have forward your emails to another CANSLIM investor friend. Please keep up the good work!”
– A. F.
“I love the report as it has great info. I just set up my stock alarm to follow the action. Love it and Thanks”
– Ricardo P.
“I’VE ENJOYED THE SUNDAY REPORTS.. THANK YOU.. I’VE TRADED ON SOME OF THEM… MADE MONEY… YOUR STYLE OF STOCK PICKING IS EXACTLY LIKE MINE.. I’M A STRICT FOLLOWER OF CAN SLIM. I DON’T DIVERT FROM IT. I USE PIVOT POINTS AND ONLY CHOOSE HIGHLY RANKED STOCKS. I USE YOUR PICKS & ADD THEM TO MINE.. IT GIVES ME A WIDER VARIETY OF GOOD CANDIDATES.”
– SAL D.
“Thanks for all your help and support.”
– Joe
“…the Sunday report has far more value to traders and investors alike then the regular CANSLIM newsletter. It is the old adage “less is more”. I have used the report to not only buy stocks (which have done quite well), but even when I haven’t bought the stocks mentioned it provides a source to learn enough about them for future reference. I value the report enough that if the report went to a stand alone paid subscription format I would subscribe”
– Craig J.
“I like the Sunday report – it seems to focus in on the top 5 most important stocks at that time. I have bought some report stocks, with fairly good success.”
– Greg D.
“I have bought several stocks using this information… so far they have done well for me.”
– Herman N.
“I really appreciate the Sunday Report and I have been watching its performance carefully since you started sending it to me. You are doing a great job!”
– Davis S.
“I have been reading the Sunday Set-Up Report and I like it very much. It very clearly illustrates the set-up but still is concise. I have made purchases based upon the Sunday report. For the most part they have made solid gains. Again James, thank you for the Sunday report. It has been quite helpful for me.”
– Guy C.
Many thanks James for your [Sunday Stock Set-Up Report]. I like it very much. Please keep sending it.
– Laurent L.
“Sunday breakouts are great.”
– Alan M., Portfolio Specialist
Love this new feature [Sunday Stock Set-Up Report], great work…Thanks
– Rick W.
“Thanks for continuing to send me your weekly letter. I really enjoy it.”
– Ric
“I’m enjoying your new report and hope you keep it up.”
– Rick B
“…very nice set ups and breakouts based on the Investor Business Daily stock selection method.”
– Thomas N.
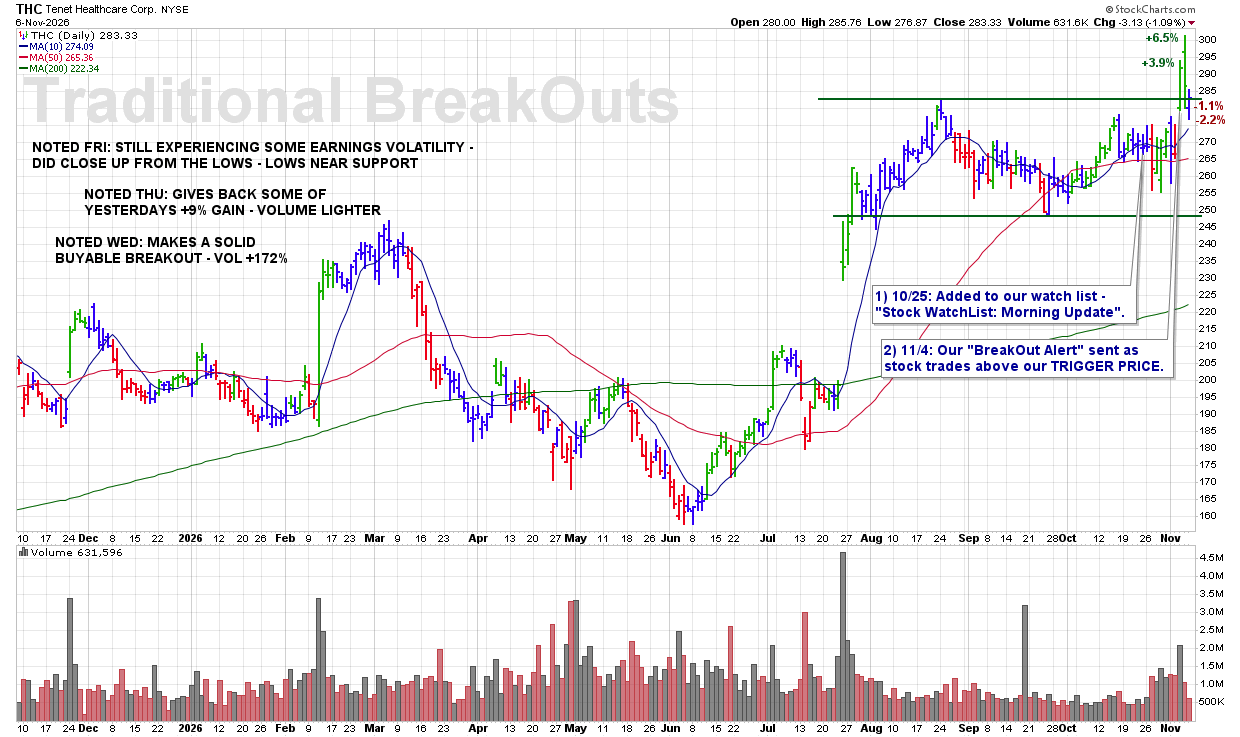
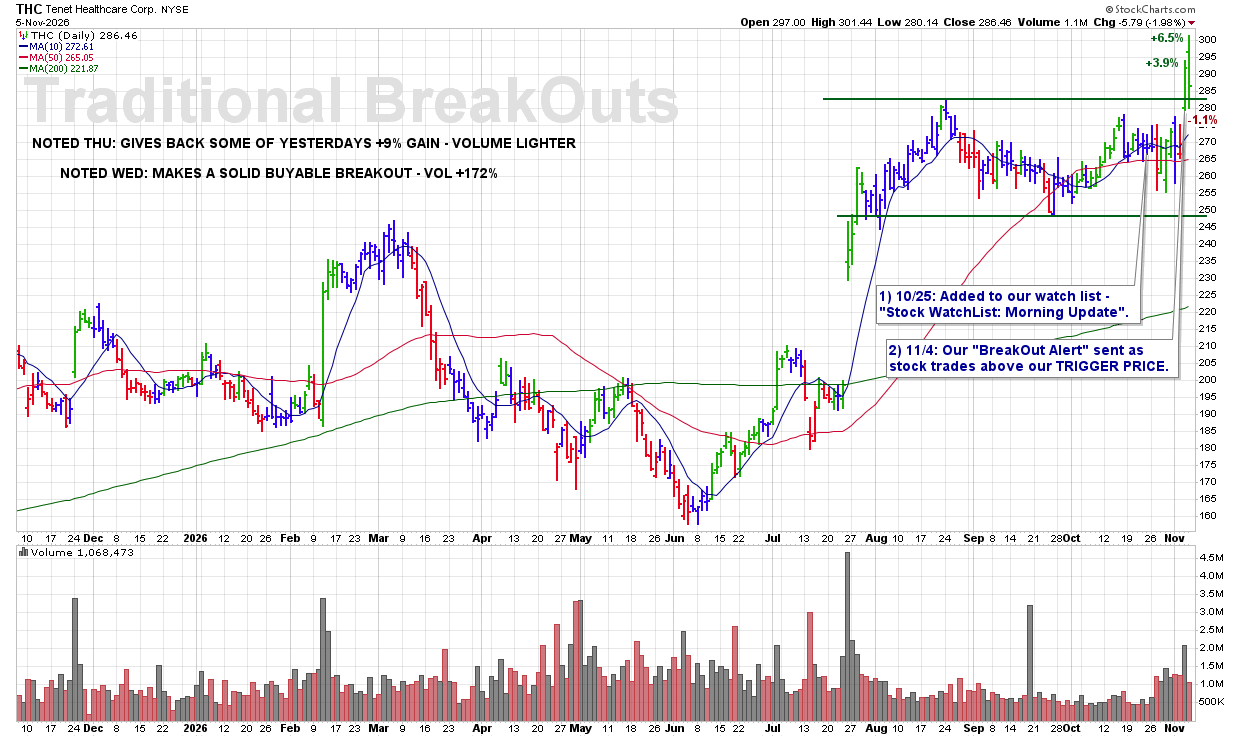
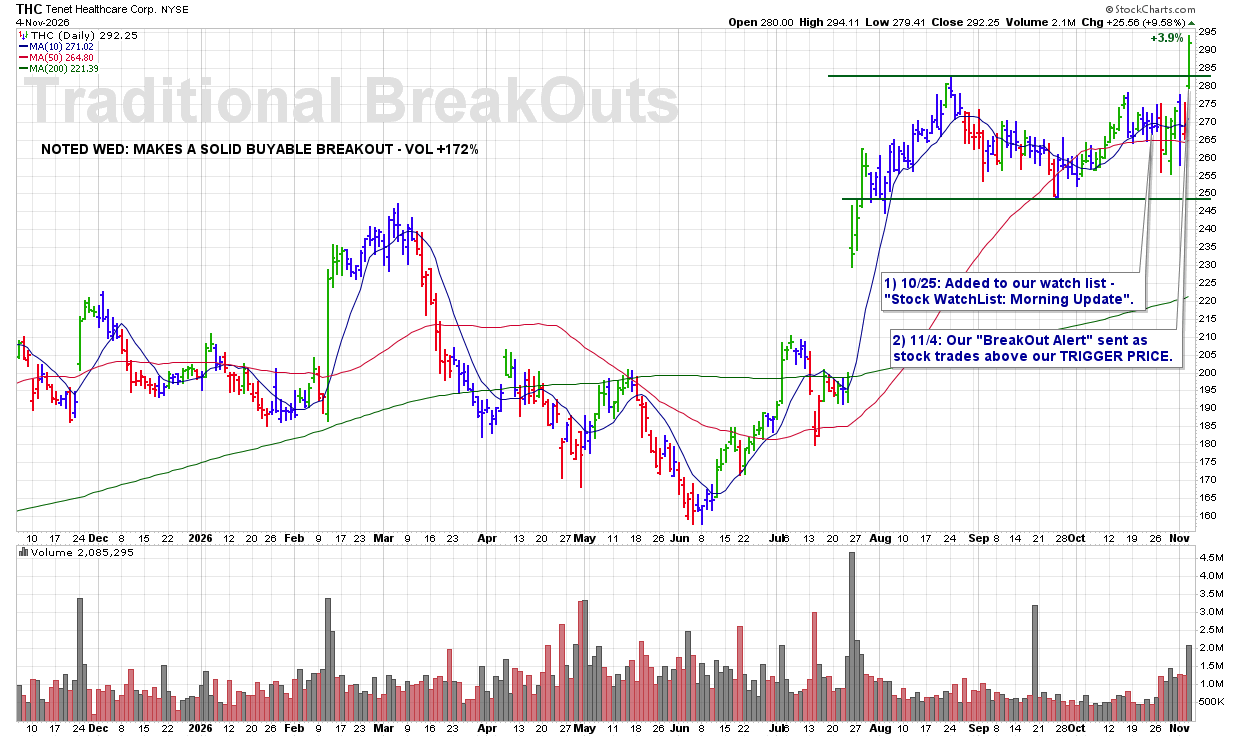
“James, I especially like having the annotated chart, as well as trigger points and support levels all in one spot…great for getting a quick overview of the stocks story, as well as providing a visual history of price action to back up your recommendations/observations.”
“I like the “alert/email” options through Yahoo whereby a subscriber can give the report a good read “after hours” or “pre-market”, load up certain trigger “alerts” and then head off to work. As their particular interest hit the “confirmed” level, they can take action and place a trade without having to be “glued” to their screen awaiting the proper moment. This is a great addition and I applaud your efforts.”
– Derrick J.