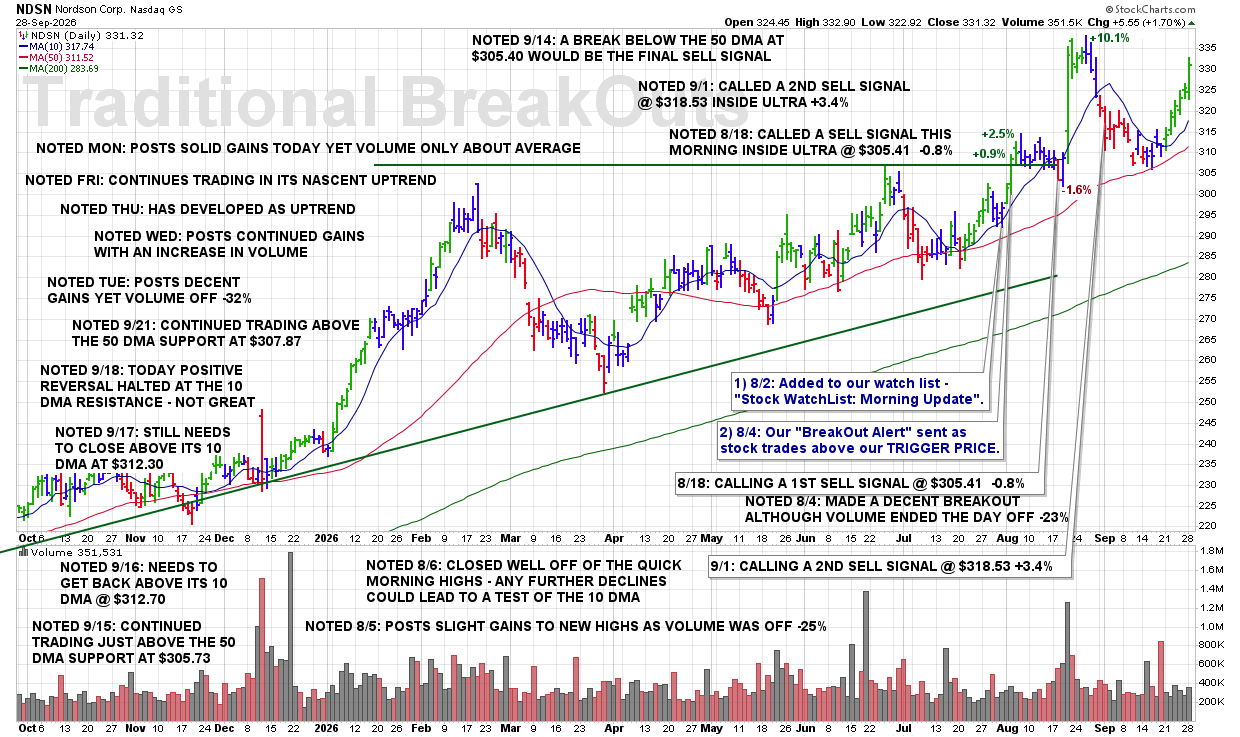
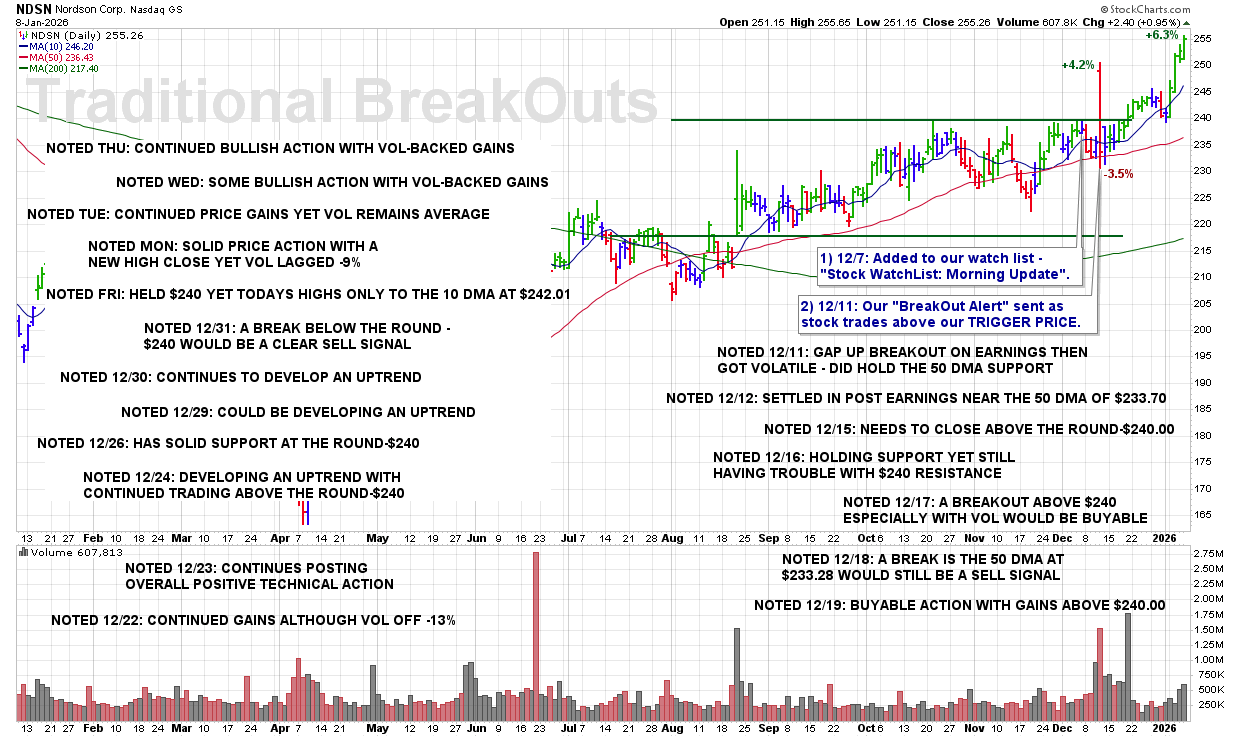
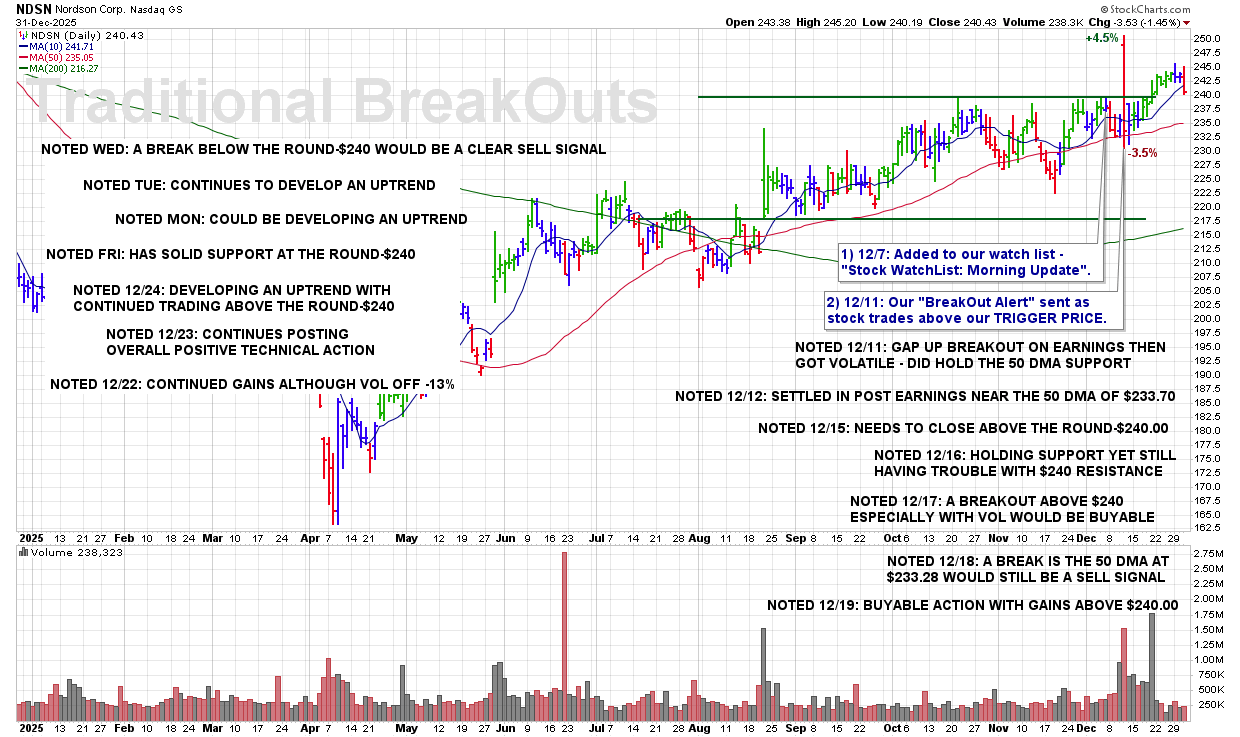
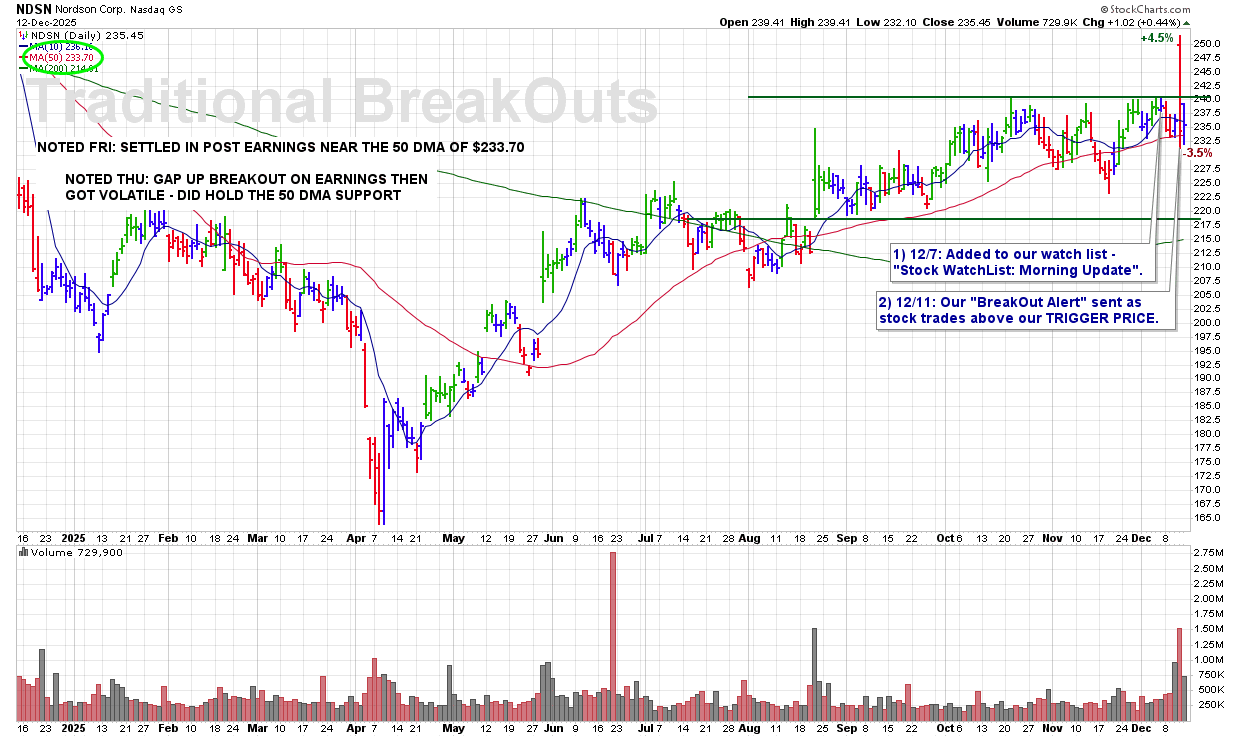
MON 9/28: NDSN – Posts Solid Gains Today Yet Volume Only About Average

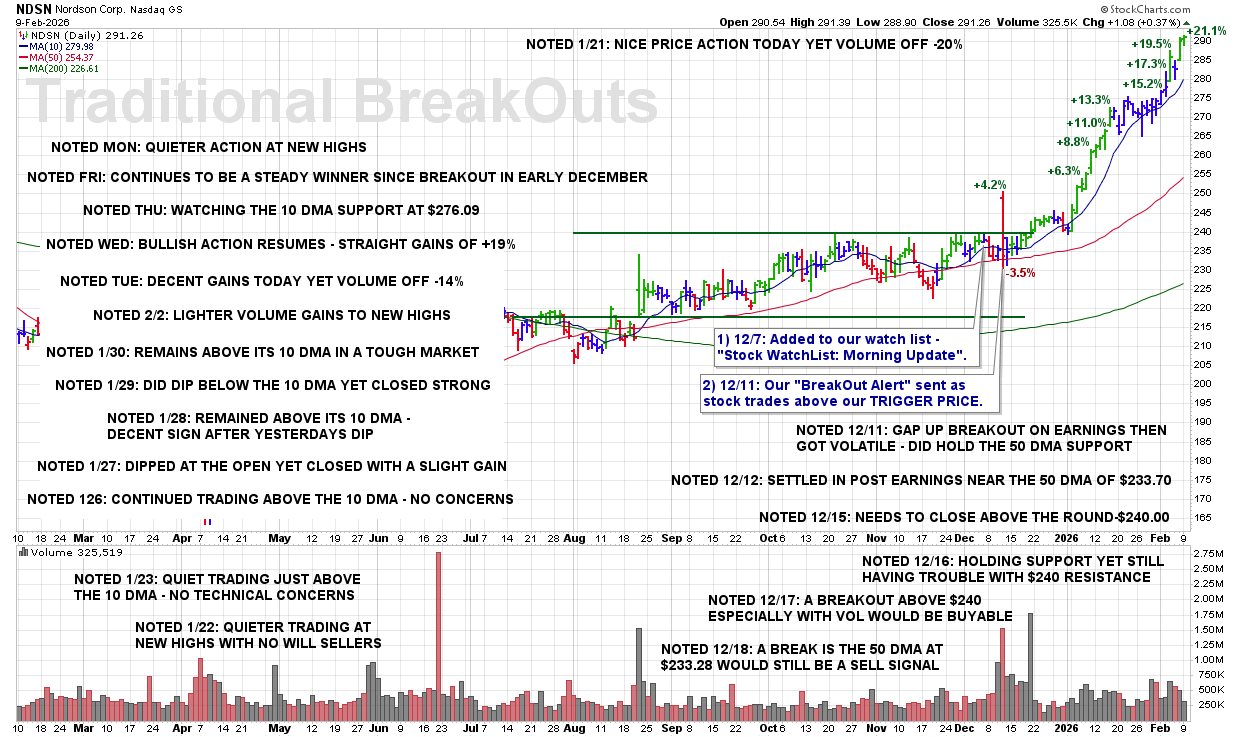
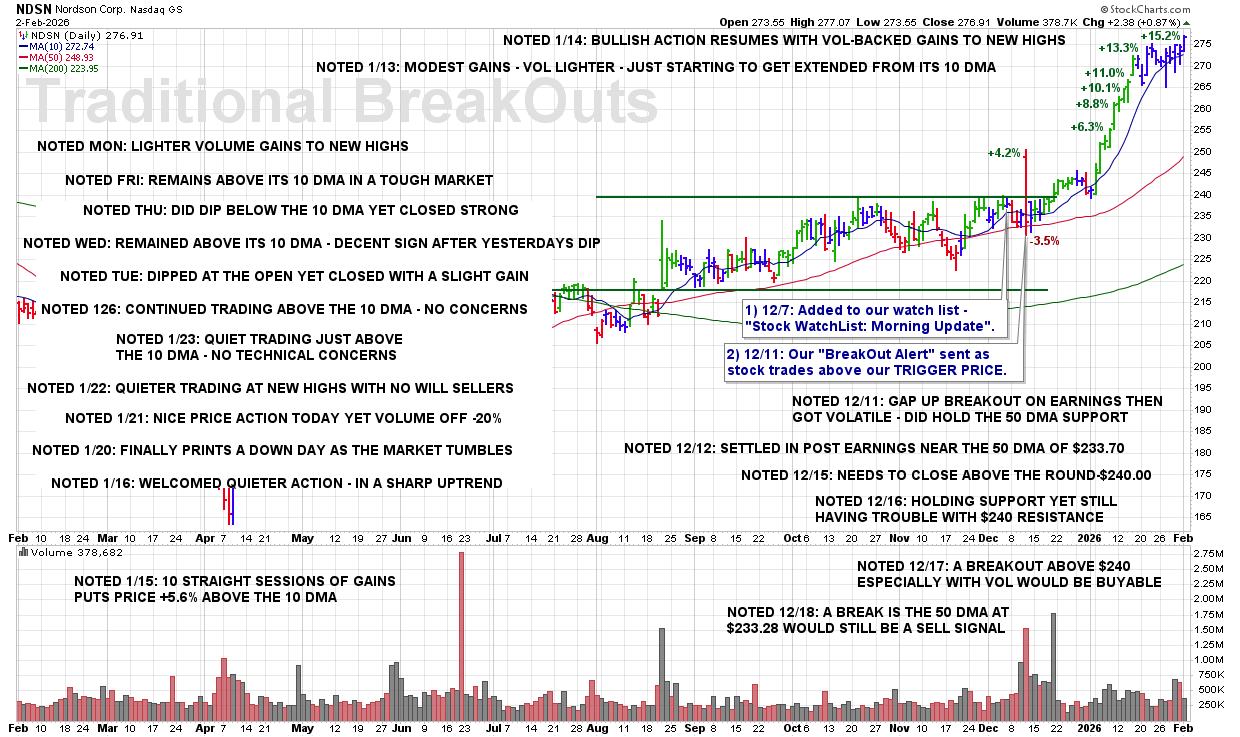
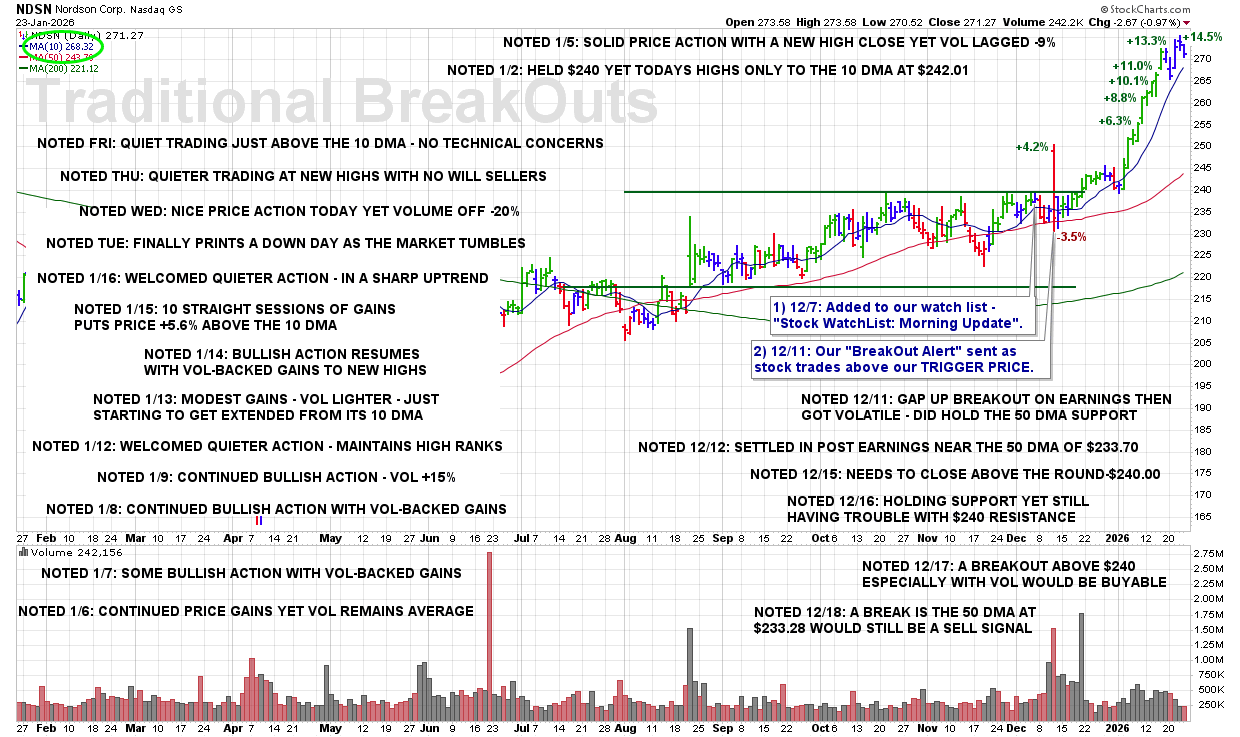
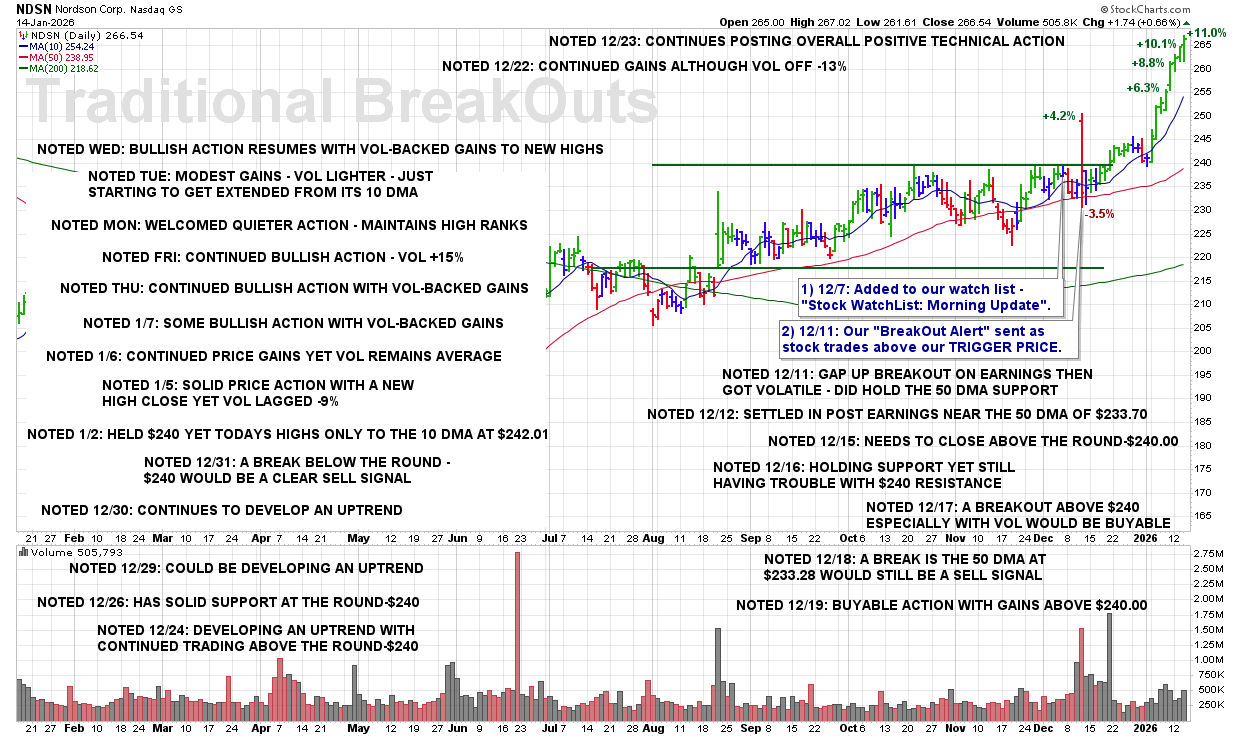
7:05 PM – Here is our latest chart update for this recent breakout from our Traditional BreakOuts Watch List

CLICK/TAP CHART TO ZOOM
Chart services courtesy of stockcharts.com. Annotations by James Taulman.

We are currently reporting on this stock as an active holding and continue to monitor the stock closely for any technical SELL SIGNALS.

The focus always remains on price/volume action around key support levels, including the 10 DMA, 50 DMA, and any nearby trendline or ROUND-$ support.

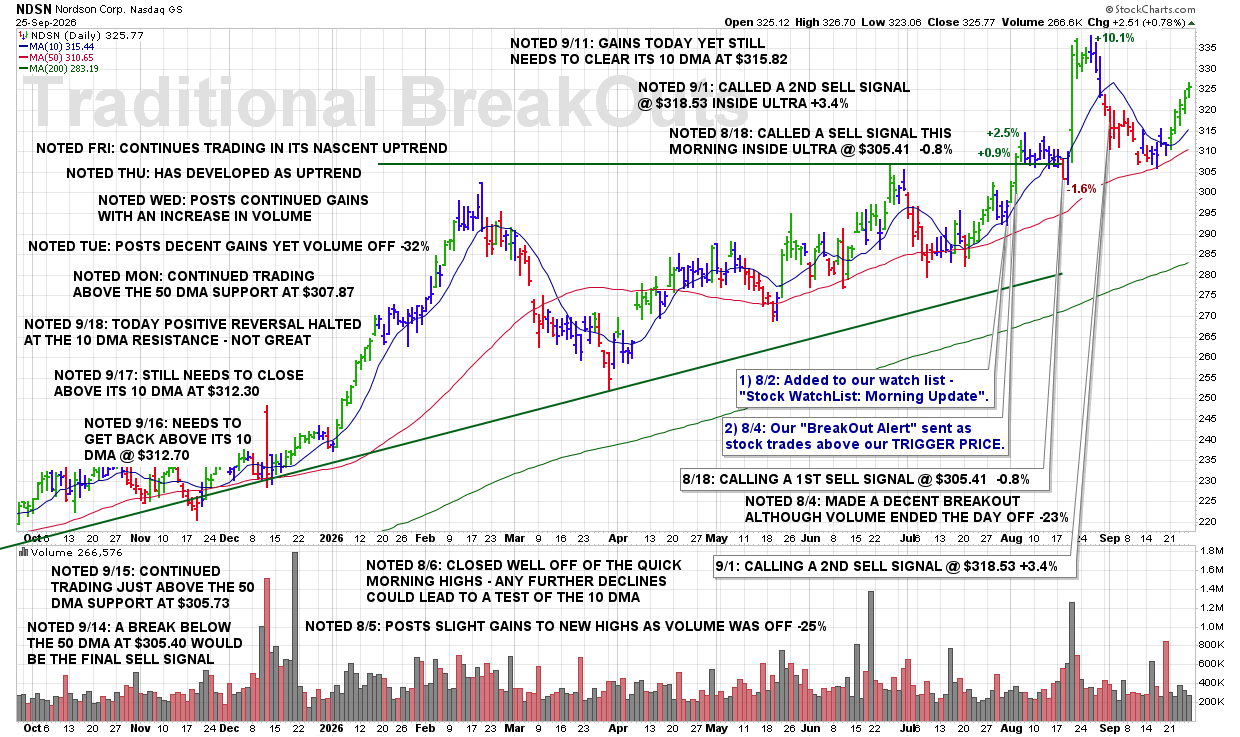
FRI 9/25: NDSN – Continues Trading in Its Nascent Uptrend

7:35 PM – Here is our latest chart update for this recent breakout from our Traditional BreakOuts Watch List

CLICK/TAP CHART TO ZOOM
Chart services courtesy of stockcharts.com. Annotations by James Taulman.

We are currently reporting on this stock as an active holding and continue to monitor the stock closely for any technical SELL SIGNALS.

The focus always remains on price/volume action around key support levels, including the 10 DMA, 50 DMA, and any nearby trendline or ROUND-$ support.

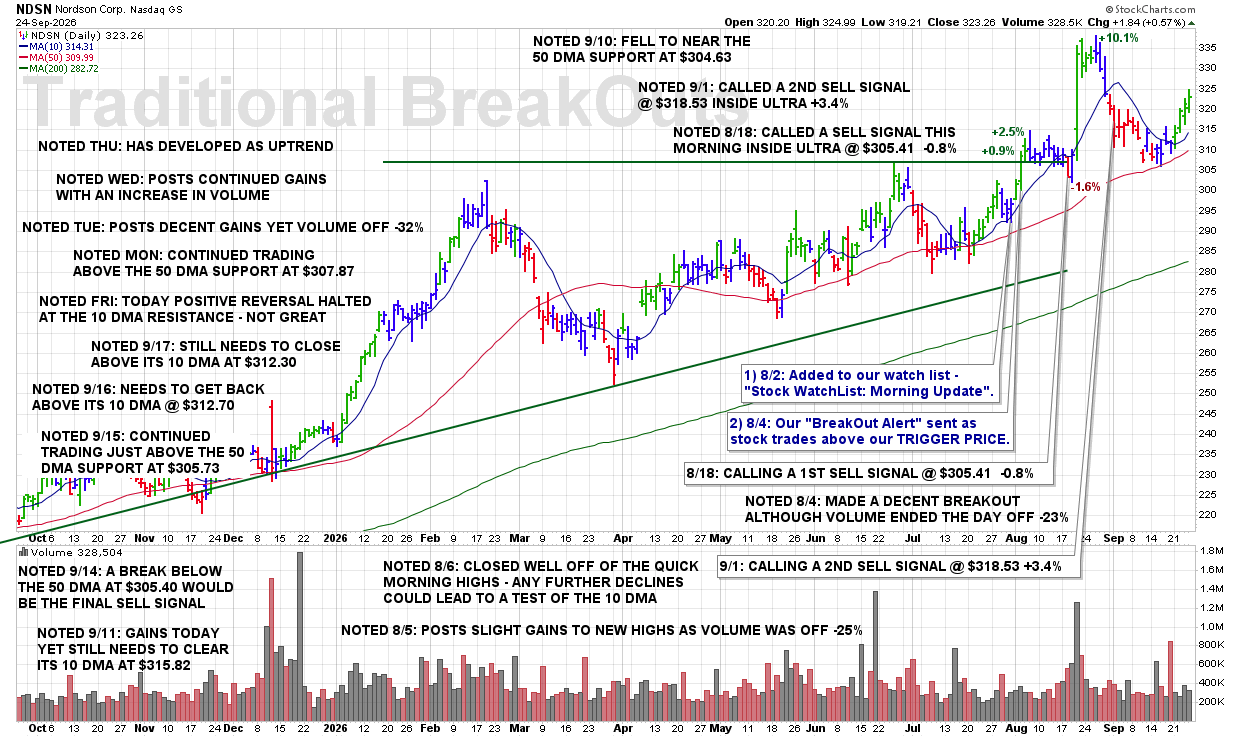
THU 9/24: NDSN – Has Developed as Uptrend

7:35 PM – Here is our latest chart update for this recent breakout from our Traditional BreakOuts Watch List

CLICK/TAP CHART TO ZOOM
Chart services courtesy of stockcharts.com. Annotations by James Taulman.

We are currently reporting on this stock as an active holding and continue to monitor the stock closely for any technical SELL SIGNALS.

The focus always remains on price/volume action around key support levels, including the 10 DMA, 50 DMA, and any nearby trendline or ROUND-$ support.

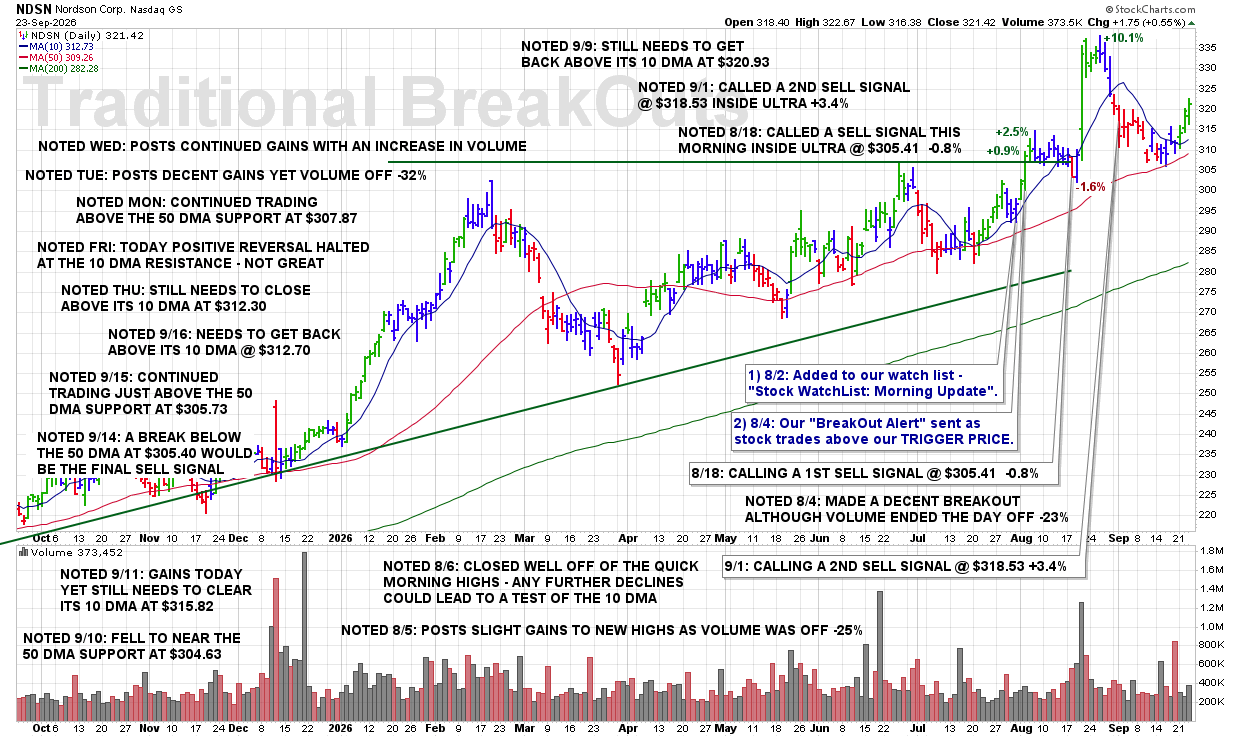
WED 9/23: NDSN – Posts Continued Gains With an Increase in Volume

8:35 PM – Here is our latest chart update for this recent breakout from our Traditional BreakOuts Watch List

CLICK/TAP CHART TO ZOOM
Chart services courtesy of stockcharts.com. Annotations by James Taulman.

We are currently reporting on this stock as an active holding and continue to monitor the stock closely for any technical SELL SIGNALS.

The focus always remains on price/volume action around key support levels, including the 10 DMA, 50 DMA, and any nearby trendline or ROUND-$ support.

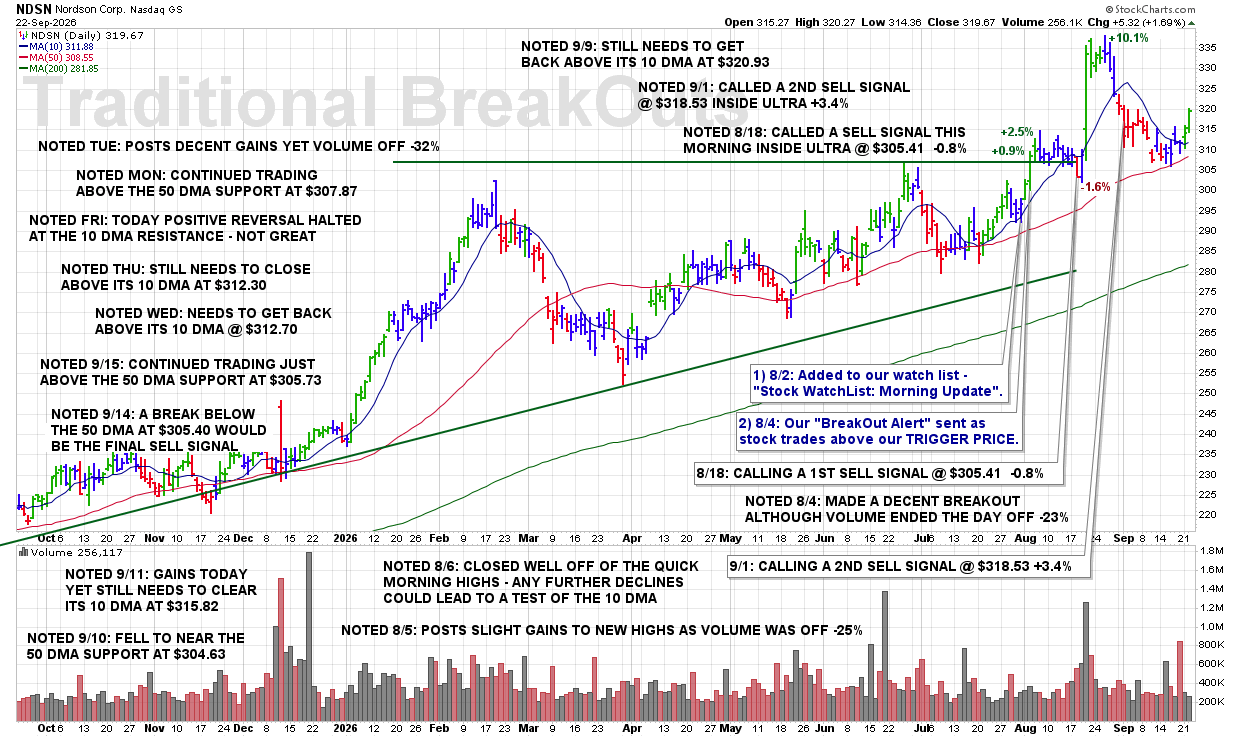
TUE 9/22: NDSN – Posts Decent Gains Yet Volume Off -32%

8:25 PM – Here is our latest chart update for this recent breakout from our Traditional BreakOuts Watch List

CLICK/TAP CHART TO ZOOM
Chart services courtesy of stockcharts.com. Annotations by James Taulman.

We are currently reporting on this stock as an active holding and continue to monitor the stock closely for any technical SELL SIGNALS.

The focus always remains on price/volume action around key support levels, including the 10 DMA, 50 DMA, and any nearby trendline or ROUND-$ support.

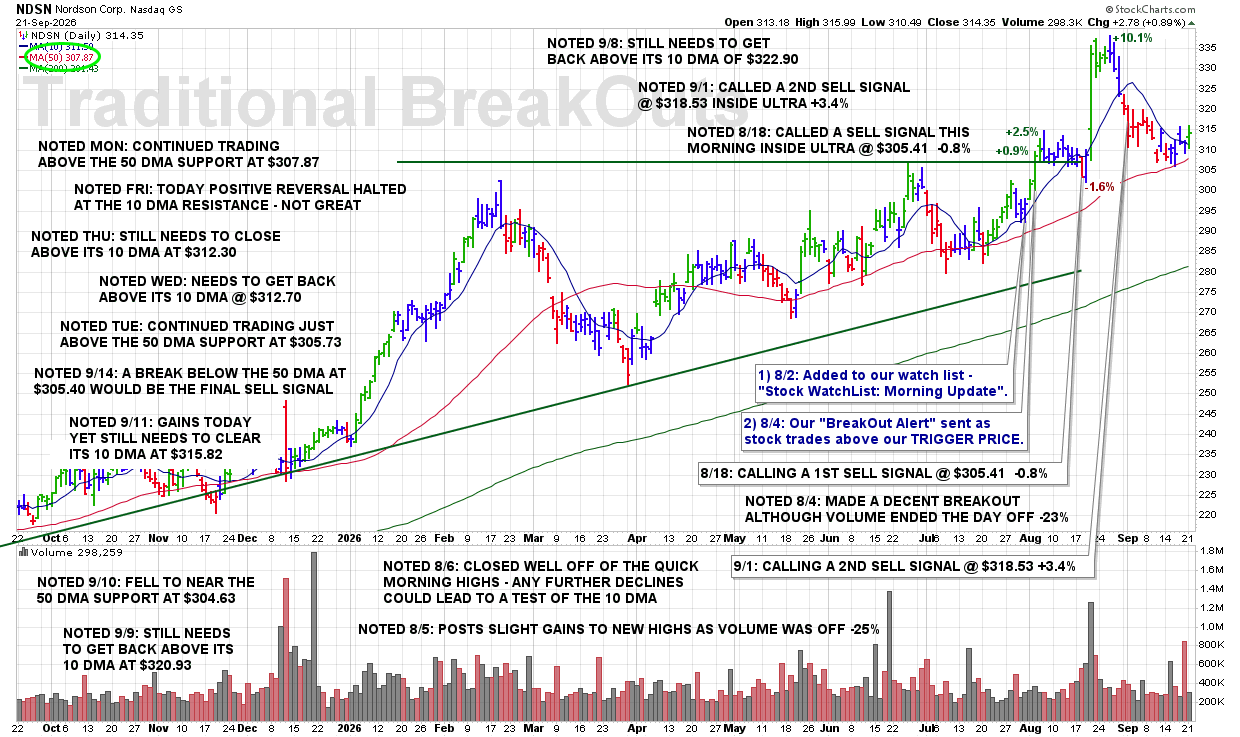
MON 9/21: NDSN – Continued Trading Above the 50 DMA Support at $307.87

8:05 PM – Here is our latest chart update for this recent breakout from our Traditional BreakOuts Watch List

CLICK/TAP CHART TO ZOOM
Chart services courtesy of stockcharts.com. Annotations by James Taulman.

We are currently reporting on this stock as an active holding and continue to monitor the stock closely for any technical SELL SIGNALS.

The focus always remains on price/volume action around key support levels, including the 10 DMA, 50 DMA, and any nearby trendline or ROUND-$ support.

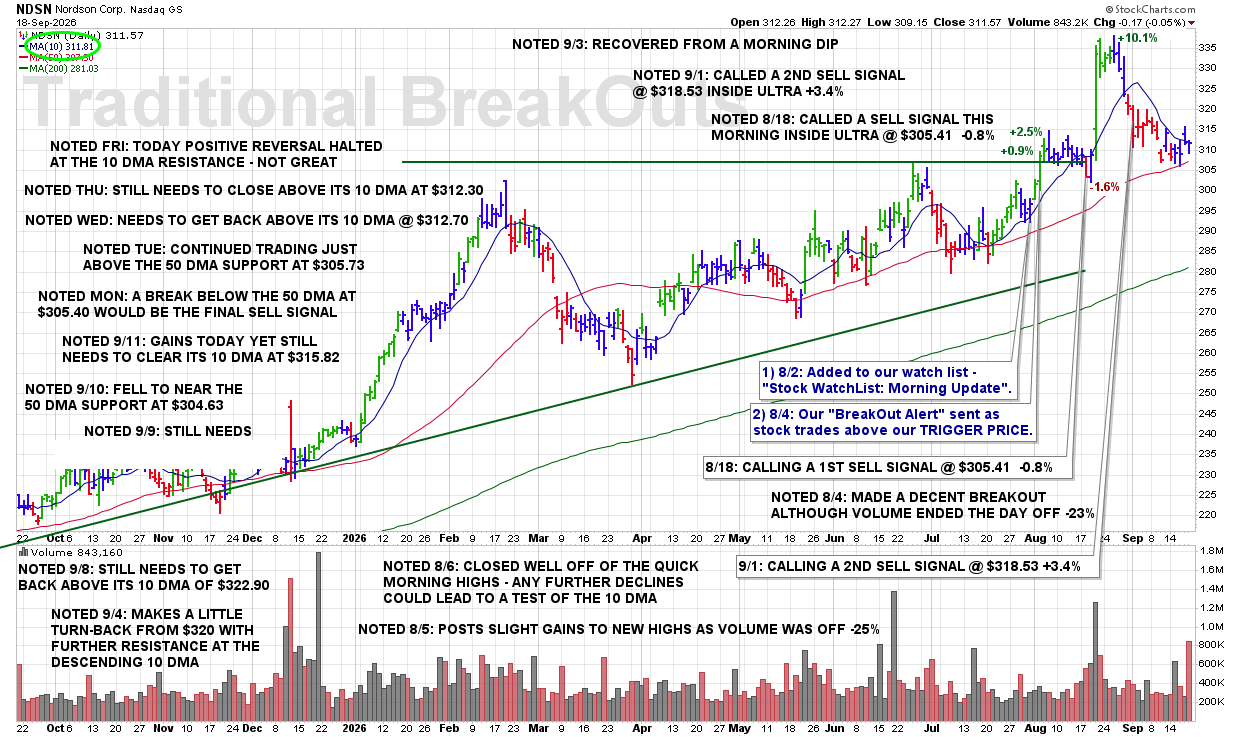
FRI 9/18 – NDSN – Today Positive Reversal Halted at the 10 DMA Resistance – Not Great

8:05 PM – Here is our latest chart update for this recent breakout from our Traditional BreakOuts Watch List

CLICK/TAP CHART TO ZOOM
Chart services courtesy of stockcharts.com. Annotations by James Taulman.

We are currently reporting on this stock as an active holding and continue to monitor the stock closely for any technical SELL SIGNALS.

The focus always remains on price/volume action around key support levels, including the 10 DMA, 50 DMA, and any nearby trendline or ROUND-$ support.

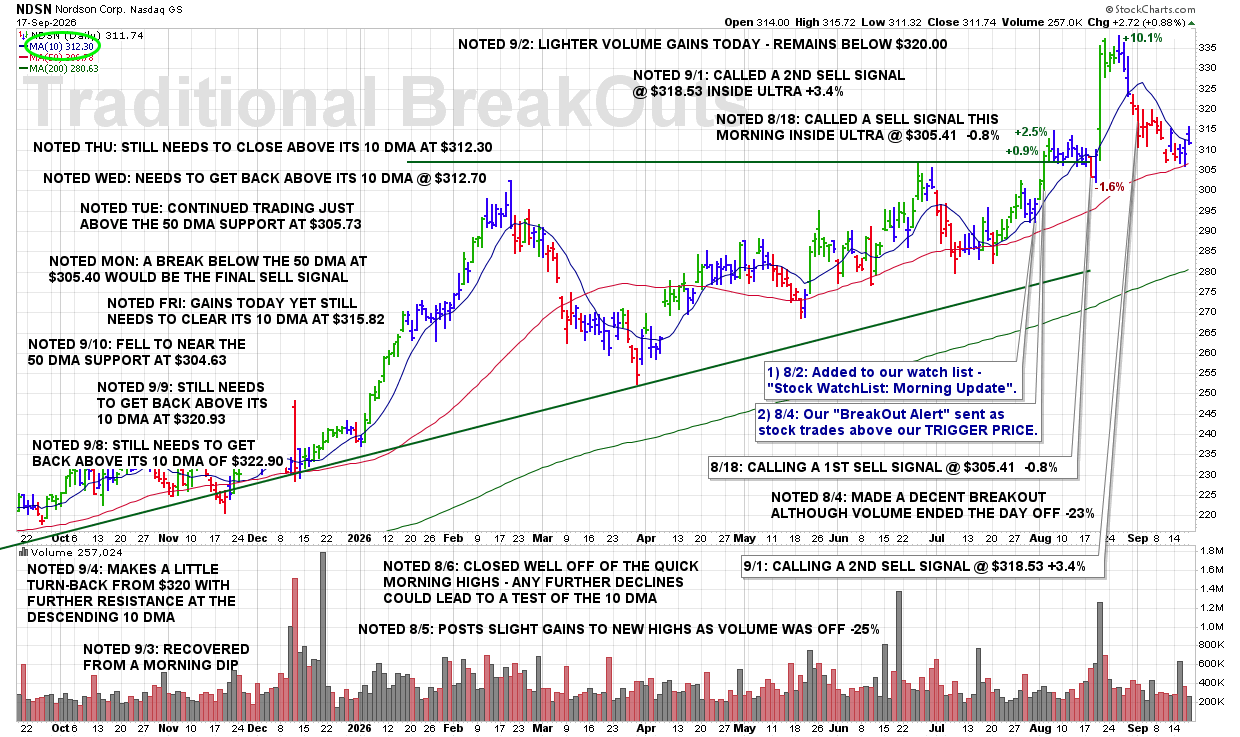
THU 9/17: NDSN – Still Needs to Close Above Its 10 DMA at $312.30

8:35 PM – Here is our latest chart update for this recent breakout from our Traditional BreakOuts Watch List

CLICK/TAP CHART TO ZOOM
Chart services courtesy of stockcharts.com. Annotations by James Taulman.

We are currently reporting on this stock as an active holding and continue to monitor the stock closely for any technical SELL SIGNALS.

The focus always remains on price/volume action around key support levels, including the 10 DMA, 50 DMA, and any nearby trendline or ROUND-$ support.

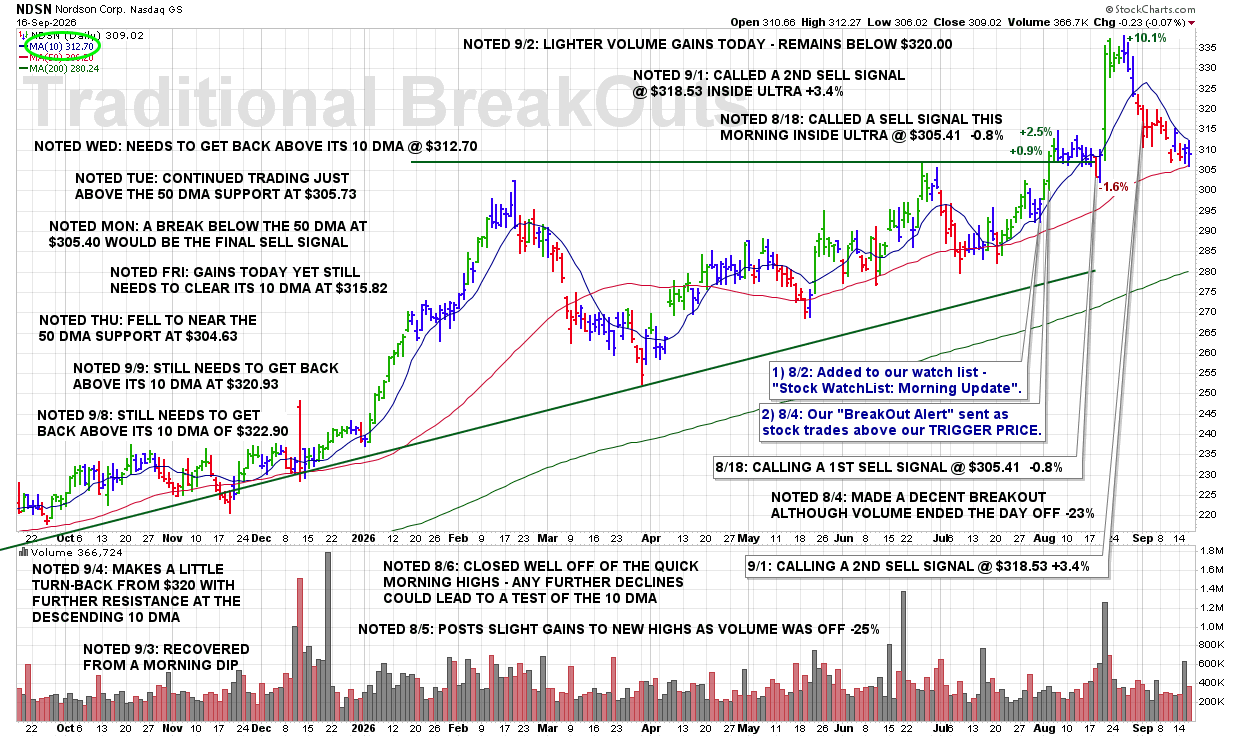
WED 9/16: NDSN – Needs to Get Back Above Its 10 DMA @ $312.70

8:20 PM – Here is our latest chart update for this recent breakout from our Traditional BreakOuts Watch List

CLICK/TAP CHART TO ZOOM
Chart services courtesy of stockcharts.com. Annotations by James Taulman.

We are currently reporting on this stock as an active holding and continue to monitor the stock closely for any technical SELL SIGNALS.

The focus always remains on price/volume action around key support levels, including the 10 DMA, 50 DMA, and any nearby trendline or ROUND-$ support.

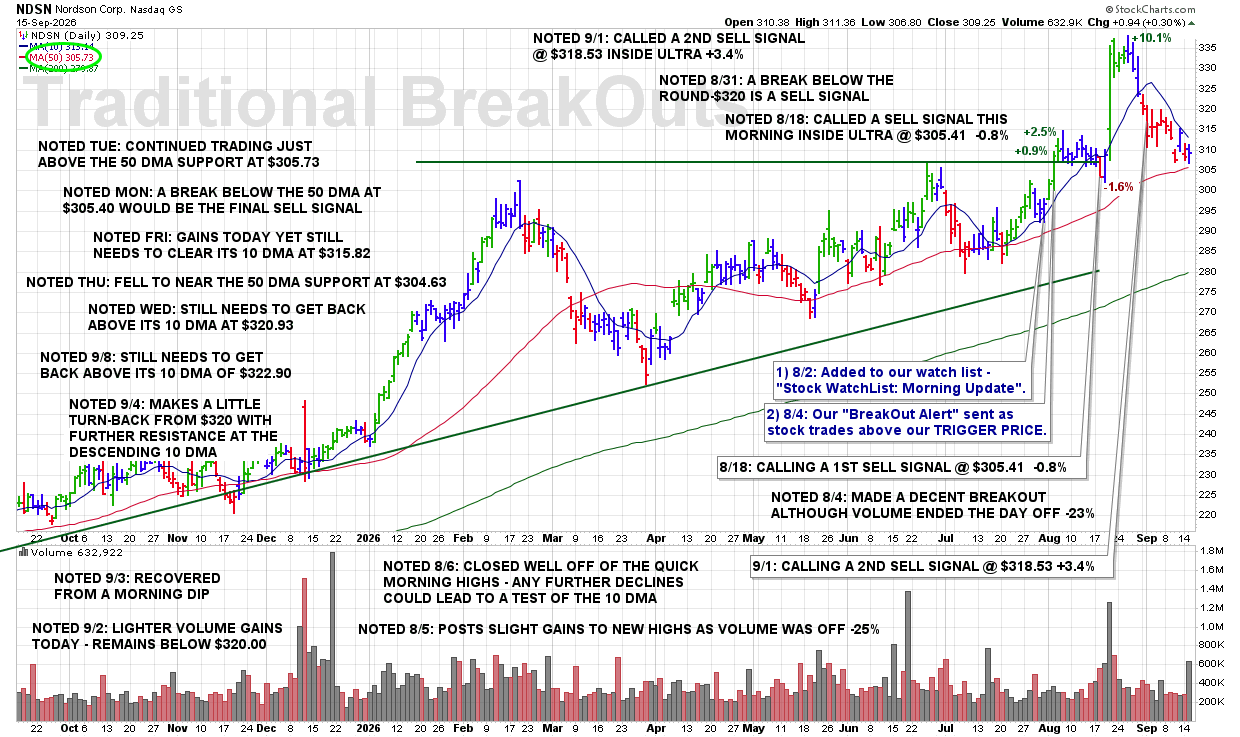
TUE 9/15: NDSN – Continued Trading Just Above the 50 DMA Support at $305.73

8:25 PM – Here is our latest chart update for this recent breakout from our Traditional BreakOuts Watch List

CLICK/TAP CHART TO ZOOM
Chart services courtesy of stockcharts.com. Annotations by James Taulman.

We are currently reporting on this stock as an active holding and continue to monitor the stock closely for any technical SELL SIGNALS.

The focus always remains on price/volume action around key support levels, including the 10 DMA, 50 DMA, and any nearby trendline or ROUND-$ support.

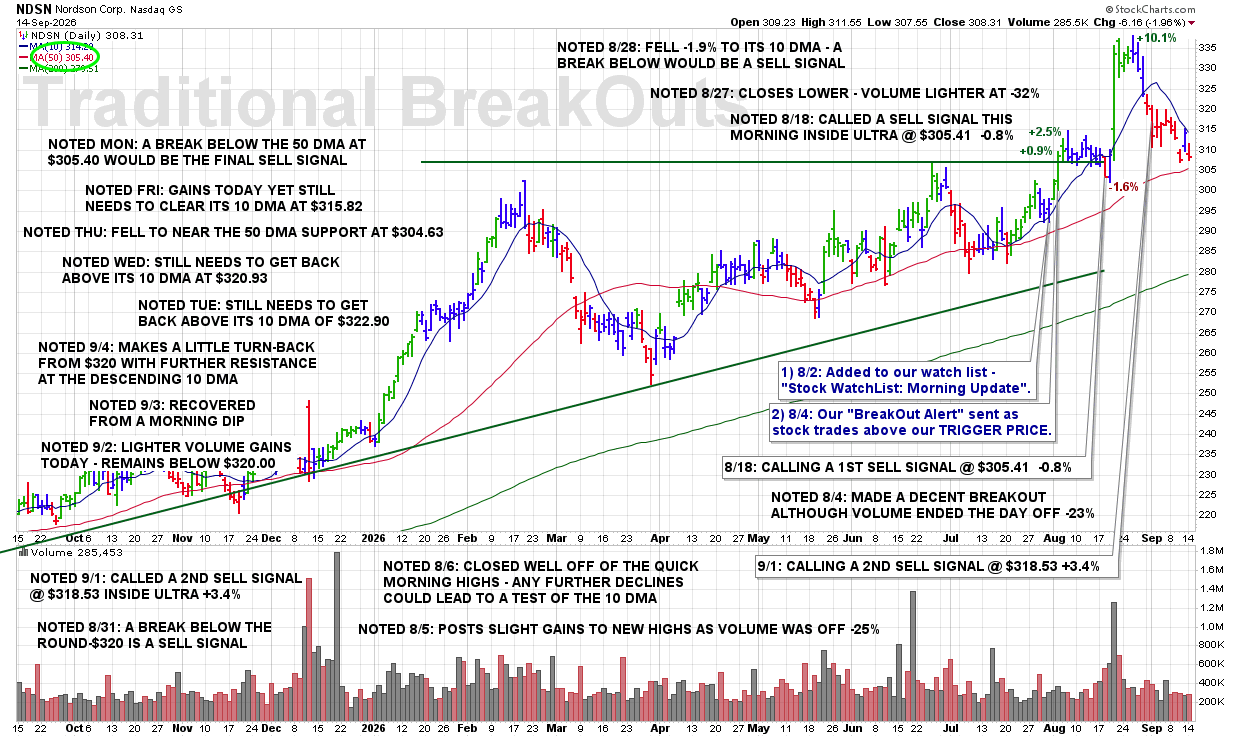
MON 9/14: NDSN – A Break Below the 50 DMA at $305.40 Would Be the Final Sell Signal

8:55 PM – Here is our latest chart update for this recent breakout from our Traditional BreakOuts Watch List

CLICK/TAP CHART TO ZOOM
Chart services courtesy of stockcharts.com. Annotations by James Taulman.

We are currently reporting on this stock as an active holding and continue to monitor the stock closely for any technical SELL SIGNALS.

The focus always remains on price/volume action around key support levels, including the 10 DMA, 50 DMA, and any nearby trendline or ROUND-$ support.

FRI 9/11: NDSN – Gains Today Yet Still Needs to Clear Its 10 DMA at $315.82

8:45 PM – Here is our latest chart update for this recent breakout from our Traditional BreakOuts Watch List

CLICK/TAP CHART TO ZOOM
Chart services courtesy of stockcharts.com. Annotations by James Taulman.

We are currently reporting on this stock as an active holding and continue to monitor the stock closely for any technical SELL SIGNALS.

The focus always remains on price/volume action around key support levels, including the 10 DMA, 50 DMA, and any nearby trendline or ROUND-$ support.

THU 9/10: NDSN – Fell to Near the 50 DMA Support at $304.63

8:45 PM – Here is our latest chart update for this recent breakout from our Traditional BreakOuts Watch List

CLICK/TAP CHART TO ZOOM
Chart services courtesy of stockcharts.com. Annotations by James Taulman.

We are currently reporting on this stock as an active holding and continue to monitor the stock closely for any technical SELL SIGNALS.

The focus always remains on price/volume action around key support levels, including the 10 DMA, 50 DMA, and any nearby trendline or ROUND-$ support.

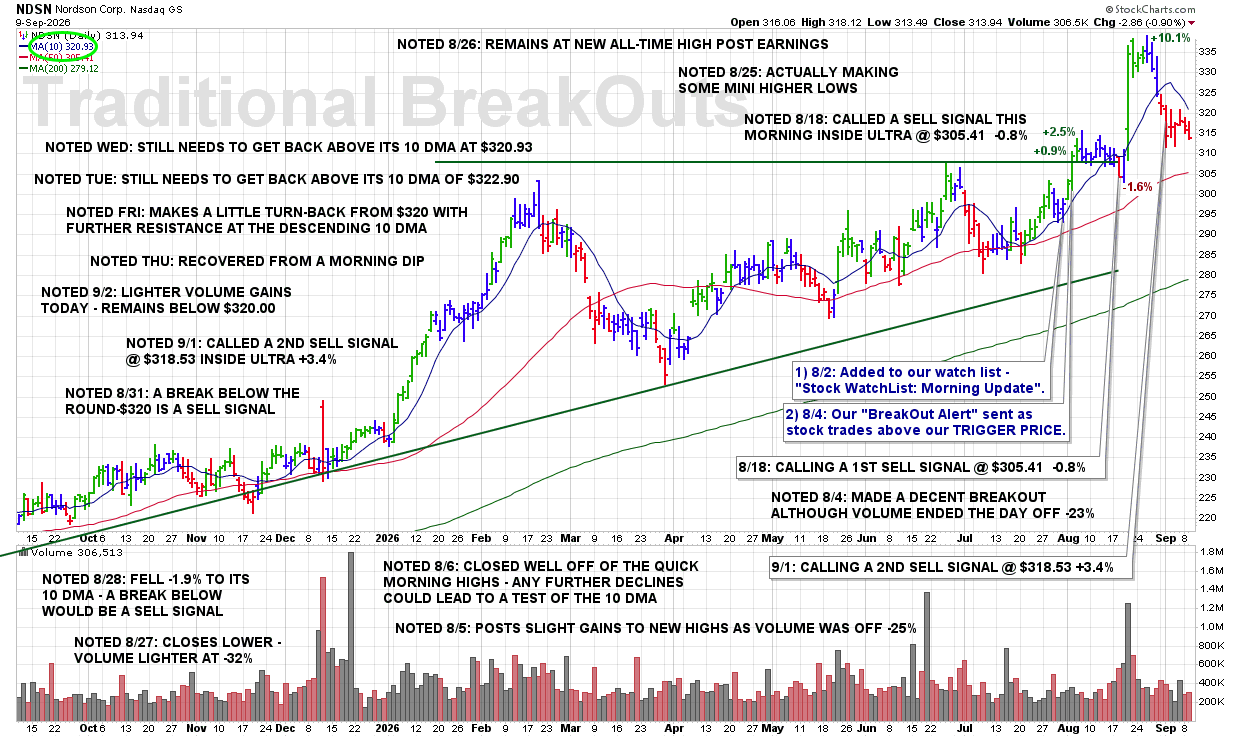
WED 9/9: NDSN – Still Needs to Get Back Above Its 10 DMA at $320.93

8:45 PM – Here is our latest chart update for this recent breakout from our Traditional BreakOuts Watch List

CLICK/TAP CHART TO ZOOM
Chart services courtesy of stockcharts.com. Annotations by James Taulman.

We are currently reporting on this stock as an active holding and continue to monitor the stock closely for any technical SELL SIGNALS.

The focus always remains on price/volume action around key support levels, including the 10 DMA, 50 DMA, and any nearby trendline or ROUND-$ support.

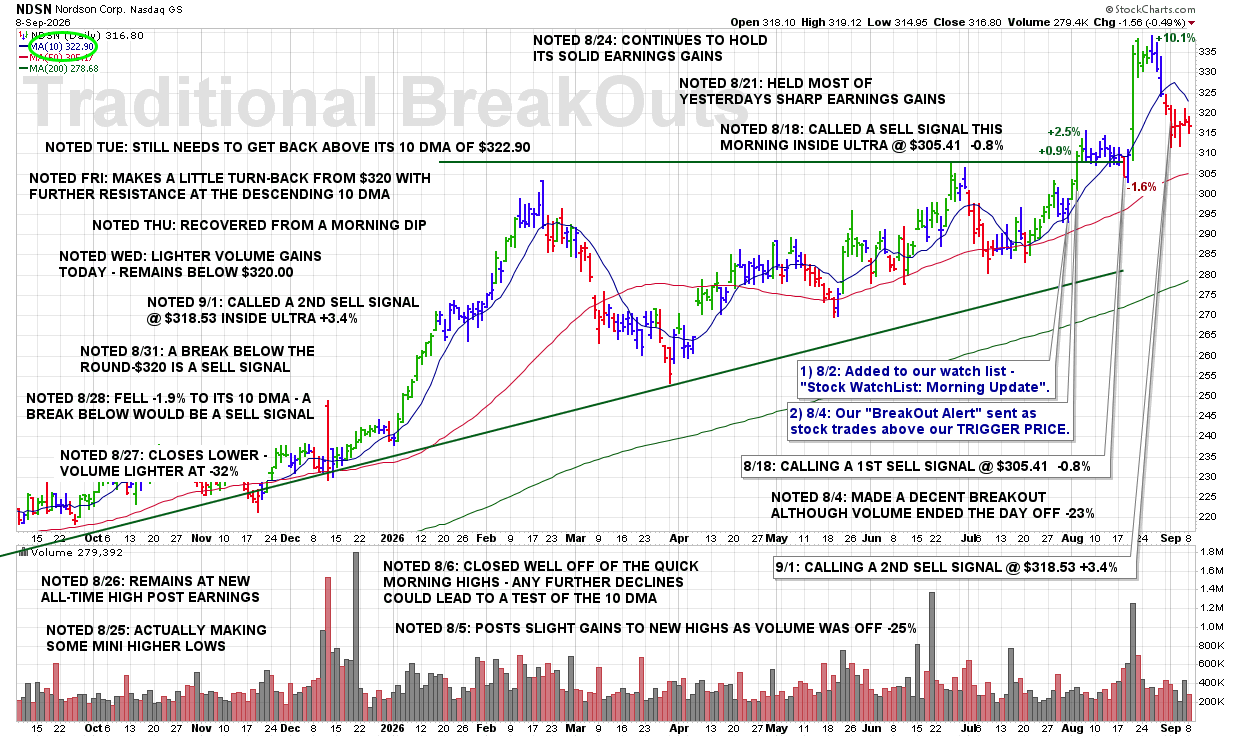
TUE 9/8: NDSN – Still Needs to Get Back Above Its 10 DMA of $322.90

9:15 PM – Here is our latest chart update for this recent breakout from our Traditional BreakOuts Watch List

CLICK/TAP CHART TO ZOOM
Chart services courtesy of stockcharts.com. Annotations by James Taulman.

We are currently reporting on this stock as an active holding and continue to monitor the stock closely for any technical SELL SIGNALS.

The focus always remains on price/volume action around key support levels, including the 10 DMA, 50 DMA, and any nearby trendline or ROUND-$ support.

FRI 9/4: NDSN – Makes a Little Turn-Back From $320 With Further Resistance at the Descending 10 DMA

8:20 PM – Here is our latest chart update for this recent breakout from our Traditional BreakOuts Watch List

CLICK/TAP CHART TO ZOOM
Chart services courtesy of stockcharts.com. Annotations by James Taulman.

We are currently reporting on this stock as an active holding and continue to monitor the stock closely for any technical SELL SIGNALS.

The focus always remains on price/volume action around key support levels, including the 10 DMA, 50 DMA, and any nearby trendline or ROUND-$ support.

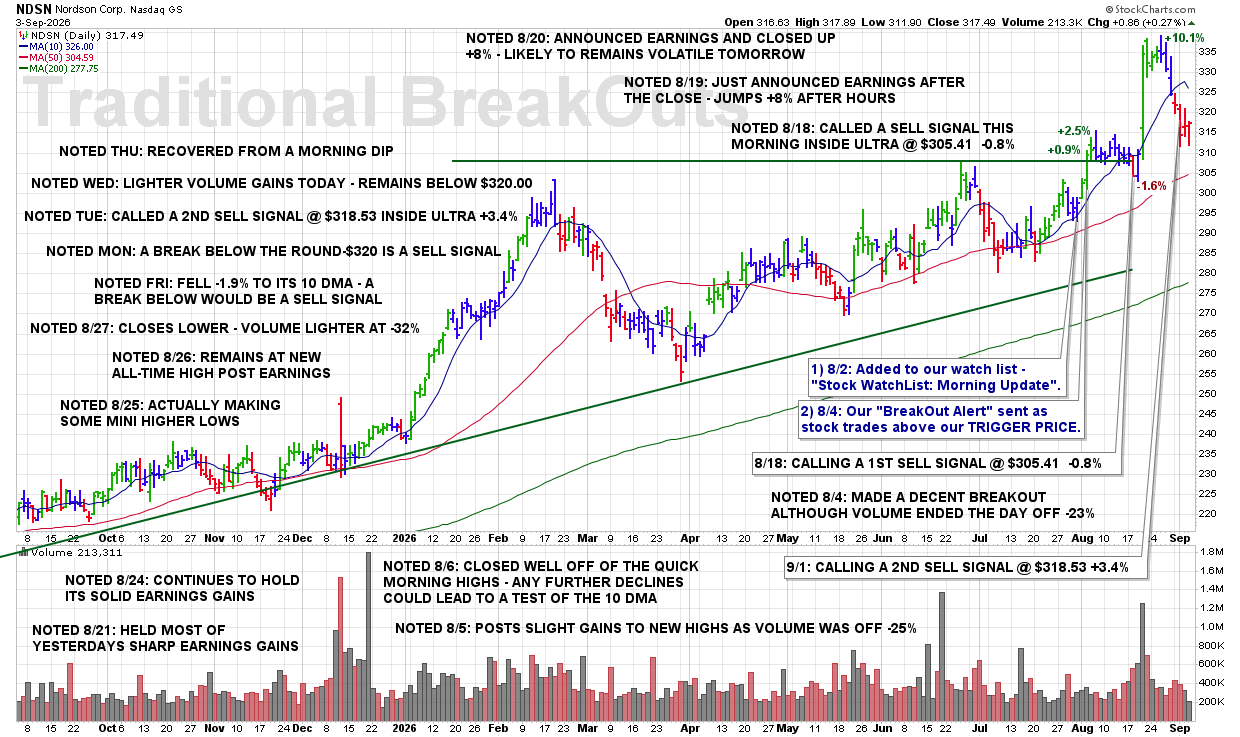
THU 9/3: NDSN – Recovered From a Morning Dip

8:50 PM – Here is our latest chart update for this recent breakout from our Traditional BreakOuts Watch List

CLICK/TAP CHART TO ZOOM
Chart services courtesy of stockcharts.com. Annotations by James Taulman.

We are currently reporting on this stock as an active holding and continue to monitor the stock closely for any technical SELL SIGNALS.

The focus always remains on price/volume action around key support levels, including the 10 DMA, 50 DMA, and any nearby trendline or ROUND-$ support.

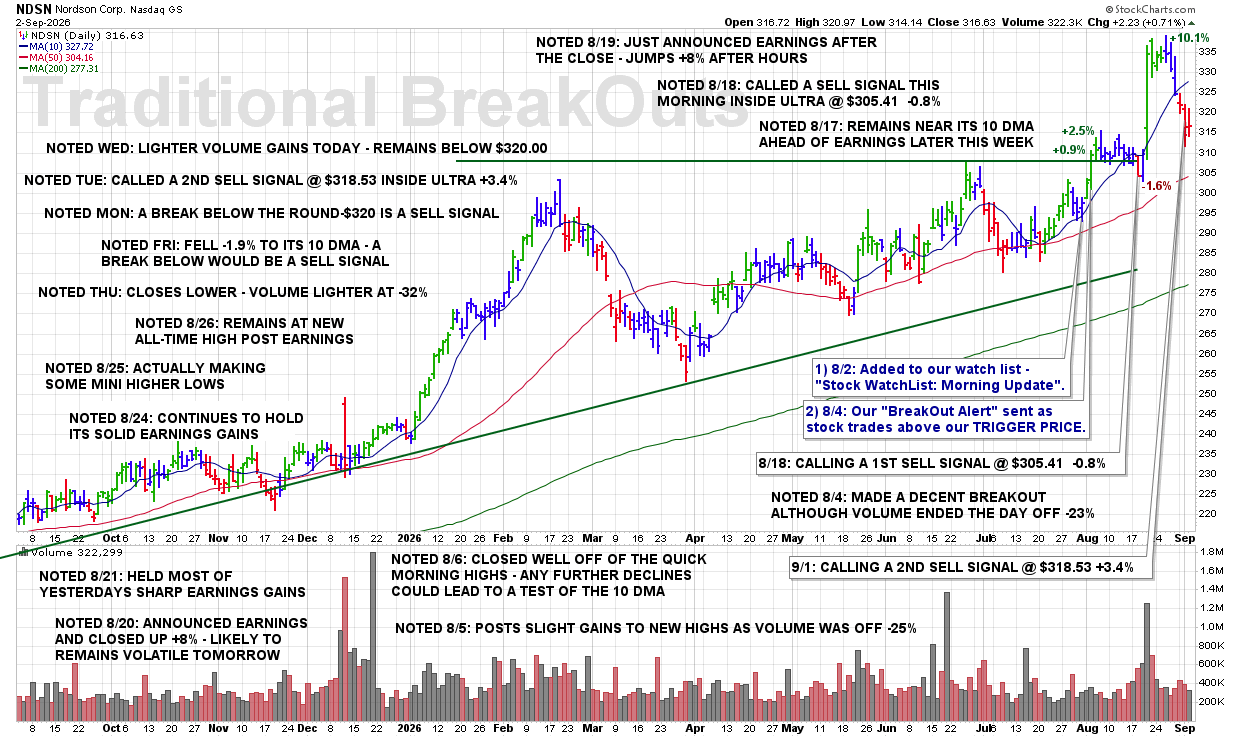
WED 9/2: NDSN – Lighter Volume Gains Today – Remains Below $320.00

8:50 PM – Here is our latest chart update for this recent breakout from our Traditional BreakOuts Watch List

CLICK/TAP CHART TO ZOOM
Chart services courtesy of stockcharts.com. Annotations by James Taulman.

We are currently reporting on this stock as an active holding and continue to monitor the stock closely for any technical SELL SIGNALS.

The focus always remains on price/volume action around key support levels, including the 10 DMA, 50 DMA, and any nearby trendline or ROUND-$ support.

TUE 9/1: NDSN – Called a Second SELL SIGNAL as Price Fell Below $320.00

9:27 PM – Called a 2ND SELL SIGNAL this morning as shares broke below the ROUND-$320 level with what was, at the time, an increase in volume. This follows Monday’s bearish action when the stock closed below its 10 DMA. We are now seeing mounting technical weakness with multiple support violations developing.

Longer term, NDSN does remain in an overall uptrend, but the shorter-term deterioration is enough to warrant this second SELL SIGNAL. Under the guidelines, and 1/3 position remains.

As noted just in last evenings Nighty Chart Updates – A Break Below the Round-$320 Is a Sell Signal

ULTRA Trader’s Tip: Separate the Short-Term Signal From the Long-Term Trend

• A stock can remain in a longer-term uptrend while still developing meaningful short-term weakness.

• Losing the 10 DMA followed by a break below ROUND-$320 shows that the bearish evidence is building.

• Scaling out as technical violations accumulate allows us to protect gains without ignoring the stock’s broader trend.

CLICK/TAP CHART TO ZOOM
Chart services courtesy of stockcharts.com. Annotations by James Taulman.

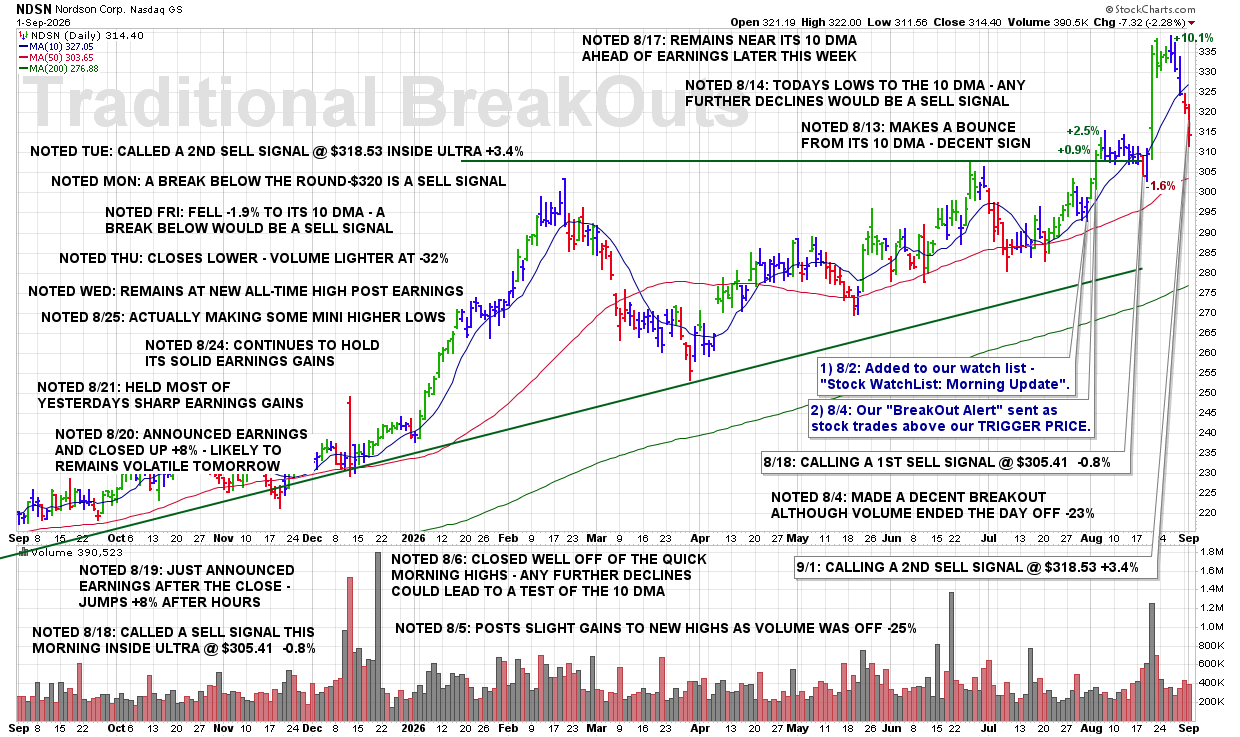
TUE 9/1: NDSN – Called a 2nd Sell Signal @ $318.53 Inside Ultra +3.4%

8:50 PM – Here is our latest chart update for this recent breakout from our Traditional BreakOuts Watch List

CLICK/TAP CHART TO ZOOM
Chart services courtesy of stockcharts.com. Annotations by James Taulman.

We are currently reporting on this stock as an active holding and continue to monitor the stock closely for any technical SELL SIGNALS.

The focus always remains on price/volume action around key support levels, including the 10 DMA, 50 DMA, and any nearby trendline or ROUND-$ support.

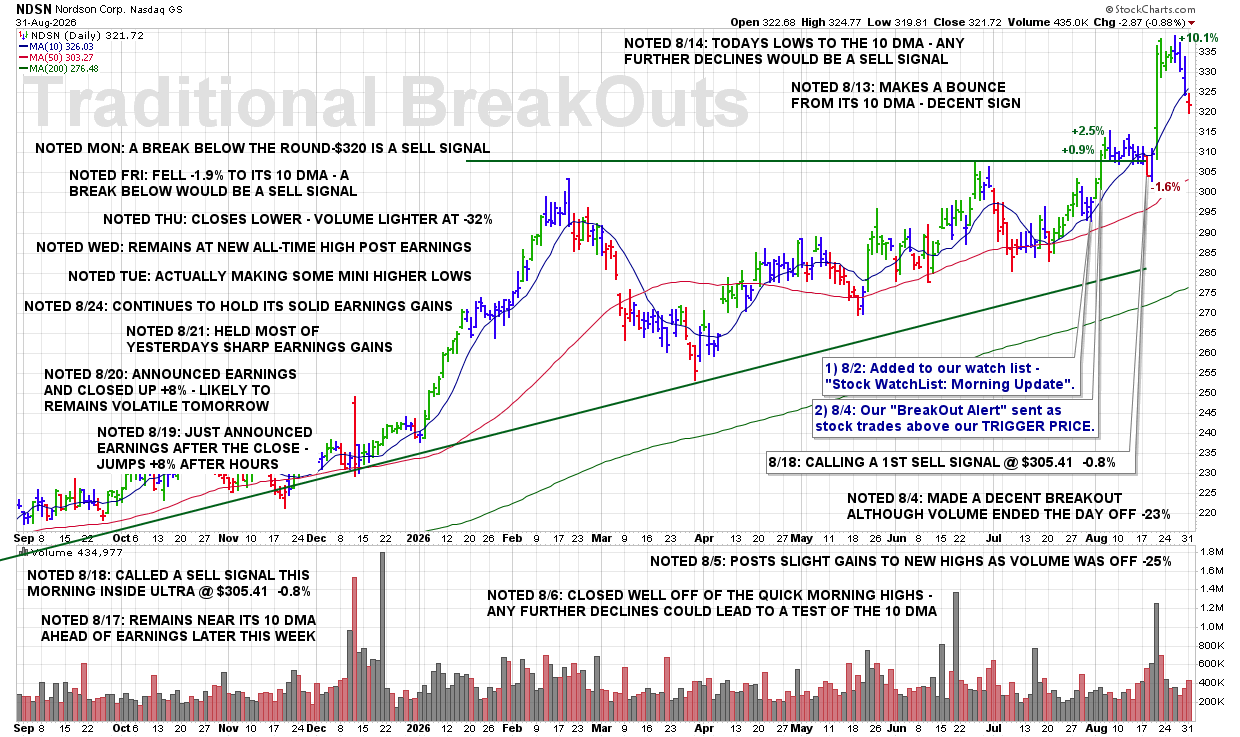
MON 8/31: NDSN – A Break Below the Round-$320 Is a Sell Signal

9:20 PM – Here is our latest chart update for this recent breakout from our Traditional BreakOuts Watch List

CLICK/TAP CHART TO ZOOM
Chart services courtesy of stockcharts.com. Annotations by James Taulman.

We are currently reporting on this stock as an active holding and continue to monitor the stock closely for any technical SELL SIGNALS.

The focus always remains on price/volume action around key support levels, including the 10 DMA, 50 DMA, and any nearby trendline or ROUND-$ support.

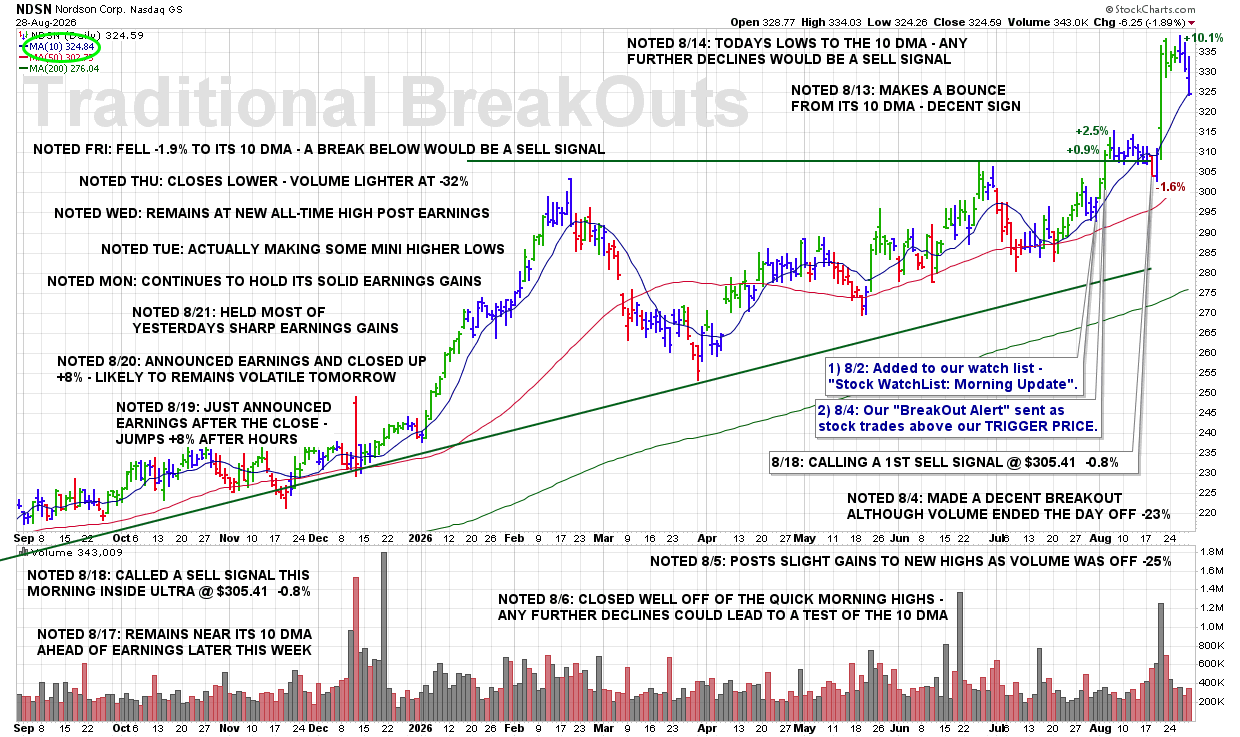
FRI 8/28: NDSN – Fell -1.9% to Its 10 DMA – a Break Below Would Be a Sell Signal

8:50 PM – Here is our latest chart update for this recent breakout from our Traditional BreakOuts Watch List

CLICK/TAP CHART TO ZOOM
Chart services courtesy of stockcharts.com. Annotations by James Taulman.

We are currently reporting on this stock as an active holding and continue to monitor the stock closely for any technical SELL SIGNALS.

The focus always remains on price/volume action around key support levels, including the 10 DMA, 50 DMA, and any nearby trendline or ROUND-$ support.

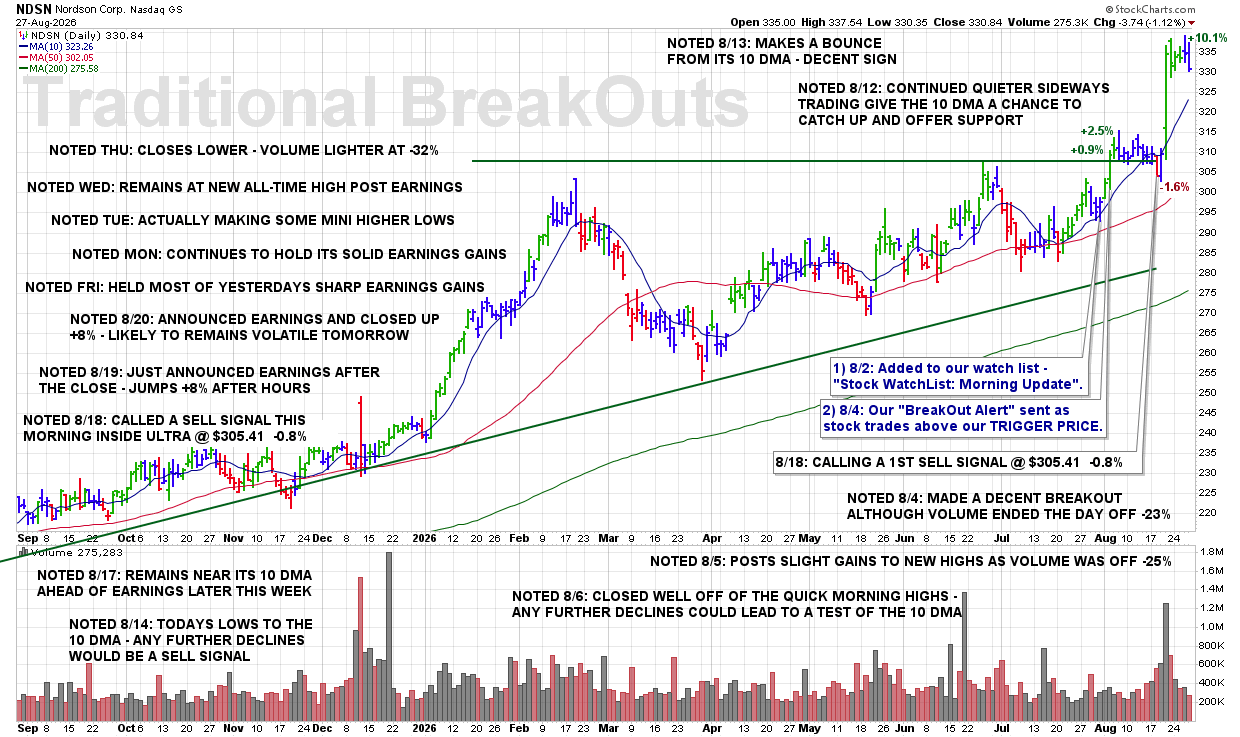
THU 8/27: NDSN – Closes Lower – Volume Lighter at -32%

8:20 PM – Here is our latest chart update for this recent breakout from our Traditional BreakOuts Watch List

CLICK/TAP CHART TO ZOOM
Chart services courtesy of stockcharts.com. Annotations by James Taulman.

We are currently reporting on this stock as an active holding and continue to monitor the stock closely for any technical SELL SIGNALS.

The focus always remains on price/volume action around key support levels, including the 10 DMA, 50 DMA, and any nearby trendline or ROUND-$ support.

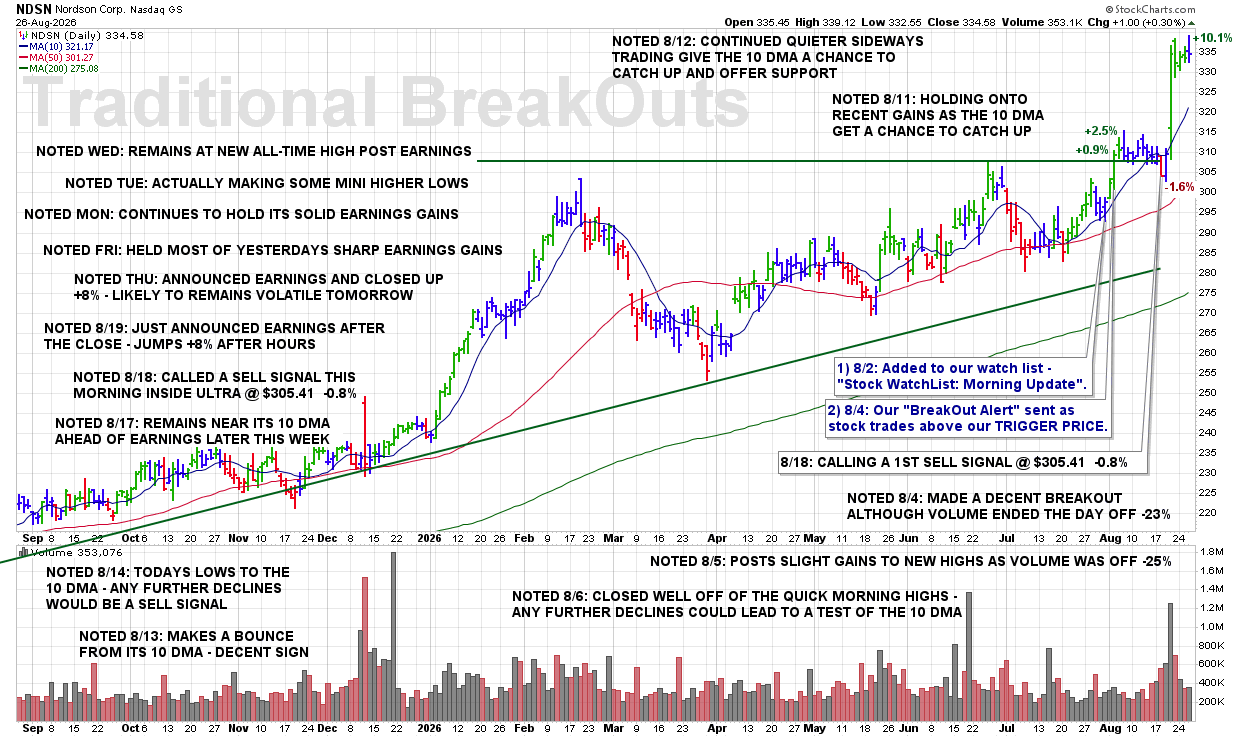
WED 8/26: NDSN – Remains at New All-Time High Post Earnings

8:50 PM – Here is our latest chart update for this recent breakout from our Traditional BreakOuts Watch List

CLICK/TAP CHART TO ZOOM
Chart services courtesy of stockcharts.com. Annotations by James Taulman.

We are currently reporting on this stock as an active holding and continue to monitor the stock closely for any technical SELL SIGNALS.

The focus always remains on price/volume action around key support levels, including the 10 DMA, 50 DMA, and any nearby trendline or ROUND-$ support.

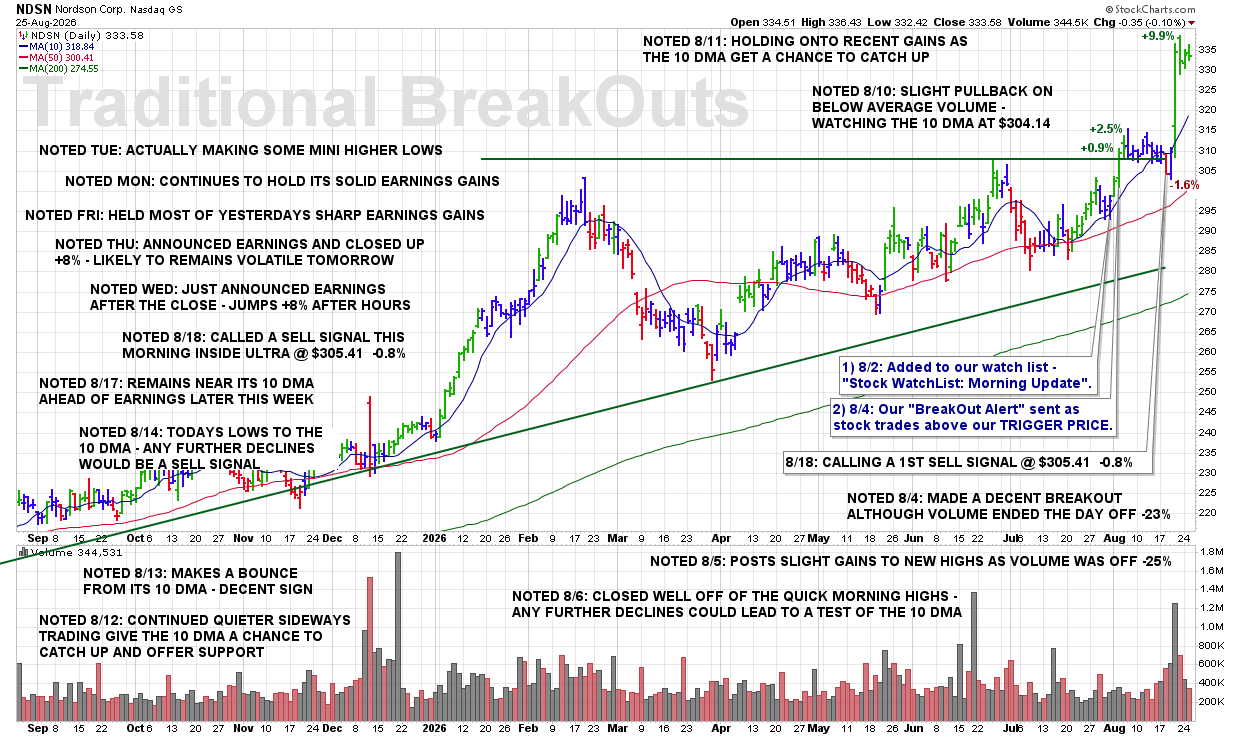
TUE 8/25: NDSN – Actually Making Some Mini Higher Lows

8:20 PM – Here is our latest chart update for this recent breakout from our Traditional BreakOuts Watch List

CLICK/TAP CHART TO ZOOM
Chart services courtesy of stockcharts.com. Annotations by James Taulman.

We are currently reporting on this stock as an active holding and continue to monitor the stock closely for any technical SELL SIGNALS.

The focus always remains on price/volume action around key support levels, including the 10 DMA, 50 DMA, and any nearby trendline or ROUND-$ support.

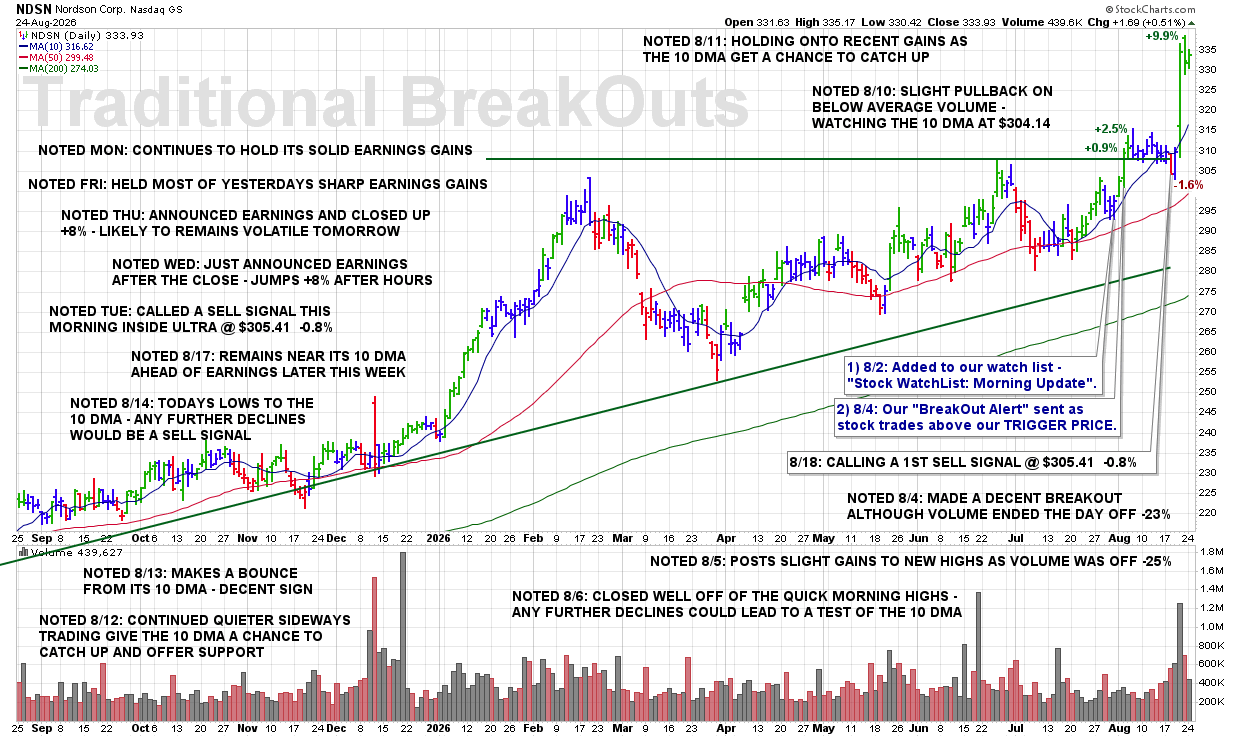
MON 8/24: NDSN – Continues to Hold Its Solid Earnings Gains

8:20 PM – Here is our latest chart update for this recent breakout from our Traditional BreakOuts Watch List

CLICK/TAP CHART TO ZOOM
Chart services courtesy of stockcharts.com. Annotations by James Taulman.

We are currently reporting on this stock as an active holding and continue to monitor the stock closely for any technical SELL SIGNALS.

The focus always remains on price/volume action around key support levels, including the 10 DMA, 50 DMA, and any nearby trendline or ROUND-$ support.

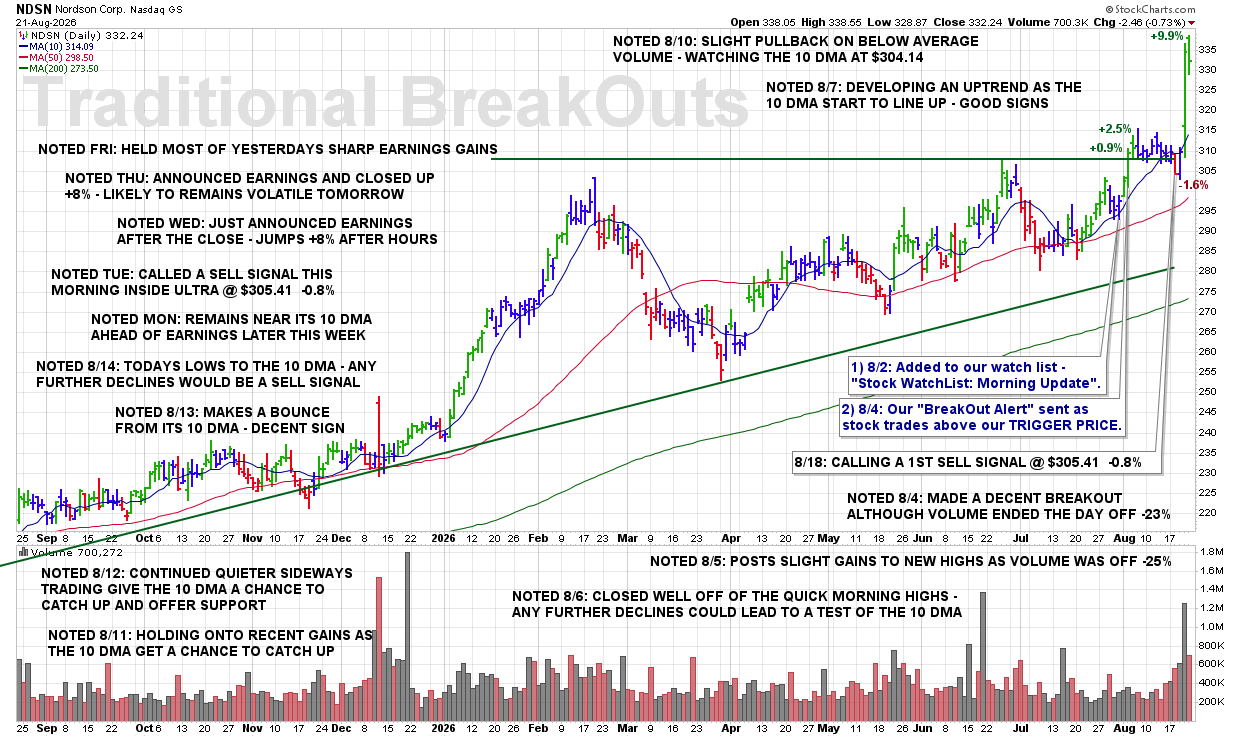
FRI 8/21: NDSN – Held Most of Yesterdays Sharp Earnings Gains

8:50 PM – Here is our latest chart update for this recent breakout from our Traditional BreakOuts Watch List

CLICK/TAP CHART TO ZOOM
Chart services courtesy of stockcharts.com. Annotations by James Taulman.

We are currently reporting on this stock as an active holding and continue to monitor the stock closely for any technical SELL SIGNALS.

The focus always remains on price/volume action around key support levels, including the 10 DMA, 50 DMA, and any nearby trendline or ROUND-$ support.

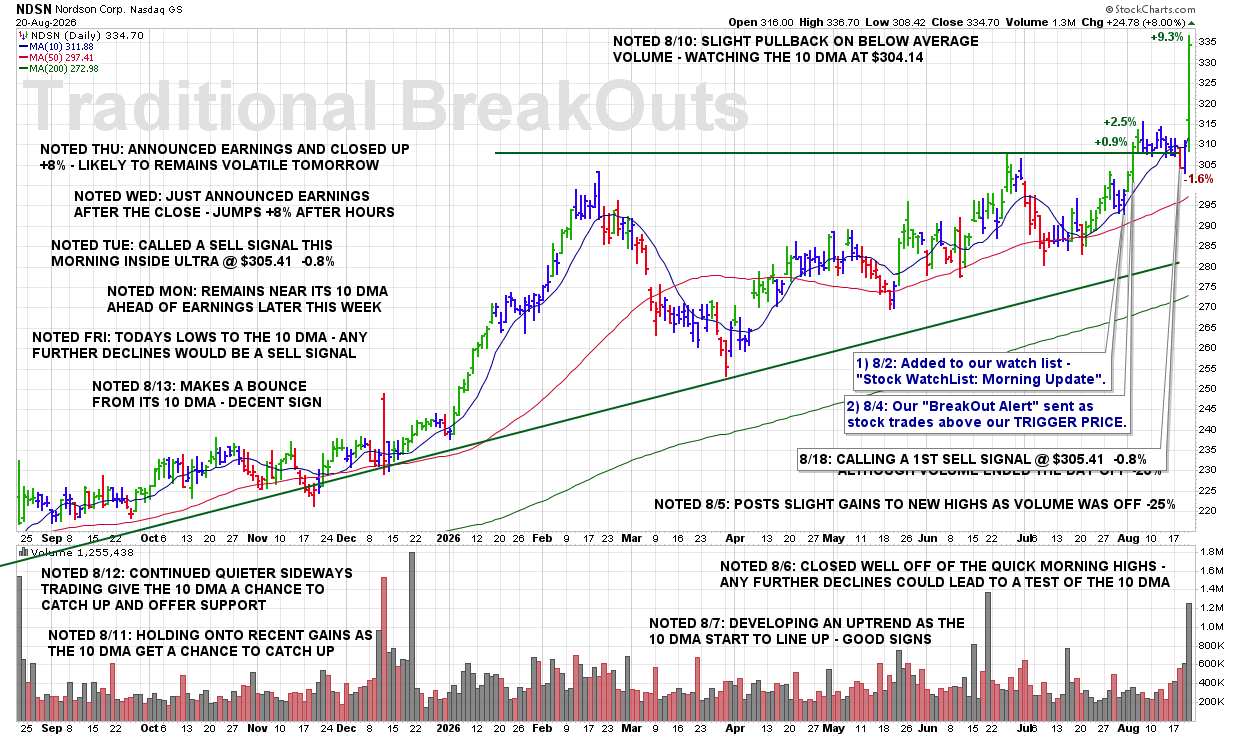
THU 8/20: NDSN – Announced Earnings and Closed Up +8% – Likely to Remains Volatile Tomorrow

8:20 PM – Here is our latest chart update for this recent breakout from our Traditional BreakOuts Watch List

CLICK/TAP CHART TO ZOOM
Chart services courtesy of stockcharts.com. Annotations by James Taulman.

We are currently reporting on this stock as an active holding and continue to monitor the stock closely for any technical SELL SIGNALS.

The focus always remains on price/volume action around key support levels, including the 10 DMA, 50 DMA, and any nearby trendline or ROUND-$ support.

WED 8/19: NDSN – Just Announced Earnings After the Close – Jumps +8% After Hours

9:20 PM – Here is our latest chart update for this recent breakout from our Traditional BreakOuts Watch List

CLICK/TAP CHART TO ZOOM
Chart services courtesy of stockcharts.com. Annotations by James Taulman.

We are currently reporting on this stock as an active holding and continue to monitor the stock closely for any technical SELL SIGNALS.

The focus always remains on price/volume action around key support levels, including the 10 DMA, 50 DMA, and any nearby trendline or ROUND-$ support.

TUE 8/18: NDSN – Called a Sell Signal This Morning Inside Ultra @ $305.41 -0.8%

9:20 PM – Here is our latest chart update for this recent breakout from our Traditional BreakOuts Watch List

CLICK/TAP CHART TO ZOOM
Chart services courtesy of stockcharts.com. Annotations by James Taulman.

We are currently reporting on this stock as an active holding and continue to monitor the stock closely for any technical SELL SIGNALS.

The focus always remains on price/volume action around key support levels, including the 10 DMA, 50 DMA, and any nearby trendline or ROUND-$ support.

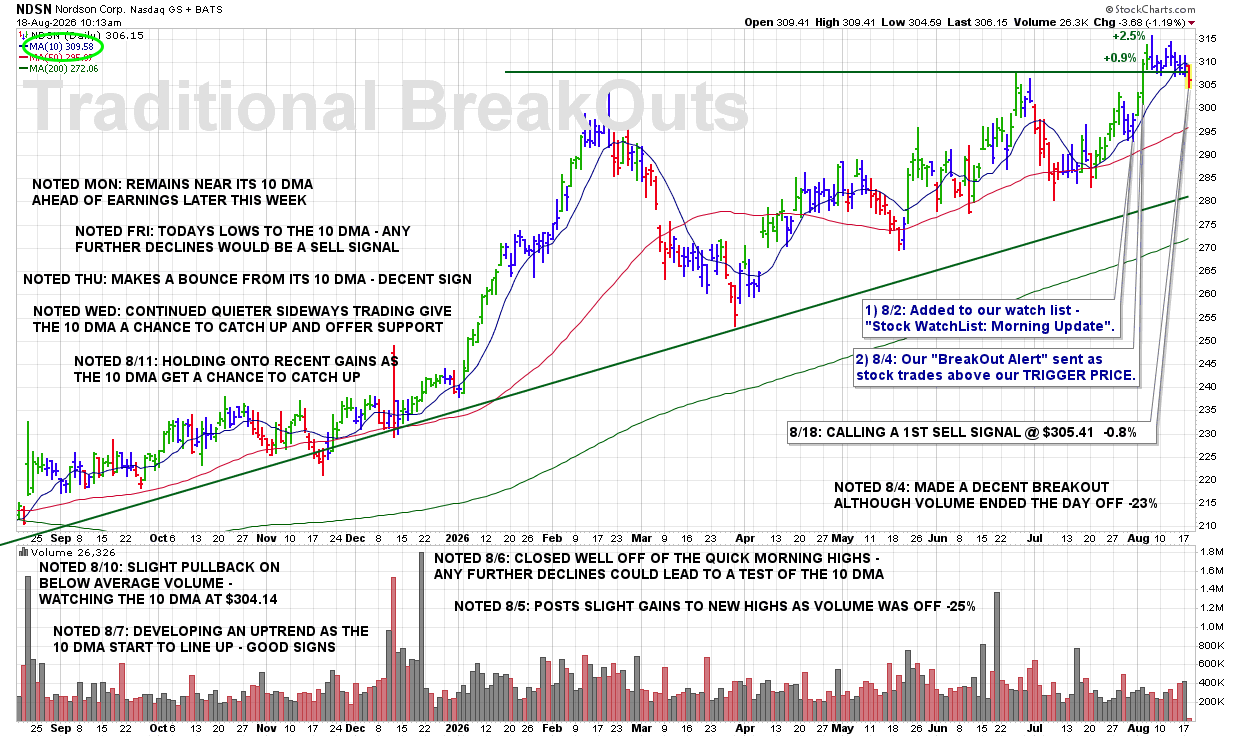
TUE 8/18: NDSN – CALLING A 1ST SELL SIGNAL @ $305.41 -0.8%

10:05 AM – Calling a 1ST SELL SIGNAL this morning on NDSN as shares have been developing a series of lower highs and are now clearly breaking below the 10 DMA. That break represents a technical violation and triggers a standard SELL SIGNAL under our rules.

ULTRA Trader’s Tip: Lower Highs Often Warn Before the Break

  • A series of lower highs shows that each rally attempt is losing strength.

  • Once price then breaks below the 10 DMA, the weakening pattern becomes more significant.

  • Recognizing deterioration early allows you to reduce exposure before additional technical damage develops.

CLICK/TAP CHART TO ZOOM
Chart services courtesy of stockcharts.com. Annotations by James Taulman.

TUE 8/18: NDSN – SELLING (ALL) P/L: -$76.33 -0.76%

9:56 AM – Selling all of my NDSN here this morning as shares have been developing a series of lower highs and are now clearly breaking below the 10 DMA. With bearish technical action continuing to build, I’m taking this very small loss and moving on rather than waiting for possible additional deterioration.

James’ Trader’s Tip: Small Losses Are Part of the System

  • Not every BUY SIGNAL will develop into a winning trade.

  • When the technical evidence changes, there is no reason to stay committed to the original decision.

  • Taking a small loss quickly keeps capital available for the next opportunity and prevents an insignificant loss from becoming significant.

CLICK/TAP CHART TO ZOOM
Chart services courtesy of stockcharts.com. Annotations by James Taulman.

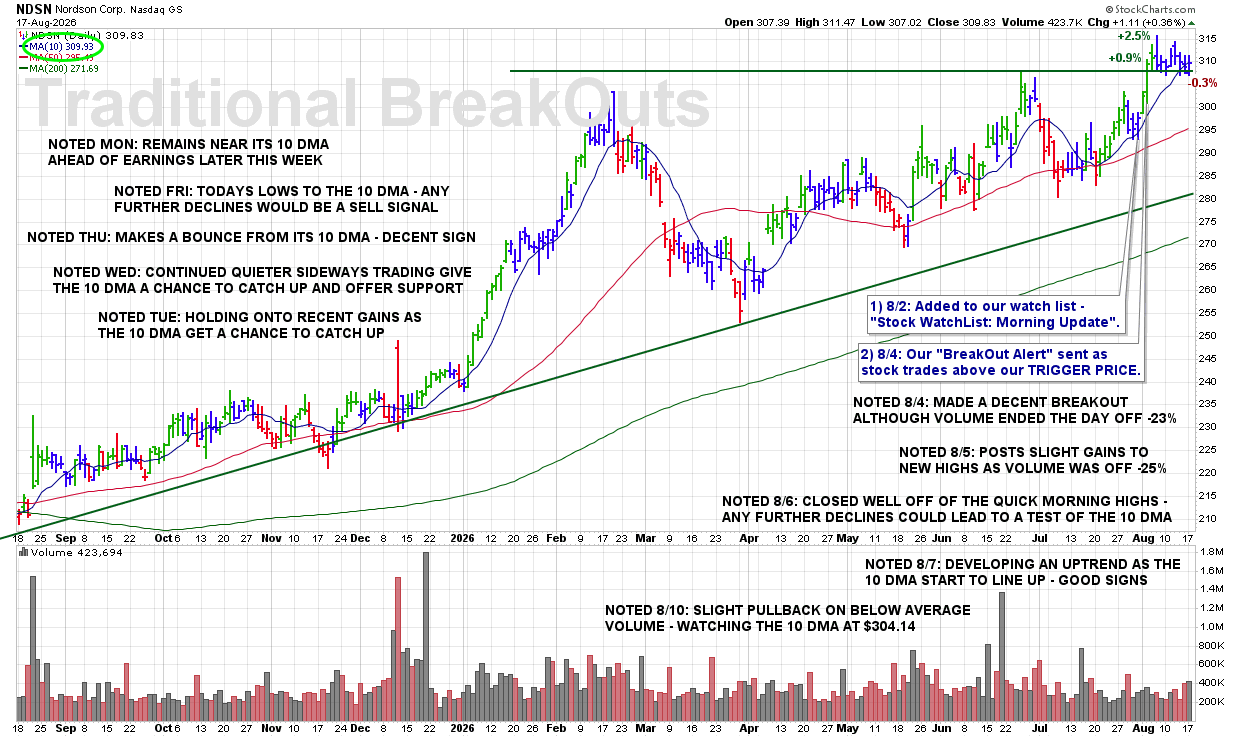
MON 8/17: NDSN – Remains Near Its 10 DMA Ahead of Earnings Later This Week

8:55 PM – Here is our latest chart update for this recent breakout from our Traditional BreakOuts Watch List

CLICK/TAP CHART TO ZOOM
Chart services courtesy of stockcharts.com. Annotations by James Taulman.

We are currently reporting on this stock as an active holding and continue to monitor the stock closely for any technical SELL SIGNALS.

The focus always remains on price/volume action around key support levels, including the 10 DMA, 50 DMA, and any nearby trendline or ROUND-$ support.

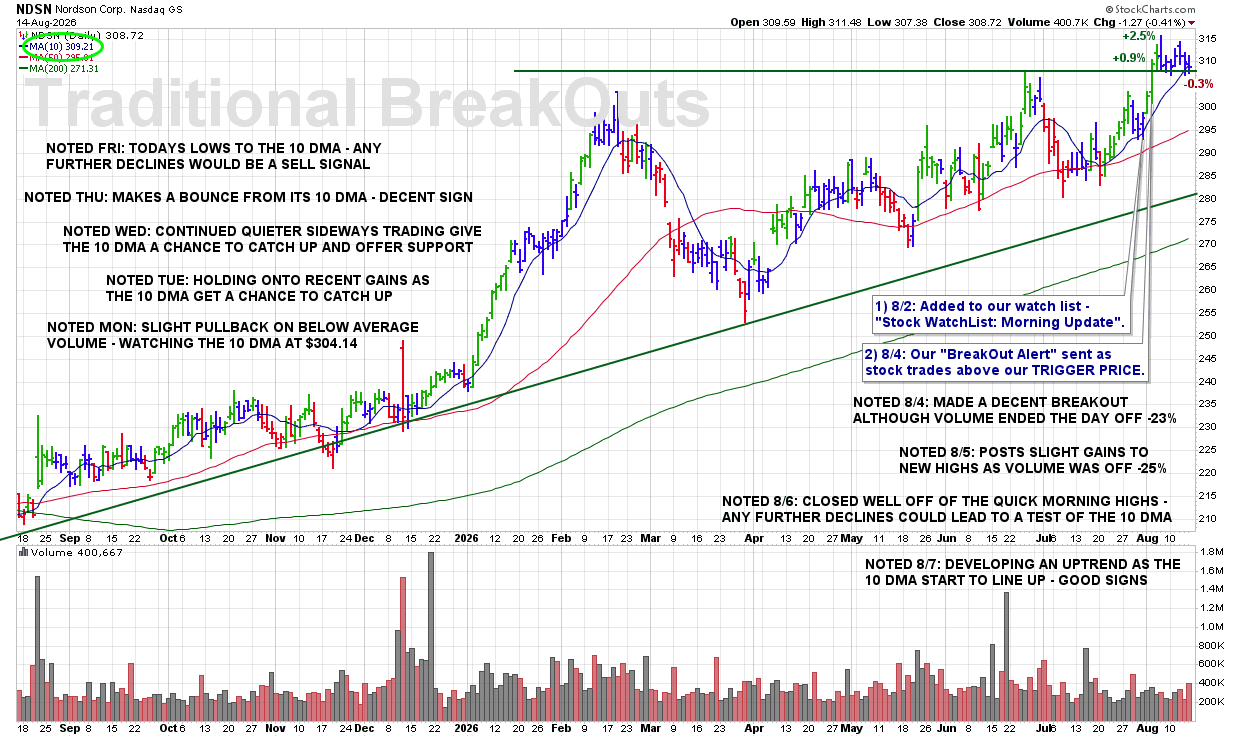
FRI 8/14: NDSN – Todays Lows to the 10 DMA – Any Further Declines Would Be a Sell Signal

8:25 PM – Here is our latest chart update for this recent breakout from our Traditional BreakOuts Watch List

CLICK/TAP CHART TO ZOOM
Chart services courtesy of stockcharts.com. Annotations by James Taulman.

We are currently reporting on this stock as an active holding and continue to monitor the stock closely for any technical SELL SIGNALS.

The focus always remains on price/volume action around key support levels, including the 10 DMA, 50 DMA, and any nearby trendline or ROUND-$ support.

THU 8/13: NDSN – Makes a Bounce From Its 10 DMA – Decent Sign

8:25 PM – Here is our latest chart update for this recent breakout from our Traditional BreakOuts Watch List

CLICK/TAP CHART TO ZOOM
Chart services courtesy of stockcharts.com. Annotations by James Taulman.

We are currently reporting on this stock as an active holding and continue to monitor the stock closely for any technical SELL SIGNALS.

The focus always remains on price/volume action around key support levels, including the 10 DMA, 50 DMA, and any nearby trendline or ROUND-$ support.

WED 8/12: NDSN – Continued Quieter Sideways Trading Give the 10 DMA a Chance to Catch Up and Offer Support

10:25 PM – Here is our latest chart update for this recent breakout from our Traditional BreakOuts Watch List

CLICK/TAP CHART TO ZOOM
Chart services courtesy of stockcharts.com. Annotations by James Taulman.

We are currently reporting on this stock as an active holding and continue to monitor the stock closely for any technical SELL SIGNALS.

The focus always remains on price/volume action around key support levels, including the 10 DMA, 50 DMA, and any nearby trendline or ROUND-$ support.

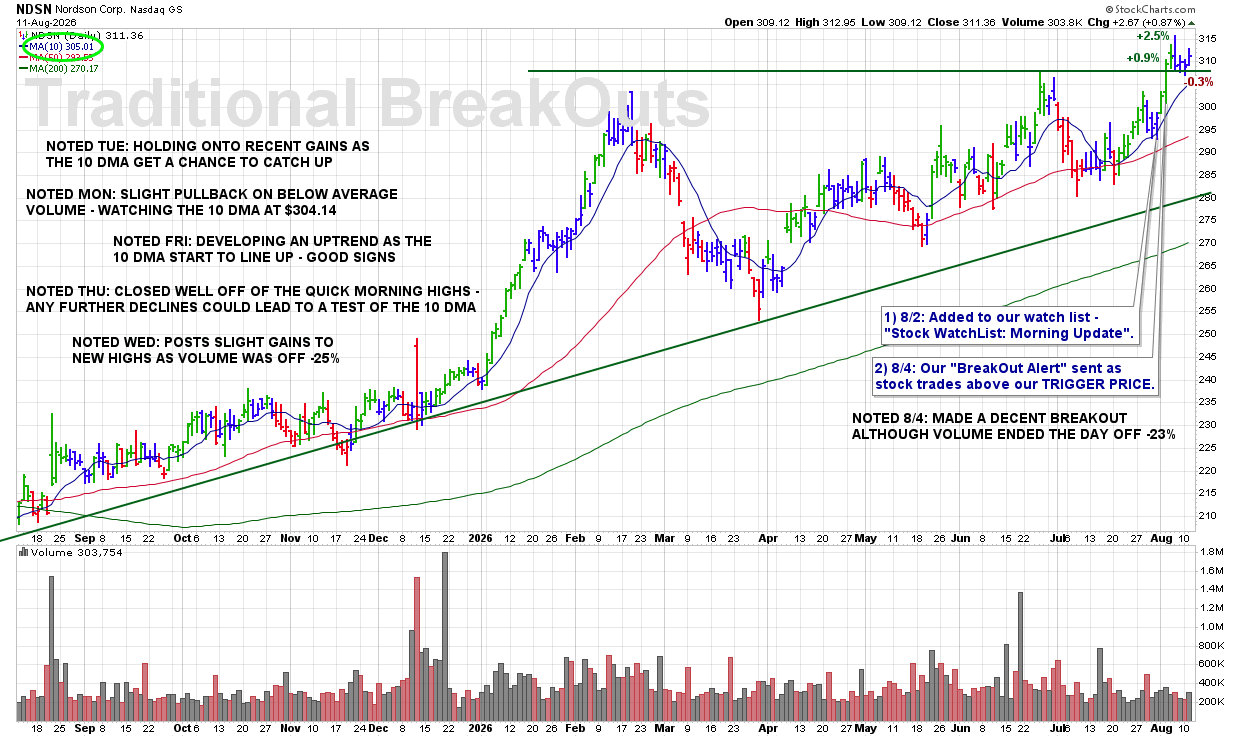
TUE 8/11: NDSN – Holding Onto Recent Gains as the 10 DMA Get a Chance to Catch Up

8:25 PM – Here is our latest chart update for this recent breakout from our Traditional BreakOuts Watch List

CLICK/TAP CHART TO ZOOM
Chart services courtesy of stockcharts.com. Annotations by James Taulman.

We are currently reporting on this stock as an active holding and continue to monitor the stock closely for any technical SELL SIGNALS.

The focus always remains on price/volume action around key support levels, including the 10 DMA, 50 DMA, and any nearby trendline or ROUND-$ support.

MON 8/10: NDSN – Slight Pullback on Below Average Volume – Watching the 10 DMA at $304.14

8:35 PM – Here is our latest chart update for this recent breakout from our Traditional BreakOuts Watch List

CLICK/TAP CHART TO ZOOM
Chart services courtesy of stockcharts.com. Annotations by James Taulman.

We are currently reporting on this stock as an active holding and continue to monitor the stock closely for any technical SELL SIGNALS.

The focus always remains on price/volume action around key support levels, including the 10 DMA, 50 DMA, and any nearby trendline or ROUND-$ support.

FRI 8/7: NDSN – Developing an Uptrend as the 10 DMA Start to Line Up – Good Signs

7:35 PM – Here is our latest chart update for this recent breakout from our Traditional BreakOuts Watch List

CLICK/TAP CHART TO ZOOM
Chart services courtesy of stockcharts.com. Annotations by James Taulman.

We are currently reporting on this stock as an active holding and continue to monitor the stock closely for any technical SELL SIGNALS.

The focus always remains on price/volume action around key support levels, including the 10 DMA, 50 DMA, and any nearby trendline or ROUND-$ support.

THU 8/6: NDSN – Closed Well Off of the Quick Morning Highs – Any Further Declines Could Lead to a Test of the 10 DMA

10:35 PM – Here is our latest chart update for this recent breakout from our Traditional BreakOuts Watch List

CLICK/TAP CHART TO ZOOM
Chart services courtesy of stockcharts.com. Annotations by James Taulman.

We are currently reporting on this stock as an active holding and continue to monitor the stock closely for any technical SELL SIGNALS.

The focus always remains on price/volume action around key support levels, including the 10 DMA, 50 DMA, and any nearby trendline or ROUND-$ support.

WED 8/5: NDSN – Posts Slight Gains to New Highs as Volume Was Off -25%

8:50 PM – Here is our latest chart update for this recent breakout from our Traditional BreakOuts Watch List

CLICK/TAP CHART TO ZOOM
Chart services courtesy of stockcharts.com. Annotations by James Taulman.

We are currently reporting on this stock as an active holding and continue to monitor the stock closely for any technical SELL SIGNALS.

The focus always remains on price/volume action around key support levels, including the 10 DMA, 50 DMA, and any nearby trendline or ROUND-$ support.

TUE 8/4: NDSN – Made a Decent Breakout Although Volume Ended the Day Off -23%

9:25 PM – Here is our latest chart update for this recent breakout from our Traditional BreakOuts Watch List

CLICK/TAP CHART TO ZOOM
Chart services courtesy of stockcharts.com. Annotations by James Taulman.

We are currently reporting on this stock as an active holding and continue to monitor the stock closely for any technical SELL SIGNALS.

The focus always remains on price/volume action around key support levels, including the 10 DMA, 50 DMA, and any nearby trendline or ROUND-$ support.

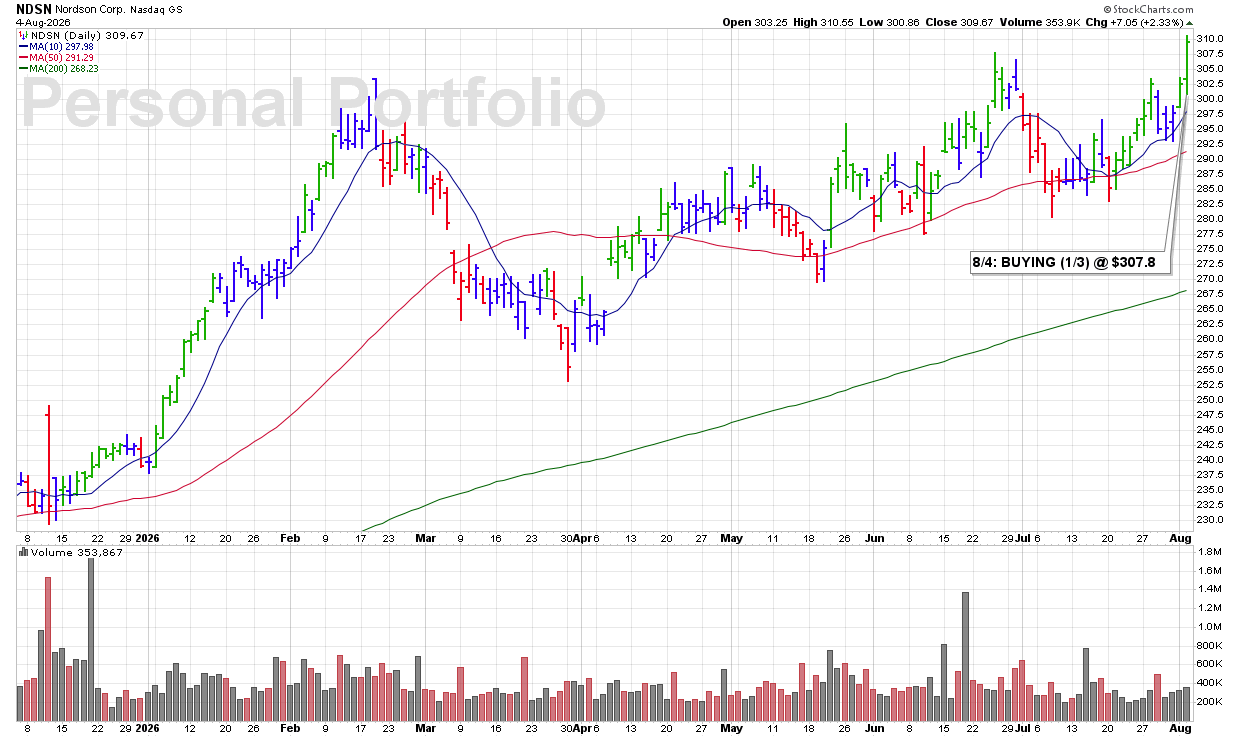
TUE 8/4: NDSN – BUYING (1/3) @ $307.84

12:16 PM – Adding a 1/3 position in this Machinery-General Industrial leader around midday as shares blast to new all-time highs on above-average volume. The combination of a breakout to new highs and expanding volume represents the type of bullish technical action that qualifies as a BUY SIGNAL under the ULTRA Trading System.

James’ Trader’s Tip: Buy the Leaders—Not the Laggards

  • Industry leaders making new highs are often attracting institutional buying.

  • Breakouts accompanied by above-average volume have a greater probability of continuing.

  • Focusing on market leaders with strong price and volume action can significantly improve the quality of your trade selections.

CLICK/TAP CHART TO ZOOM
Chart services courtesy of stockcharts.com. Annotations by James Taulman.

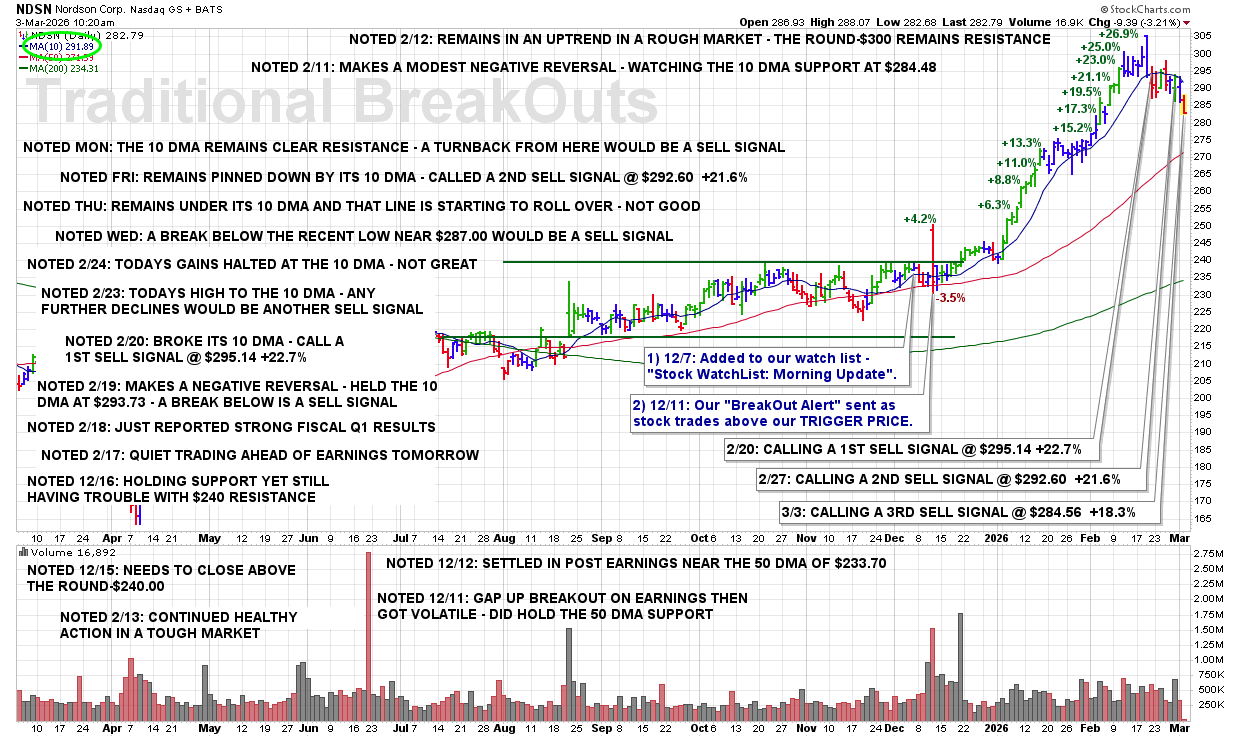
TUE 3/3: NDSN – CALLING A 3RD SELL SIGNAL @ $284.56 +18.3%

9:49 AM – No matter the gains, we always want to be pruning technically weakening stocks first — especially in a tough market. Calling a FINAL SELL SIGNAL here as the 10 DMA has been acting as resistance. The stock is now clearly in a developing downtrend. In addition, the 50 DMA is beginning to come into play below price, which could pull shares even lower. Booking a solid win in what has been a challenging market environment.

SELL SIGNALS:
2/20 (1/3) @ $295.14 +22.7%
2/27 (1/3) @ $292.60 +21.6%
3/3 (1/3) @ $284.56 +18.3%

OVERALL P/L: +20.9%

ULTRA Trader’s Tip: Prune Weakness First

  • When the 10 DMA turns from support into resistance, the stock’s character has changed.

  • Developed downtrends often accelerate once the 50 DMA begins pulling price lower.

  • Selling weakening leaders first strengthens the overall portfolio during volatile markets.

CLICK/TAP CHART TO ZOOM
Chart services courtesy of stockcharts.com. Annotations by James Taulman.

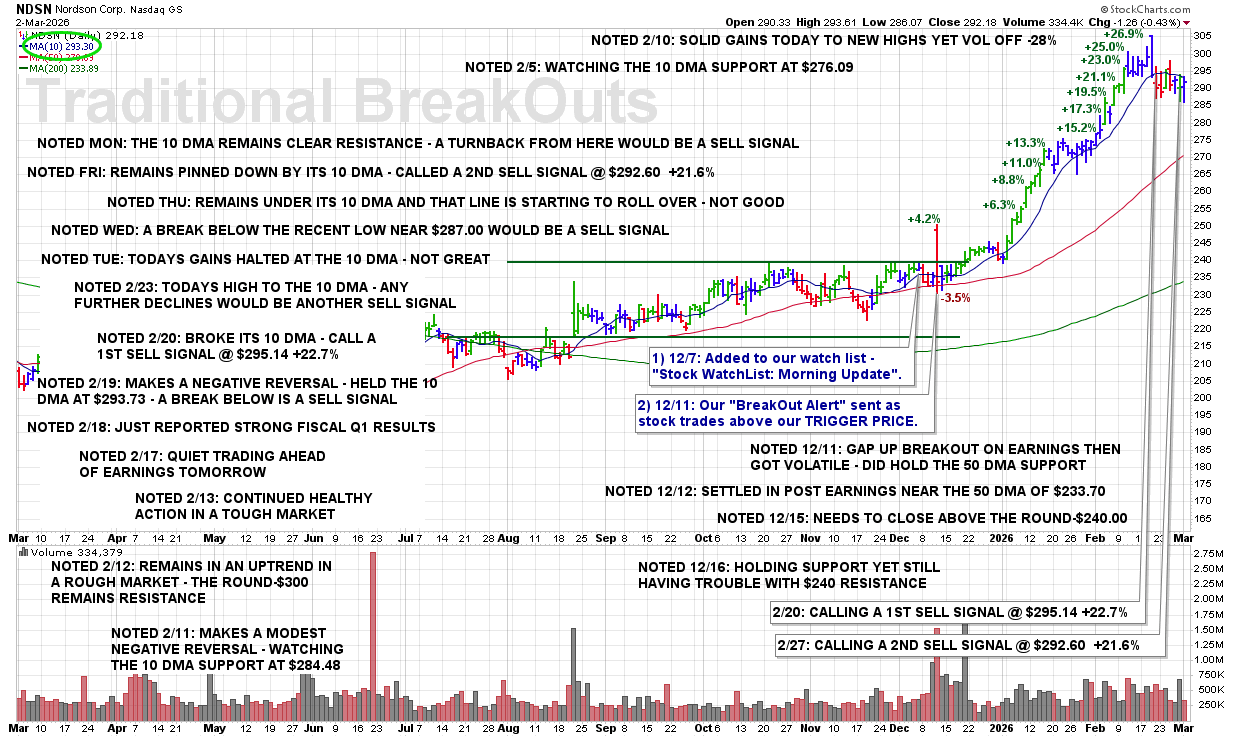
FRI 2/27: NDSN – CALLING A 2ND SELL SIGNAL @ $292.60 +21.6%

3:45 PM – Shares remain pinned below the 10 DMA, and that line is beginning to roll over. When a stock cannot reclaim the 10 DMA and momentum starts turning lower, that is a clear shift in short-term character. Strength has stalled, and we continue to scale out methodically.

SELL SIGNALS:
2/20 (1/3) @ $295.14 +22.7%
2/27 (1/3) @ $292.60 +21.6%

OVERALL P/L: +22.2%

ULTRA Trader’s Tip: When the 10 DMA Rolls Over

  • A stock pinned below the 10 DMA is losing short-term leadership.

  • When that moving average begins to slope downward, momentum has clearly shifted.

  • Scaling out into early weakness protects gains before deterioration accelerates.

CLICK/TAP CHART TO ZOOM
Chart services courtesy of stockcharts.com. Annotations by James Taulman.