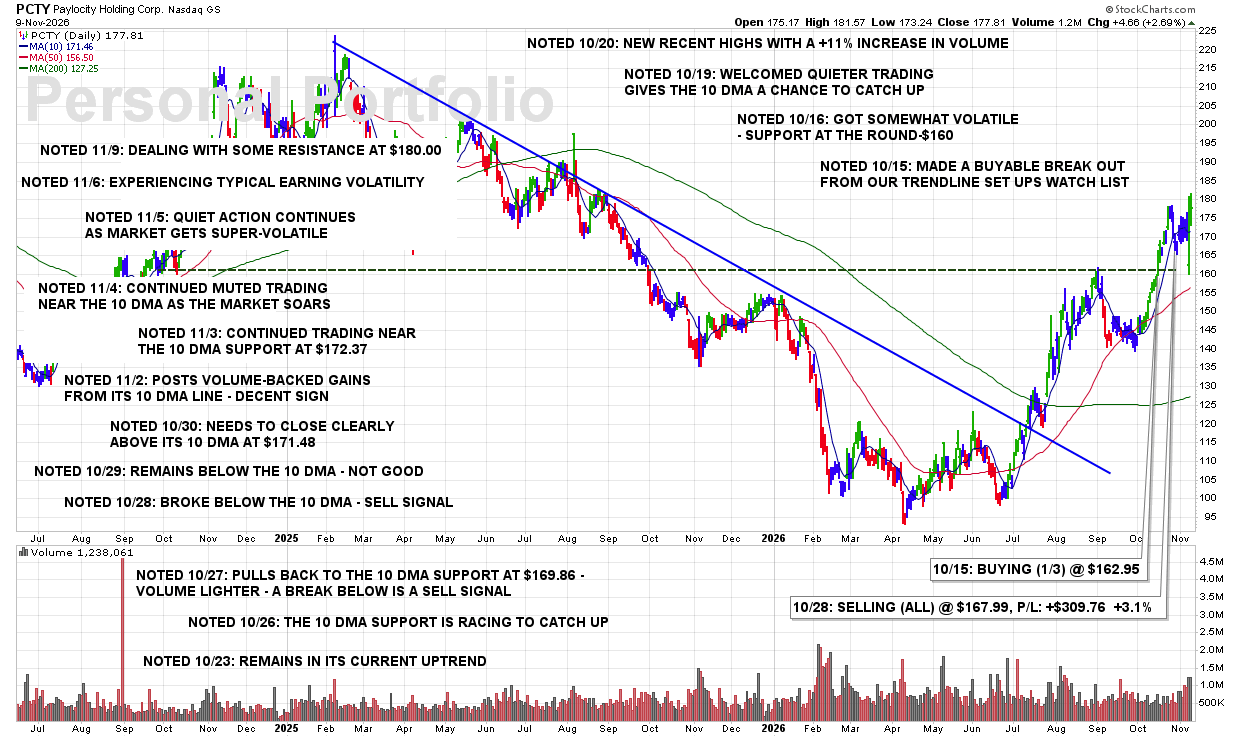
MON 11/9: PCTY – Dealing With Some Resistance at $180.00

8:35 PM – We are currently reporting on this stock as an active holding and continue to monitor the stock closely for any technical SELL SIGNALS.
The focus always remains on price/volume action around key support levels, including the 10 DMA, 50 DMA, and any nearby trendline or ROUND-$ support.

CLICK/TAP CHART TO ZOOM
Chart services courtesy of stockcharts.com. Annotations by James Taulman.

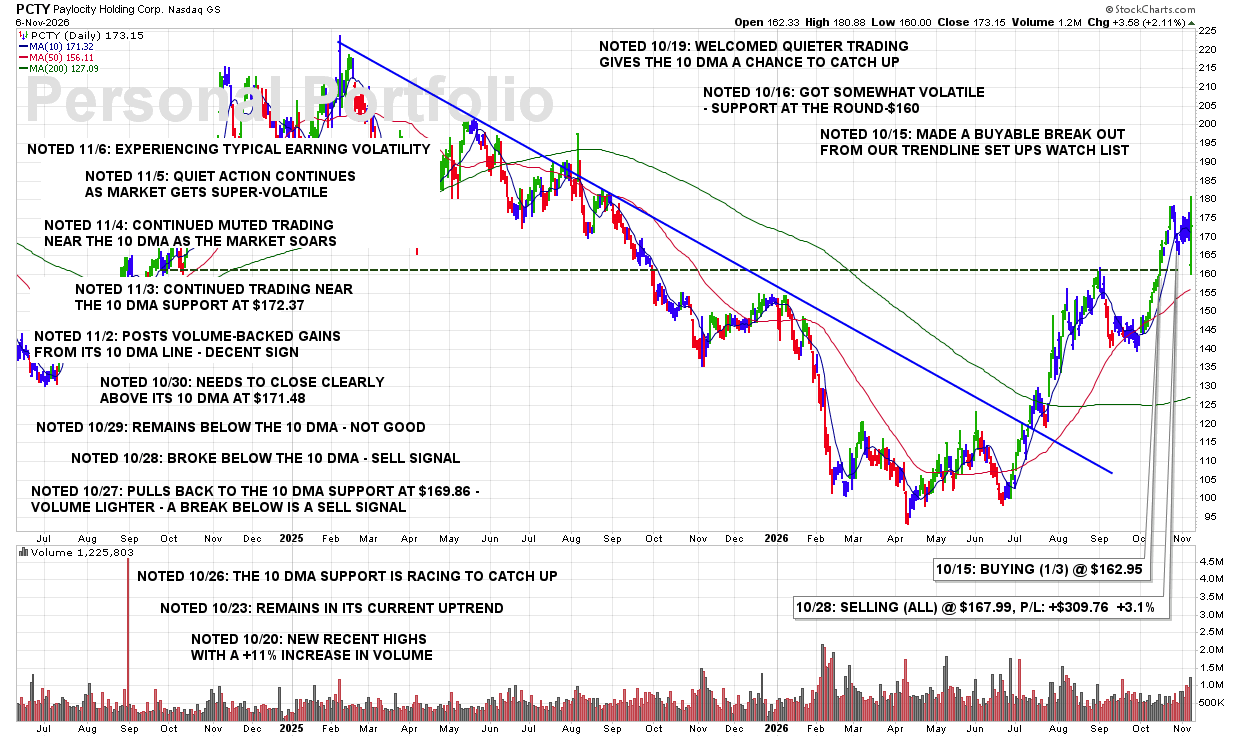
FRI 11/6: PCTY – Experiencing Typical Earning Volatility

6:45 PM – We are currently reporting on this stock as an active holding and continue to monitor the stock closely for any technical SELL SIGNALS.

The focus always remains on price/volume action around key support levels, including the 10 DMA, 50 DMA, and any nearby trendline or ROUND-$ support.

CLICK/TAP CHART TO ZOOM
Chart services courtesy of stockcharts.com. Annotations by James Taulman.

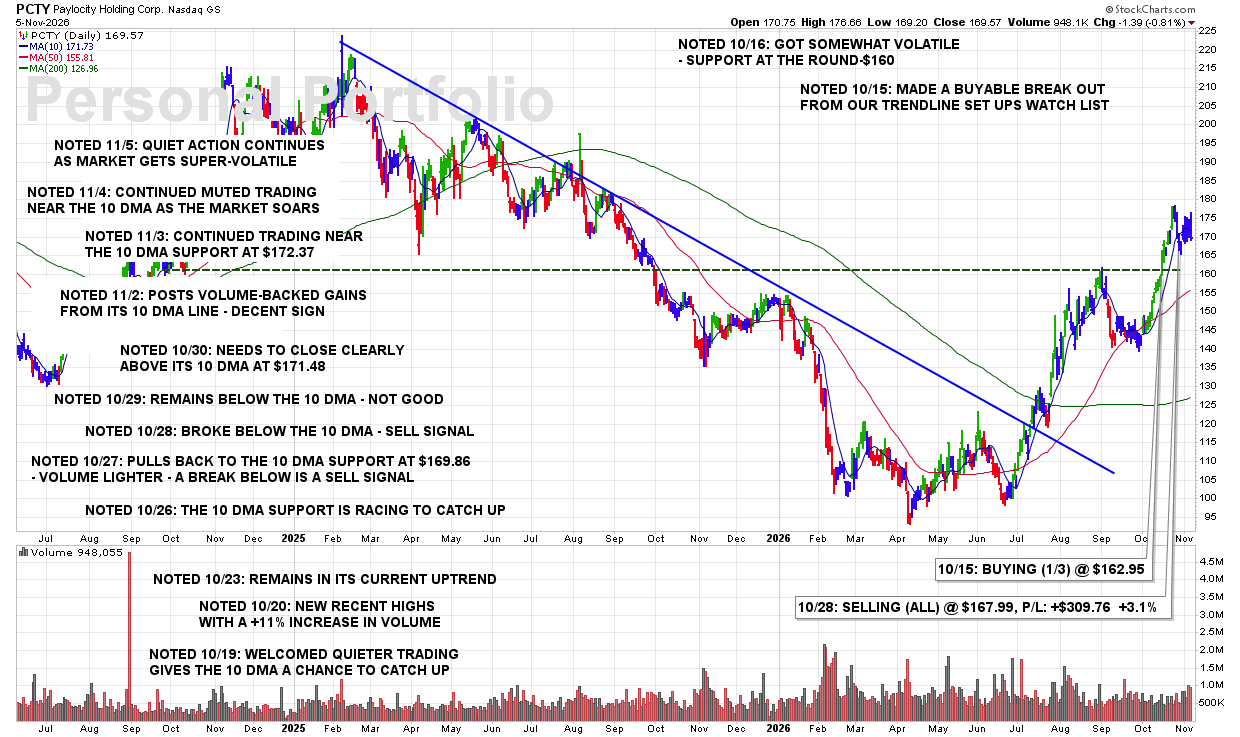
THU 11/5: PCTY – Quiet Action Continues as Market Gets Super-volatile

11:30 PM – We are currently reporting on this stock as an active holding and continue to monitor the stock closely for any technical SELL SIGNALS.

The focus always remains on price/volume action around key support levels, including the 10 DMA, 50 DMA, and any nearby trendline or ROUND-$ support.

CLICK/TAP CHART TO ZOOM
Chart services courtesy of stockcharts.com. Annotations by James Taulman.

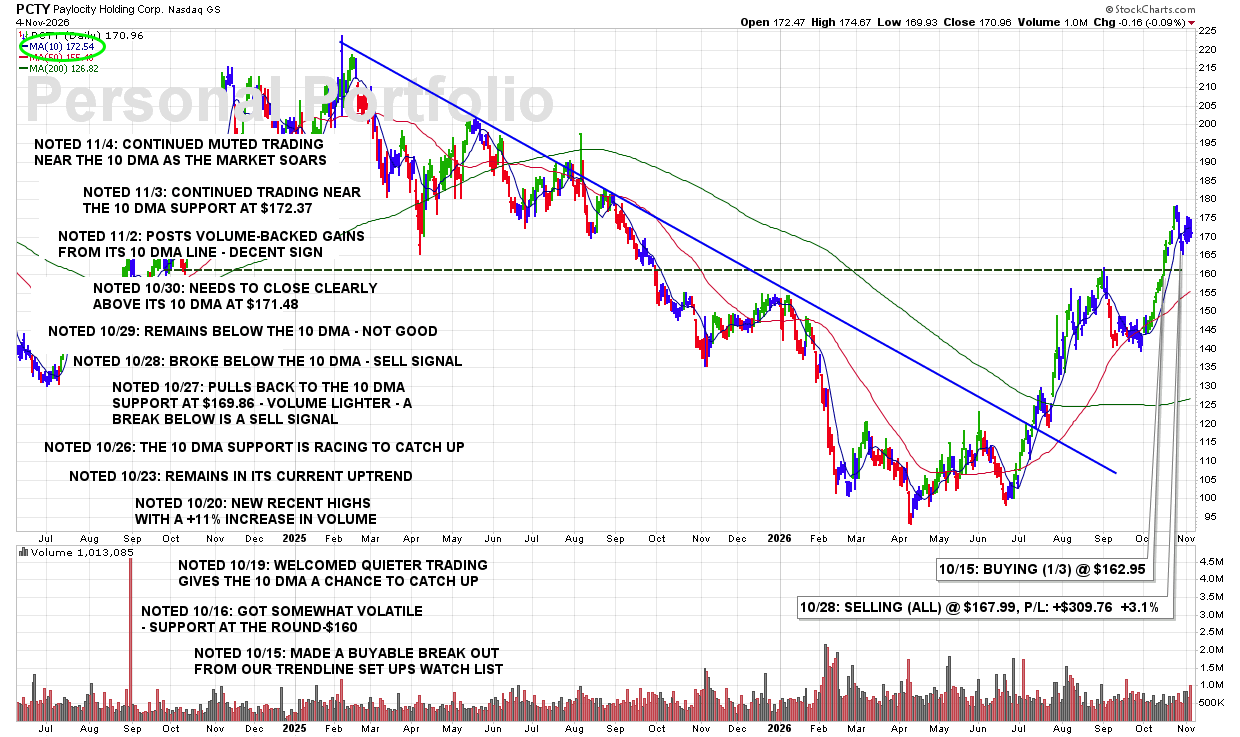
WED 11/4: PCTY – Continued Muted Trading Near the 10 DMA as the Market Soars

8:45 PM – We are currently reporting on this stock as an active holding and continue to monitor the stock closely for any technical SELL SIGNALS.

The focus always remains on price/volume action around key support levels, including the 10 DMA, 50 DMA, and any nearby trendline or ROUND-$ support.

CLICK/TAP CHART TO ZOOM
Chart services courtesy of stockcharts.com. Annotations by James Taulman.

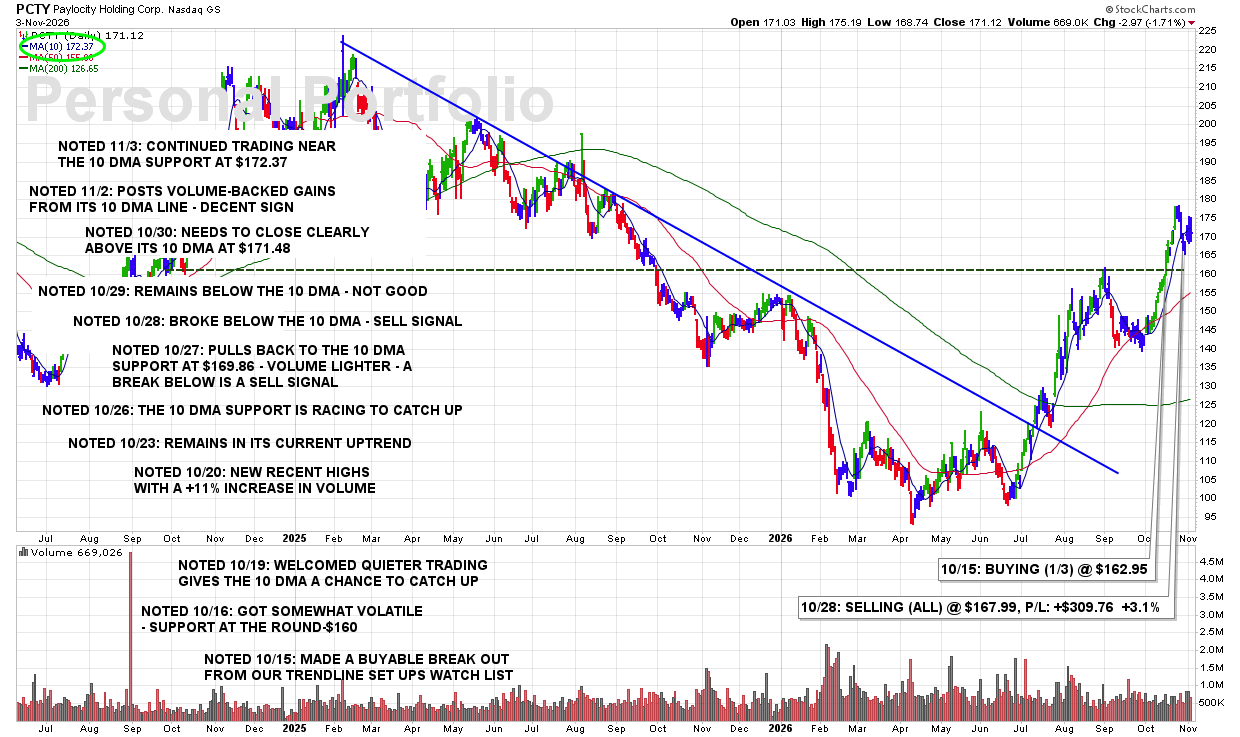
TUE 11/3: PCTY – Continued Trading Near The 10 DMA Support At $172.37

9:00 PM – We are currently reporting on this stock as an active holding and continue to monitor the stock closely for any technical SELL SIGNALS.

The focus always remains on price/volume action around key support levels, including the 10 DMA, 50 DMA, and any nearby trendline or ROUND-$ support.

CLICK/TAP CHART TO ZOOM
Chart services courtesy of stockcharts.com. Annotations by James Taulman.

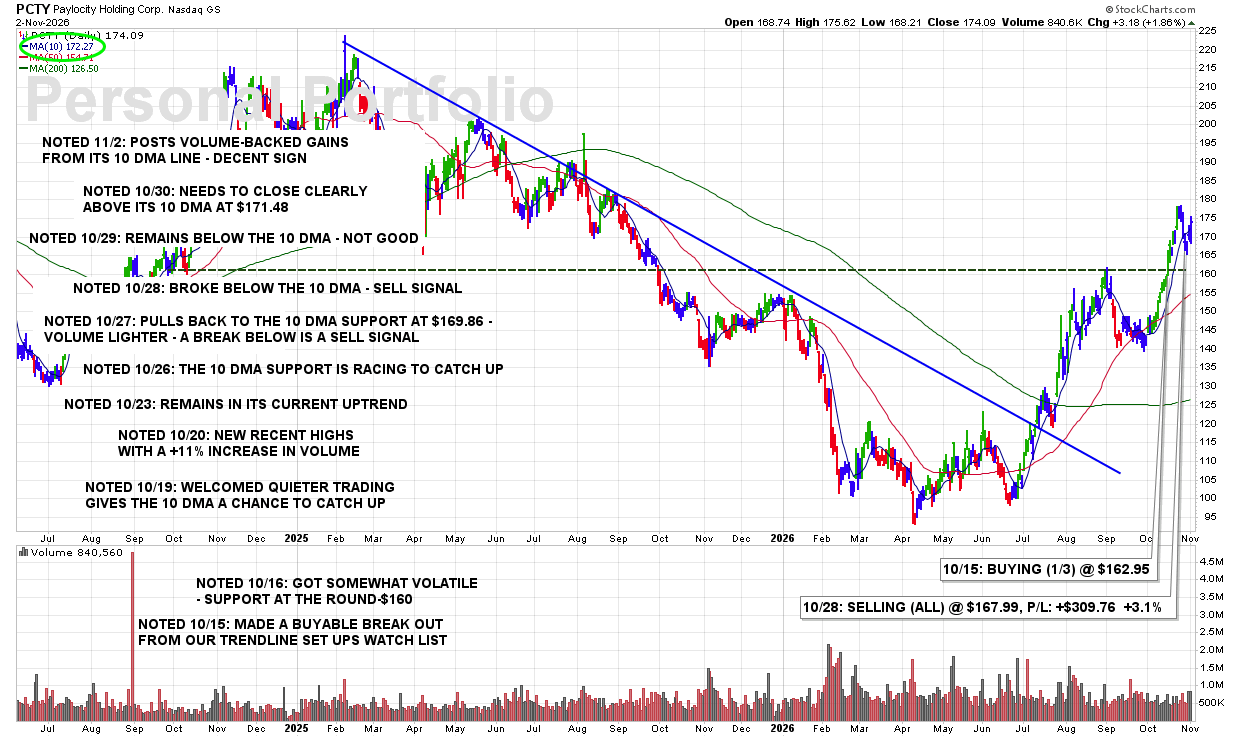
MON 11/2: PCTY – Posts Volume-Backed Gains From Its 10 DMA Line – Decent Sign

9:35 PM – We are currently reporting on this stock as an active holding and continue to monitor the stock closely for any technical SELL SIGNALS.

The focus always remains on price/volume action around key support levels, including the 10 DMA, 50 DMA, and any nearby trendline or ROUND-$ support.

CLICK/TAP CHART TO ZOOM
Chart services courtesy of stockcharts.com. Annotations by James Taulman.

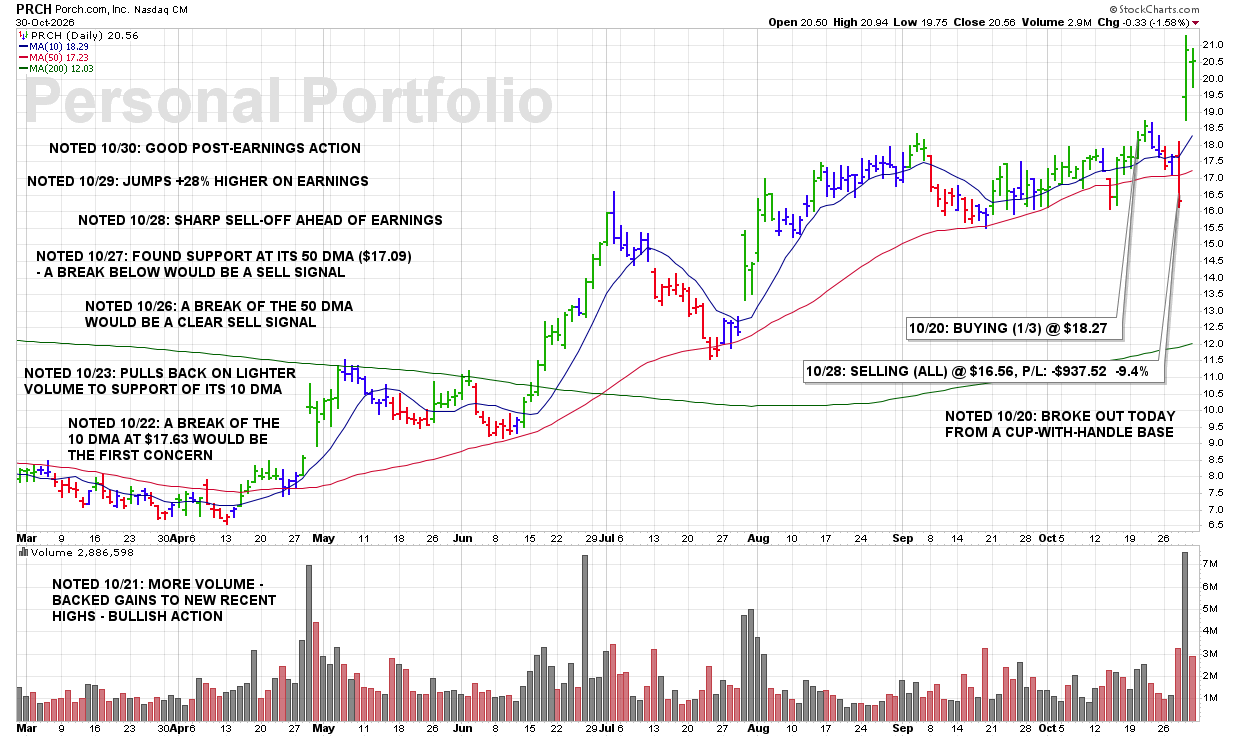
FRI 10/30: PRCH – Good Post-Earnings Action

8:40 PM – We are currently reporting on this stock as an active holding and continue to monitor the stock closely for any technical SELL SIGNALS.

The focus always remains on price/volume action around key support levels, including the 10 DMA, 50 DMA, and any nearby trendline or ROUND-$ support.

CLICK/TAP CHART TO ZOOM
Chart services courtesy of stockcharts.com. Annotations by James Taulman.

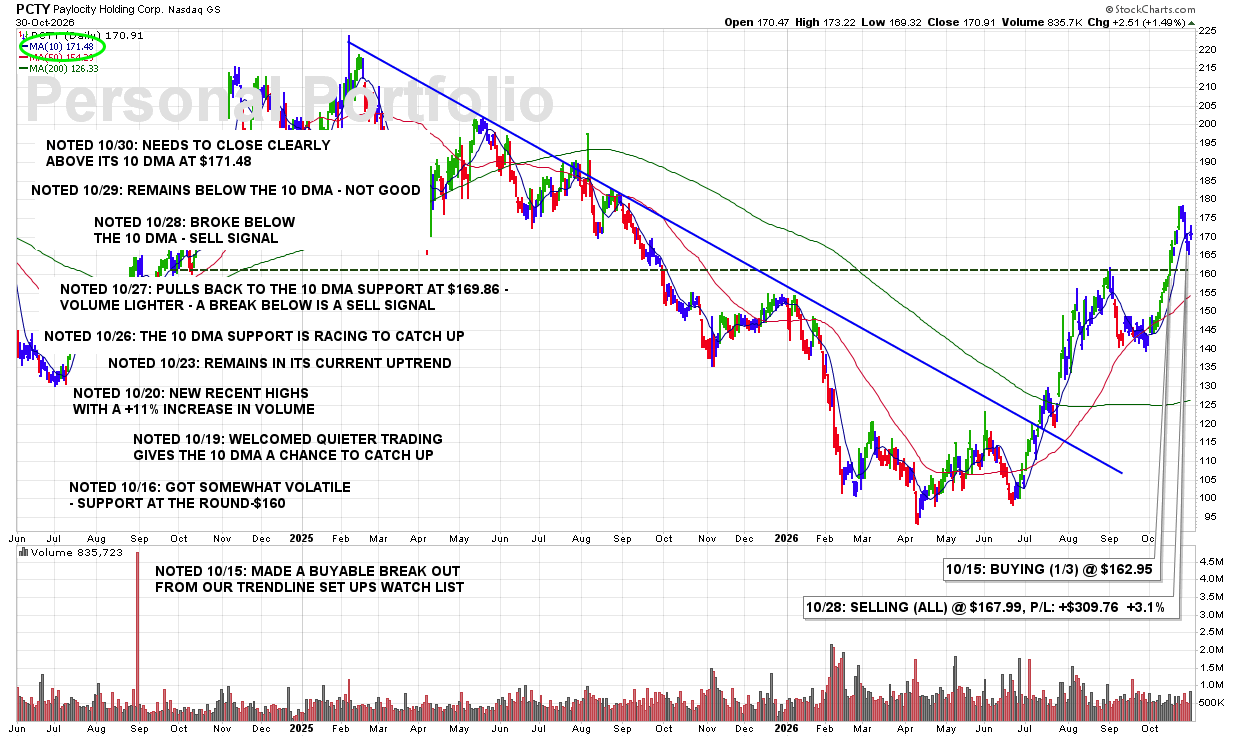
FRI 10/30: PCTY – Needs to Close Clearly Above Its 10 DMA at $171.48

8:35 PM – We are currently reporting on this stock as an active holding and continue to monitor the stock closely for any technical SELL SIGNALS.

The focus always remains on price/volume action around key support levels, including the 10 DMA, 50 DMA, and any nearby trendline or ROUND-$ support.

CLICK/TAP CHART TO ZOOM
Chart services courtesy of stockcharts.com. Annotations by James Taulman.

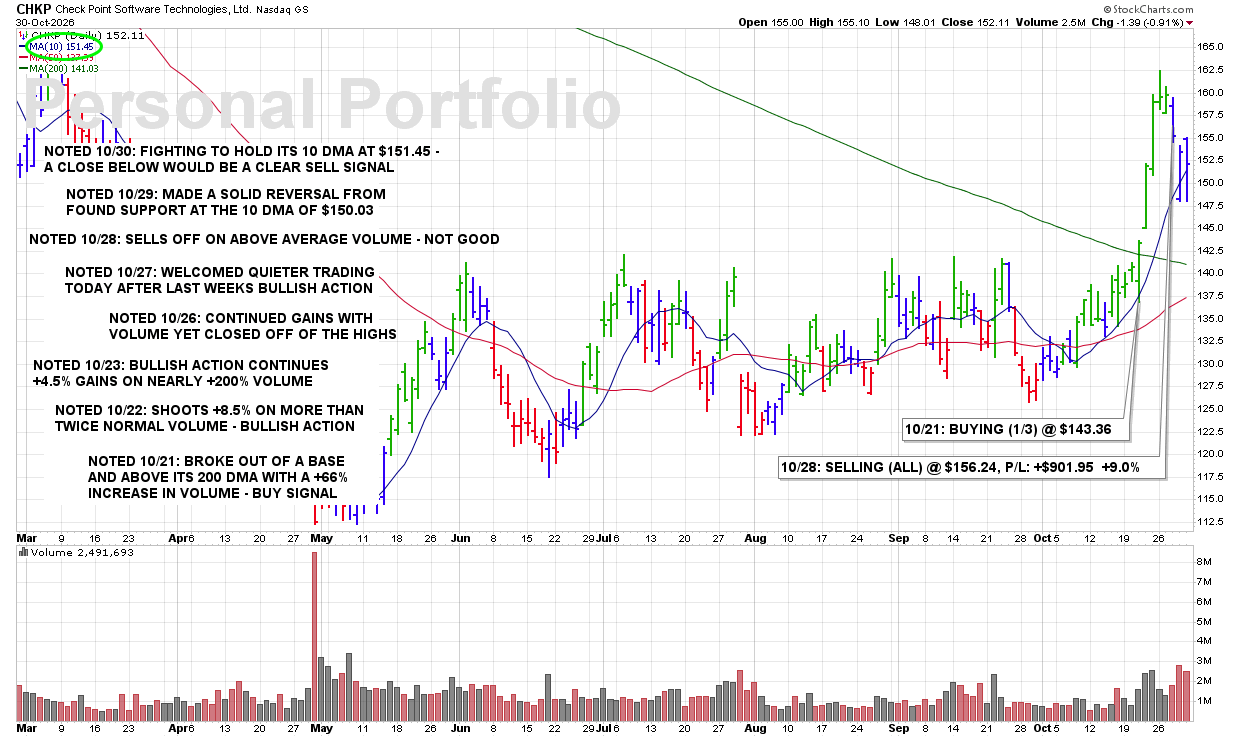
FRI 10/30: CHKP – Fighting to Hold Its 10 DMA at $151.45 – a Close Below Would Be a Clear Sell Signal

8:25 PM – We are currently reporting on this stock as an active holding and continue to monitor the stock closely for any technical SELL SIGNALS.

The focus always remains on price/volume action around key support levels, including the 10 DMA, 50 DMA, and any nearby trendline or ROUND-$ support.

CLICK/TAP CHART TO ZOOM
Chart services courtesy of stockcharts.com. Annotations by James Taulman.

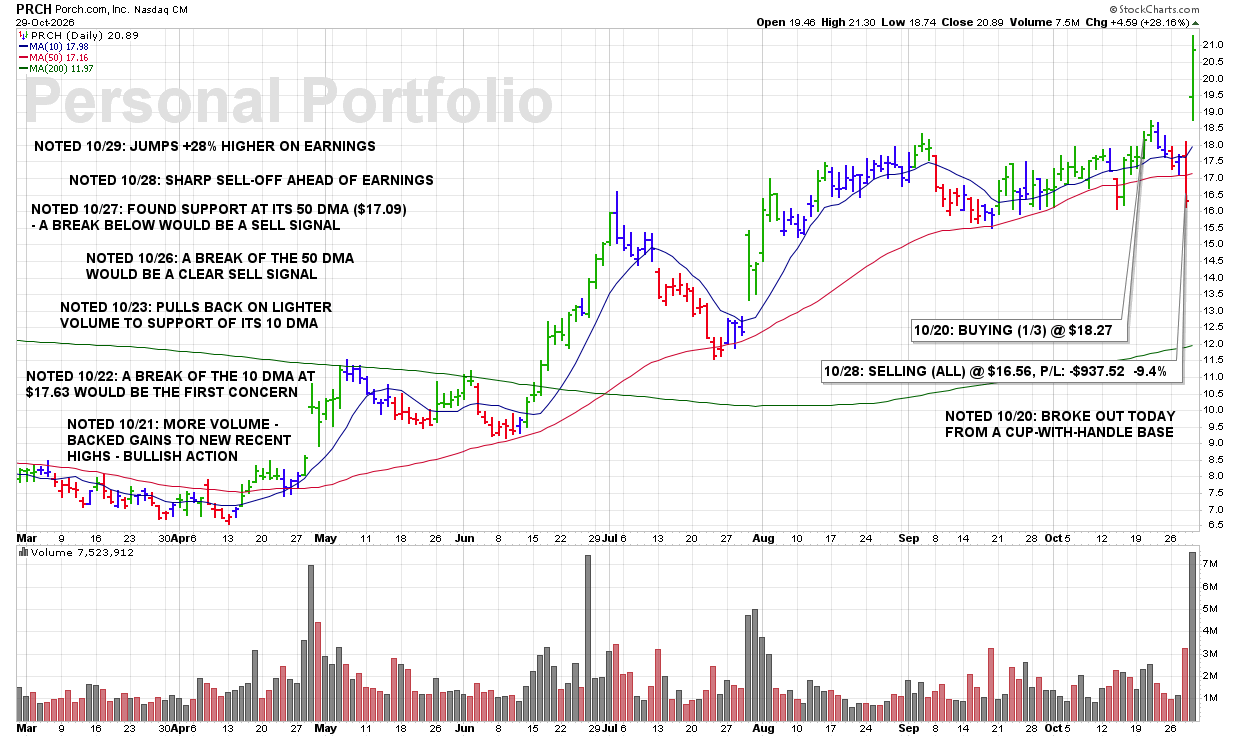
THU 10/29: PRCH – Jumps +28% Higher on Earnings

11:10 PM – We are currently reporting on this stock as an active holding and continue to monitor the stock closely for any technical SELL SIGNALS.

The focus always remains on price/volume action around key support levels, including the 10 DMA, 50 DMA, and any nearby trendline or ROUND-$ support.

CLICK/TAP CHART TO ZOOM
Chart services courtesy of stockcharts.com. Annotations by James Taulman.

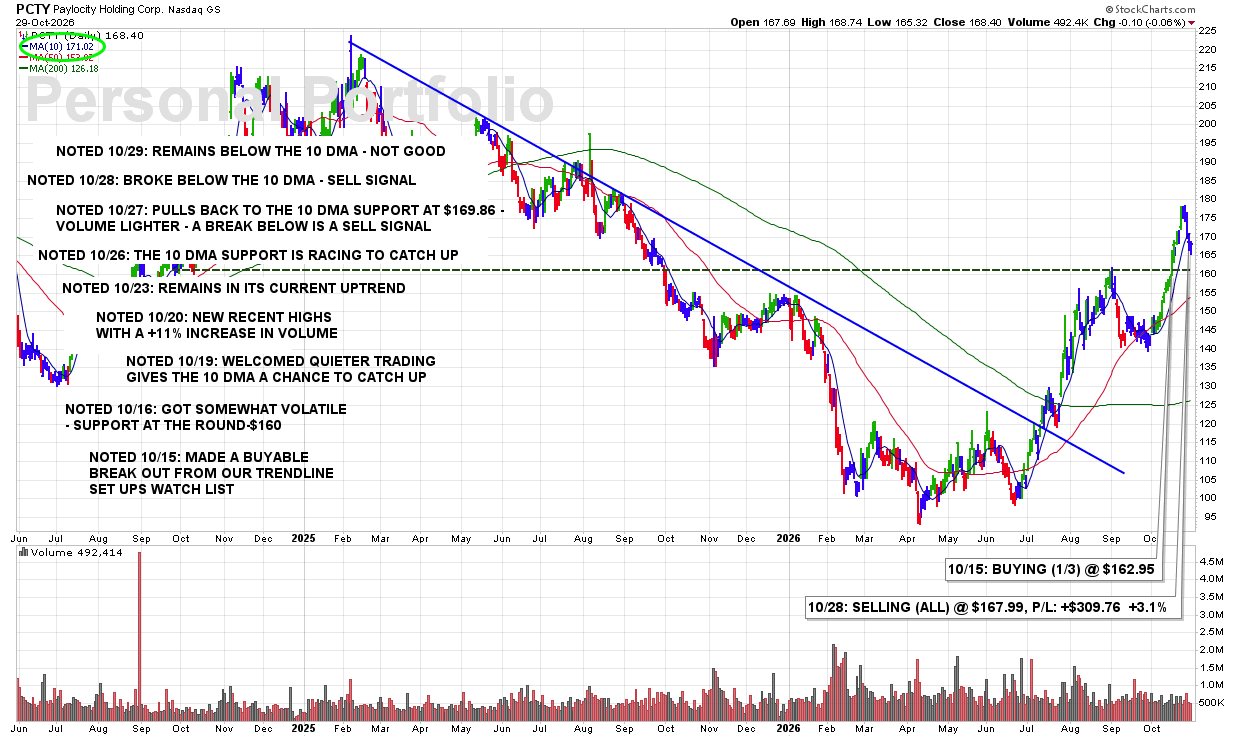
THU 10/29: PCTY – Remains Below the 10 DMA – Not Good

11:05 PM – We are currently reporting on this stock as an active holding and continue to monitor the stock closely for any technical SELL SIGNALS.

The focus always remains on price/volume action around key support levels, including the 10 DMA, 50 DMA, and any nearby trendline or ROUND-$ support.

CLICK/TAP CHART TO ZOOM
Chart services courtesy of stockcharts.com. Annotations by James Taulman.

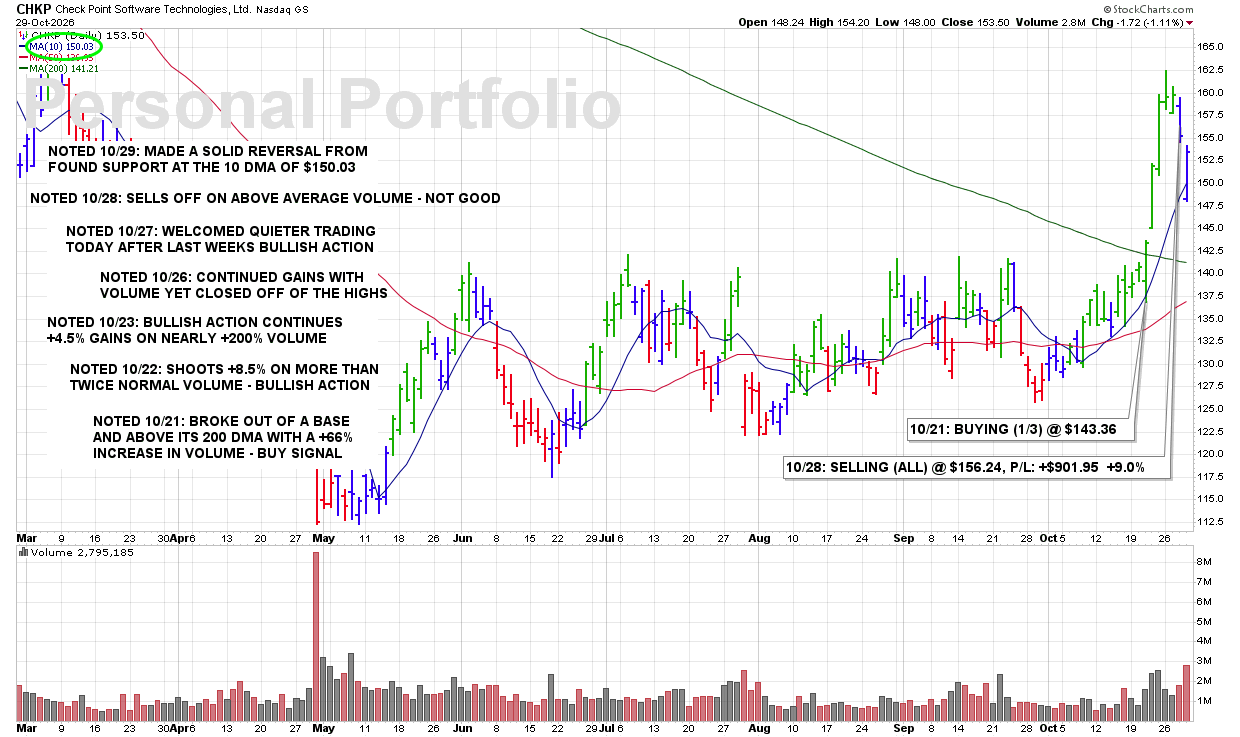
THU 10/29: CHKP – Made a Solid Reversal From Found Support at the 10 DMA of $150.03

10:55 PM – We are currently reporting on this stock as an active holding and continue to monitor the stock closely for any technical SELL SIGNALS.

The focus always remains on price/volume action around key support levels, including the 10 DMA, 50 DMA, and any nearby trendline or ROUND-$ support.

CLICK/TAP CHART TO ZOOM
Chart services courtesy of stockcharts.com. Annotations by James Taulman.

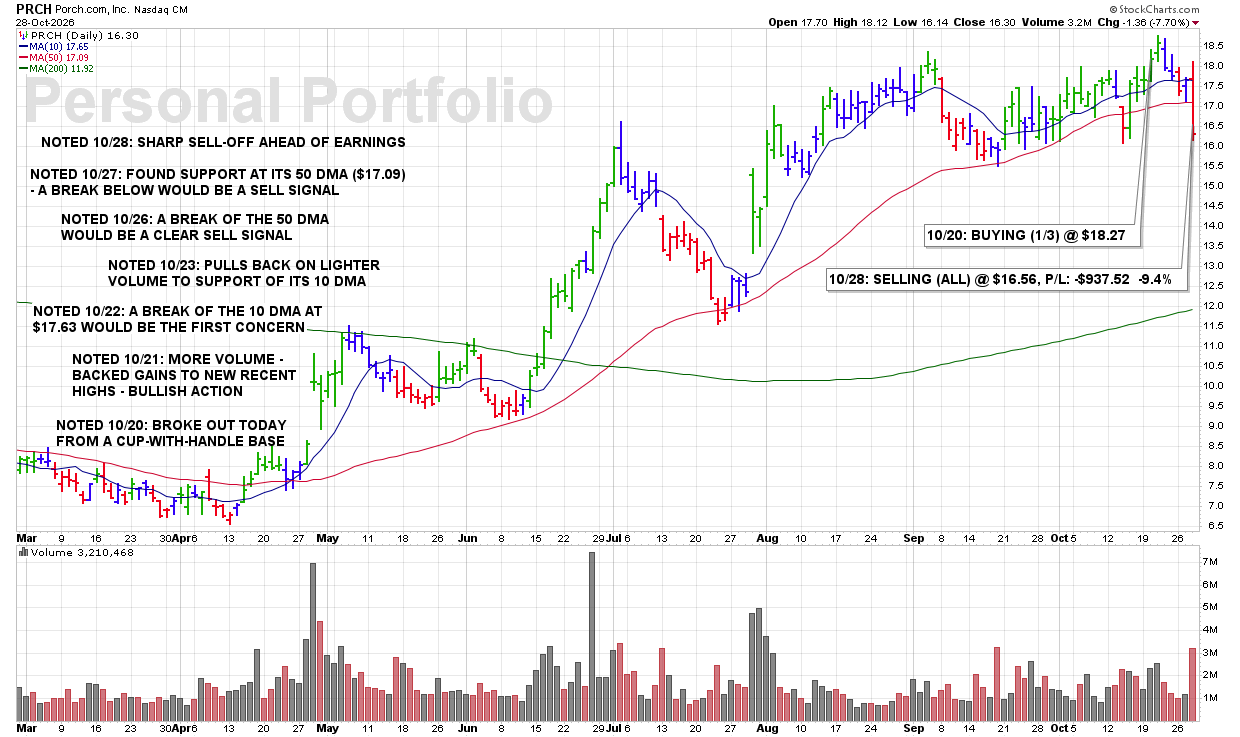
WED 10/28: PRCH – Sharp Sell-Off Ahead of Earnings

7:25 PM – We are currently reporting on this stock as an active holding and continue to monitor the stock closely for any technical SELL SIGNALS.

The focus always remains on price/volume action around key support levels, including the 10 DMA, 50 DMA, and any nearby trendline or ROUND-$ support.

CLICK/TAP CHART TO ZOOM
Chart services courtesy of stockcharts.com. Annotations by James Taulman.

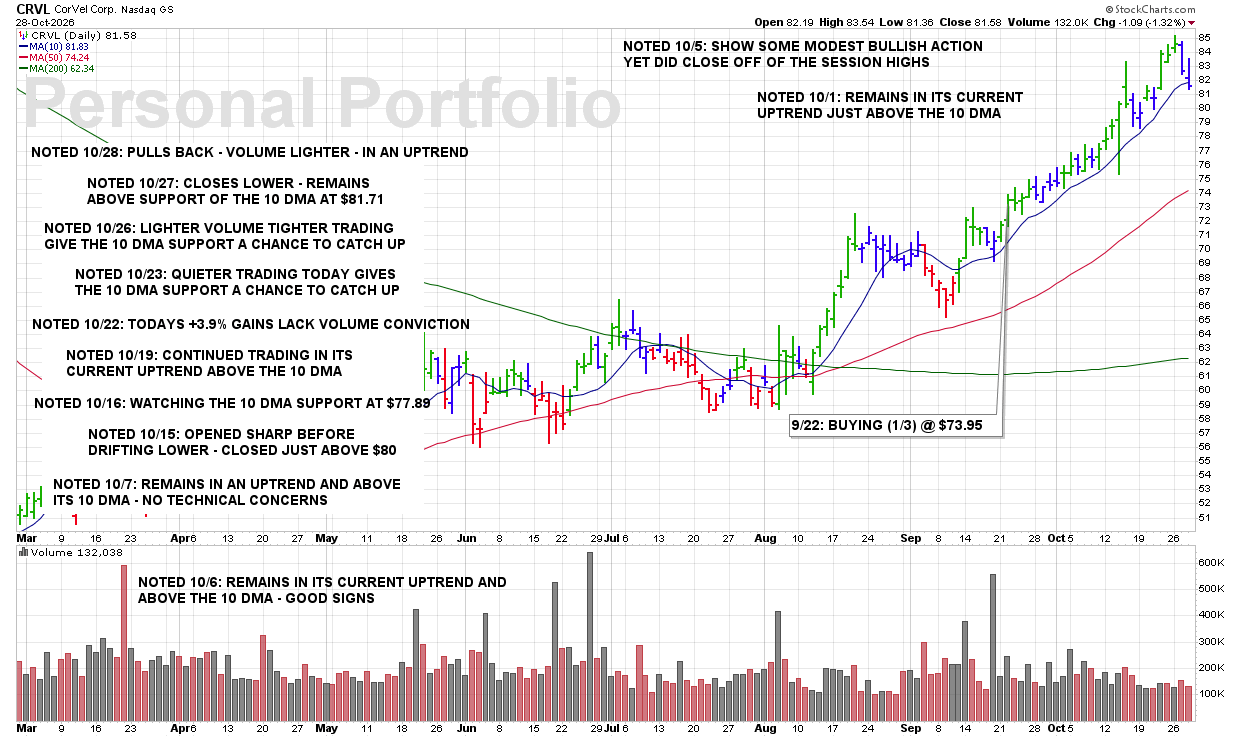
WED 10/28: CRVL – Pulls Back – Volume Lighter – in an Uptrend

7:10 PM – We are currently reporting on this stock as an active holding and continue to monitor the stock closely for any technical SELL SIGNALS.

The focus always remains on price/volume action around key support levels, including the 10 DMA, 50 DMA, and any nearby trendline or ROUND-$ support.

CLICK/TAP CHART TO ZOOM
Chart services courtesy of stockcharts.com. Annotations by James Taulman.

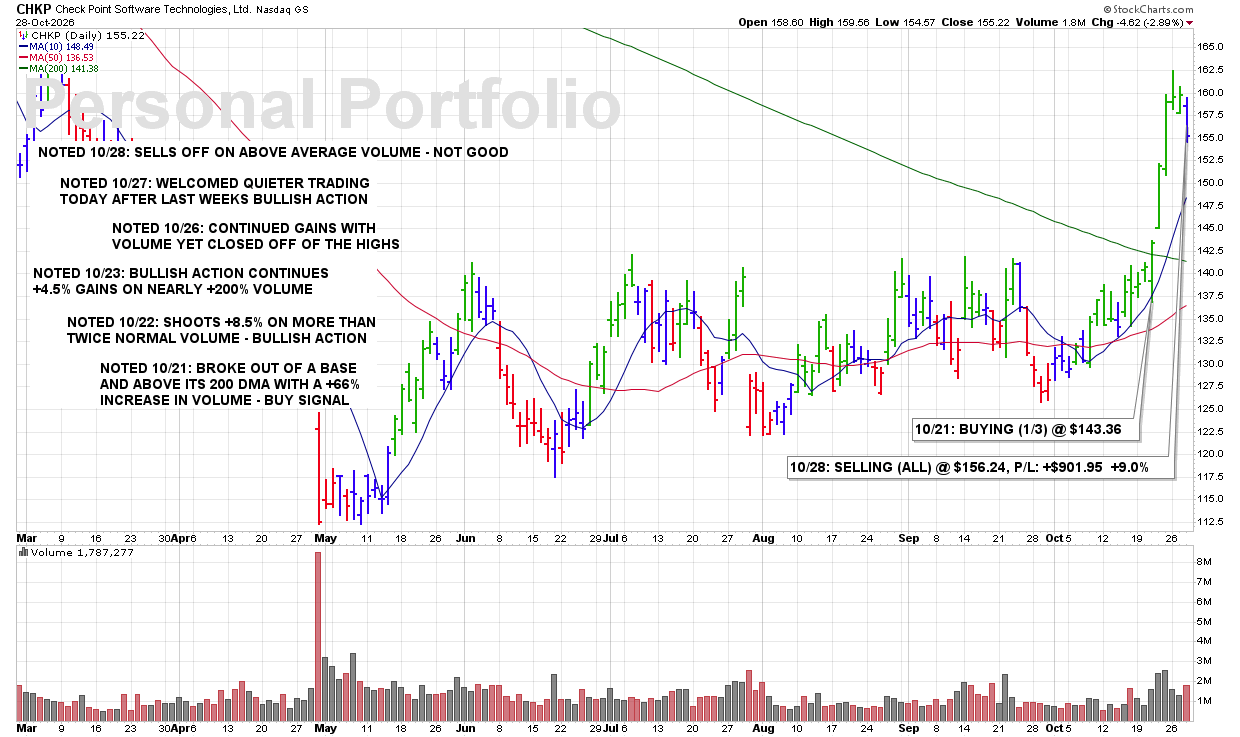
WED 10/28: CHKP – Sells Off on Above Average Volume – Not Good

7:00 PM – We are currently reporting on this stock as an active holding and continue to monitor the stock closely for any technical SELL SIGNALS.

The focus always remains on price/volume action around key support levels, including the 10 DMA, 50 DMA, and any nearby trendline or ROUND-$ support.

CLICK/TAP CHART TO ZOOM
Chart services courtesy of stockcharts.com. Annotations by James Taulman.

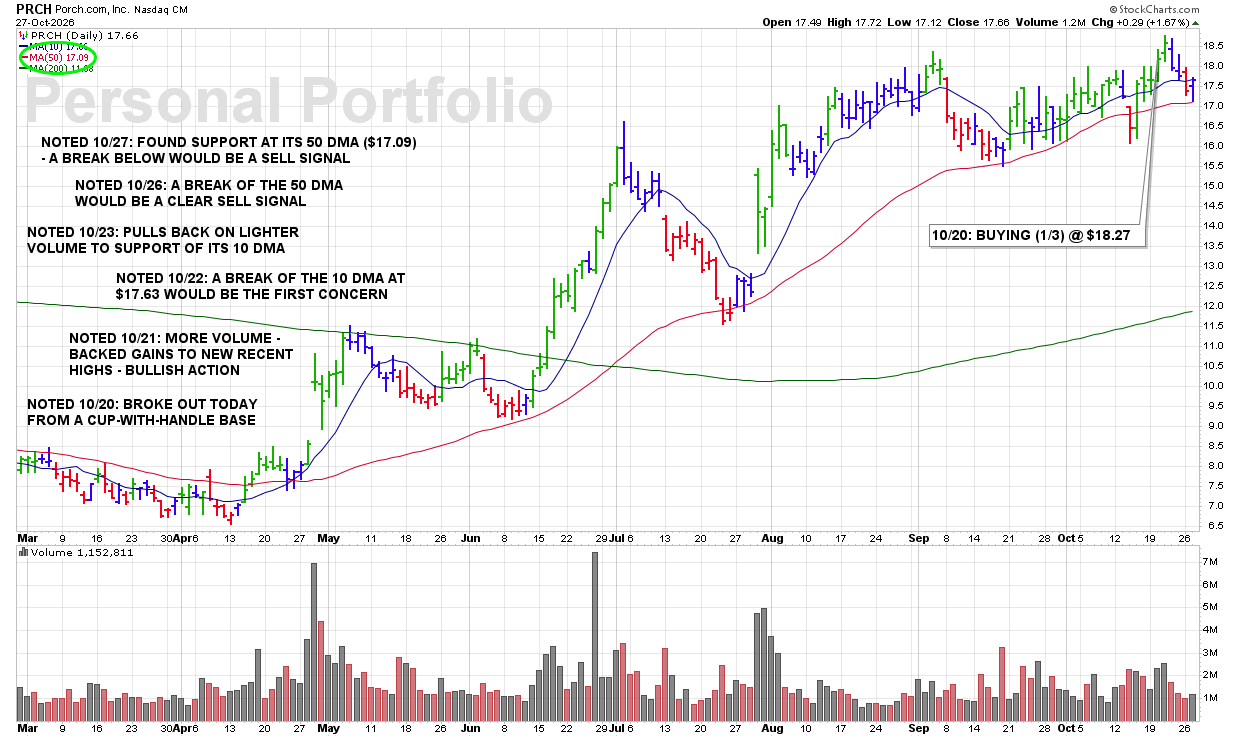
TUE 10/27: PRCH – Found Support at Its 50 DMA ($17.09) – a Break Below Would Be a Sell Signal

8:55 PM – We are currently reporting on this stock as an active holding and continue to monitor the stock closely for any technical SELL SIGNALS.

The focus always remains on price/volume action around key support levels, including the 10 DMA, 50 DMA, and any nearby trendline or ROUND-$ support.

CLICK/TAP CHART TO ZOOM
Chart services courtesy of stockcharts.com. Annotations by James Taulman.

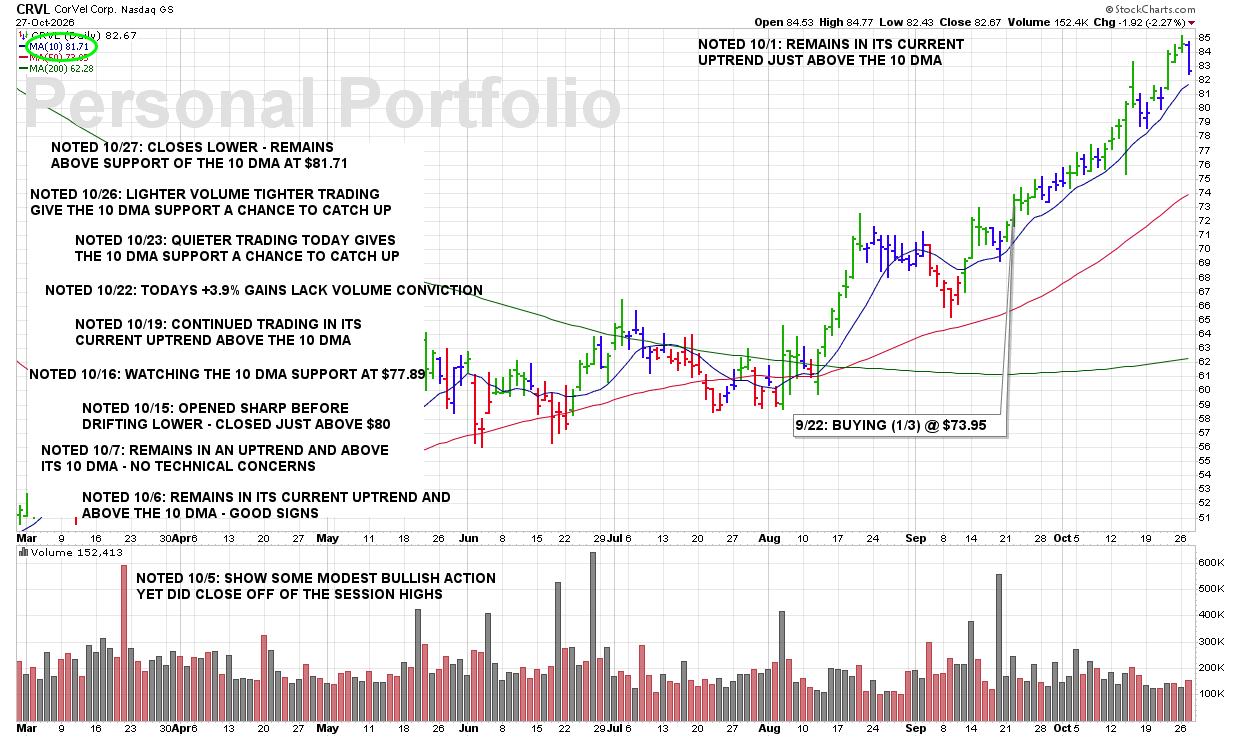
TUE 10/27: CRVL – Closes Lower – Remains Above Support of the 10 DMA at $81.71

8:40 PM – We are currently reporting on this stock as an active holding and continue to monitor the stock closely for any technical SELL SIGNALS.

The focus always remains on price/volume action around key support levels, including the 10 DMA, 50 DMA, and any nearby trendline or ROUND-$ support.

CLICK/TAP CHART TO ZOOM
Chart services courtesy of stockcharts.com. Annotations by James Taulman.

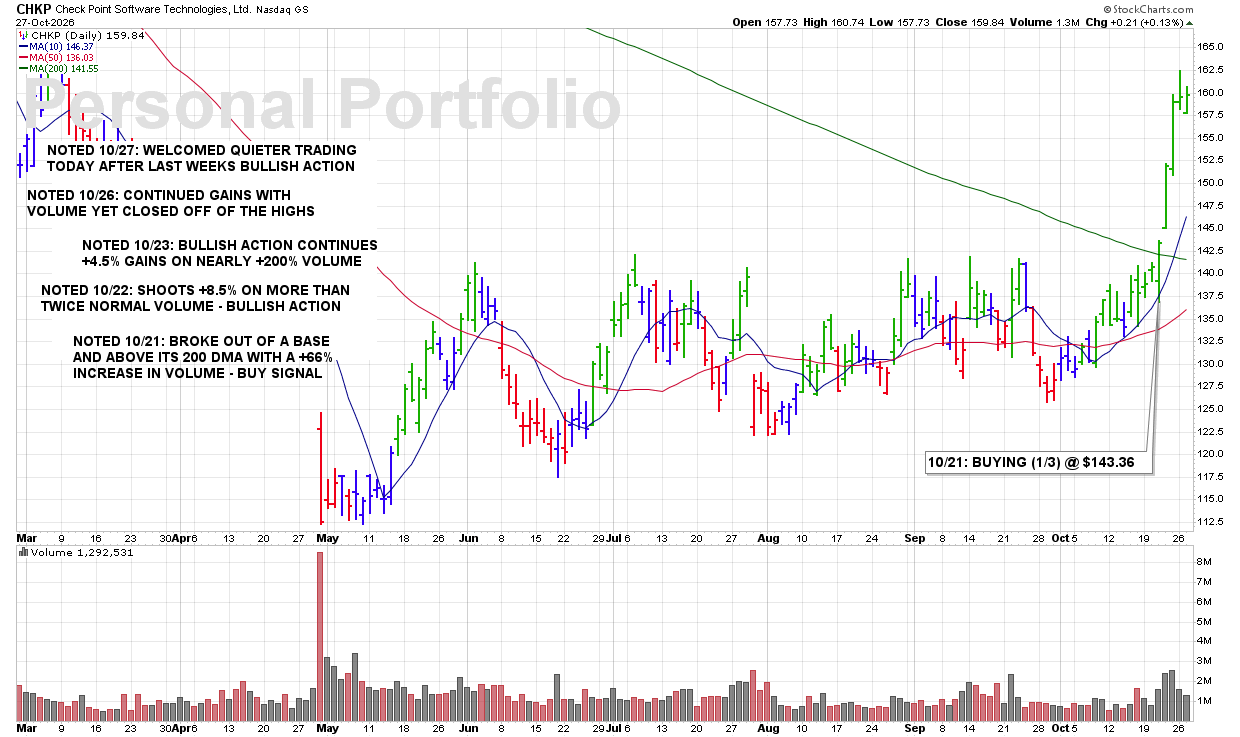
TUE 10/27: CHKP – Welcomed Quieter Trading Today After Last Weeks Bullish Action

8:30 PM – We are currently reporting on this stock as an active holding and continue to monitor the stock closely for any technical SELL SIGNALS.

The focus always remains on price/volume action around key support levels, including the 10 DMA, 50 DMA, and any nearby trendline or ROUND-$ support.

CLICK/TAP CHART TO ZOOM
Chart services courtesy of stockcharts.com. Annotations by James Taulman.

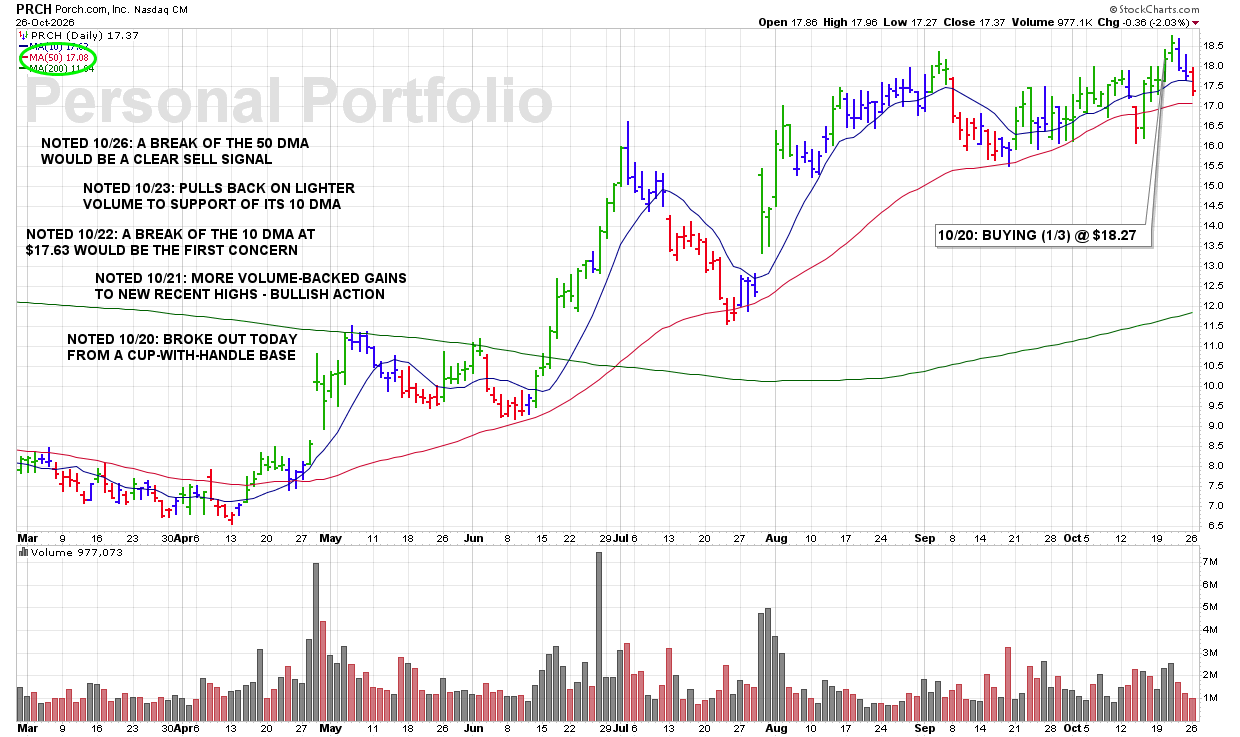
MON 10/26: PRCH – A Break of the 50 DMA Would Be a Clear Sell Signal

8:45 PM – We are currently reporting on this stock as an active holding and continue to monitor the stock closely for any technical SELL SIGNALS.

The focus always remains on price/volume action around key support levels, including the 10 DMA, 50 DMA, and any nearby trendline or ROUND-$ support.

CLICK/TAP CHART TO ZOOM
Chart services courtesy of stockcharts.com. Annotations by James Taulman.

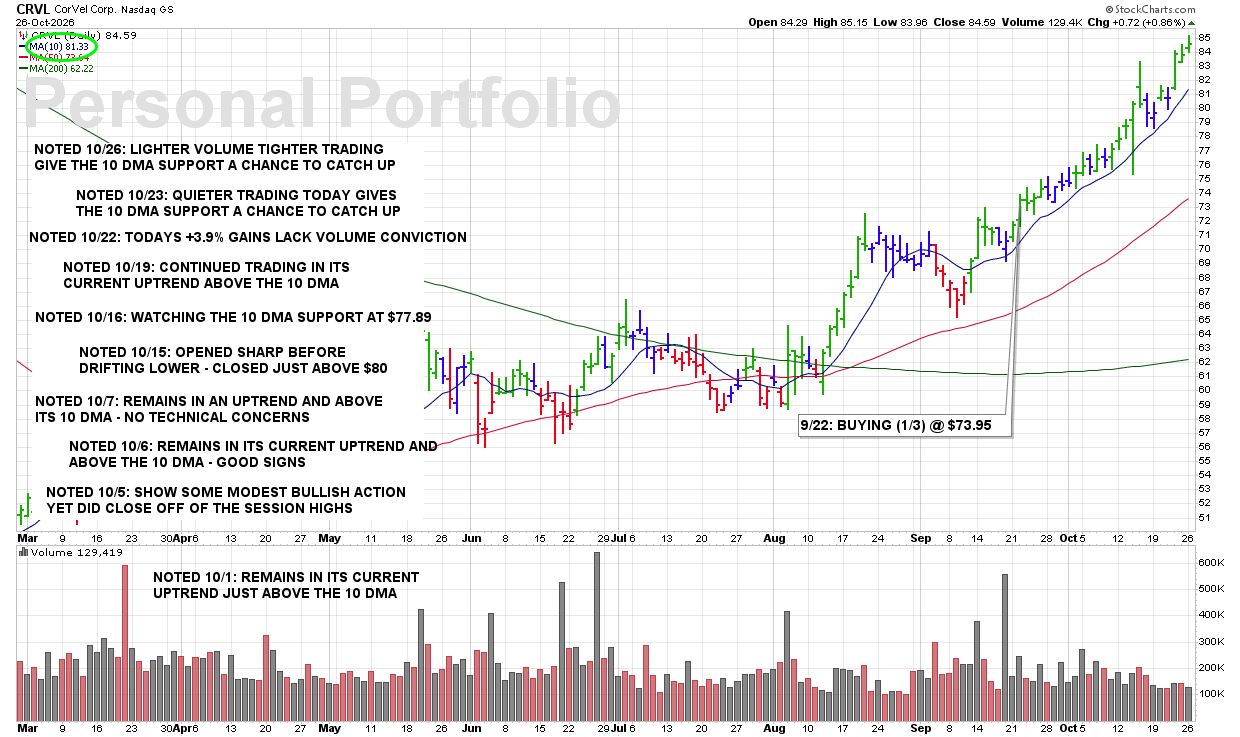
MON 10/26: CRVL – Lighter Volume Tighter Trading Give the 10 DMA Support a Chance to Catch Up

8:30 PM – We are currently reporting on this stock as an active holding and continue to monitor the stock closely for any technical SELL SIGNALS.

The focus always remains on price/volume action around key support levels, including the 10 DMA, 50 DMA, and any nearby trendline or ROUND-$ support.

CLICK/TAP CHART TO ZOOM
Chart services courtesy of stockcharts.com. Annotations by James Taulman.

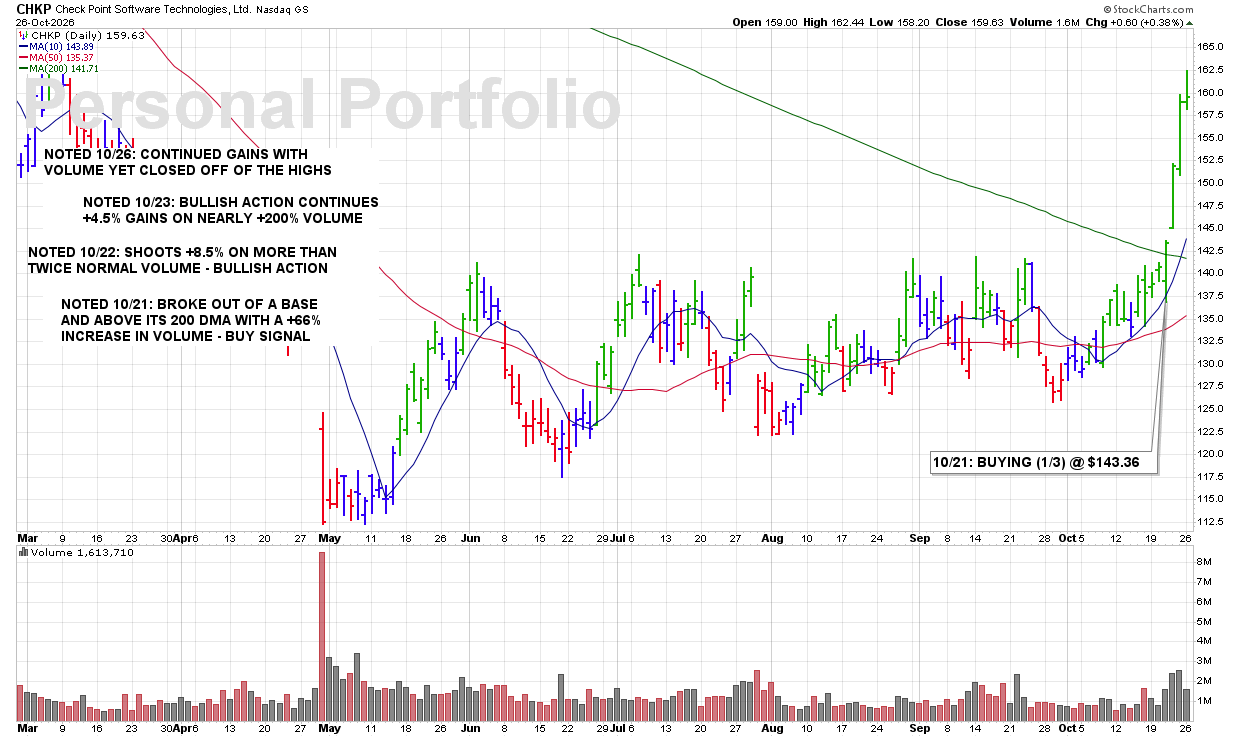
MON 10/26: CHKP – Continued Gains With Volume Yet Closed Off of the Highs

8:20 PM – We are currently reporting on this stock as an active holding and continue to monitor the stock closely for any technical SELL SIGNALS.

The focus always remains on price/volume action around key support levels, including the 10 DMA, 50 DMA, and any nearby trendline or ROUND-$ support.

CLICK/TAP CHART TO ZOOM
Chart services courtesy of stockcharts.com. Annotations by James Taulman.

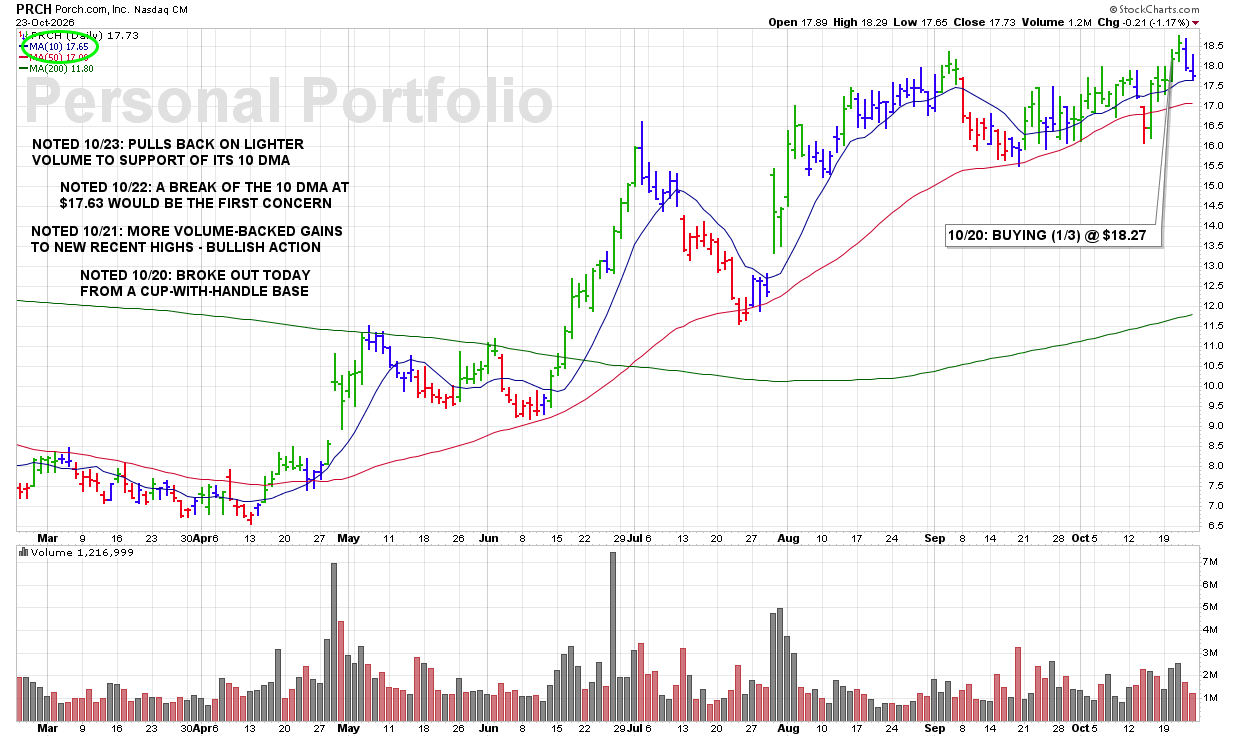
FRI 10/23: PRCH – Pulls Back on Lighter Volume to Support of Its 10 DMA

8:40 PM – We are currently reporting on this stock as an active holding and continue to monitor the stock closely for any technical SELL SIGNALS.

The focus always remains on price/volume action around key support levels, including the 10 DMA, 50 DMA, and any nearby trendline or ROUND-$ support.

CLICK/TAP CHART TO ZOOM
Chart services courtesy of stockcharts.com. Annotations by James Taulman.

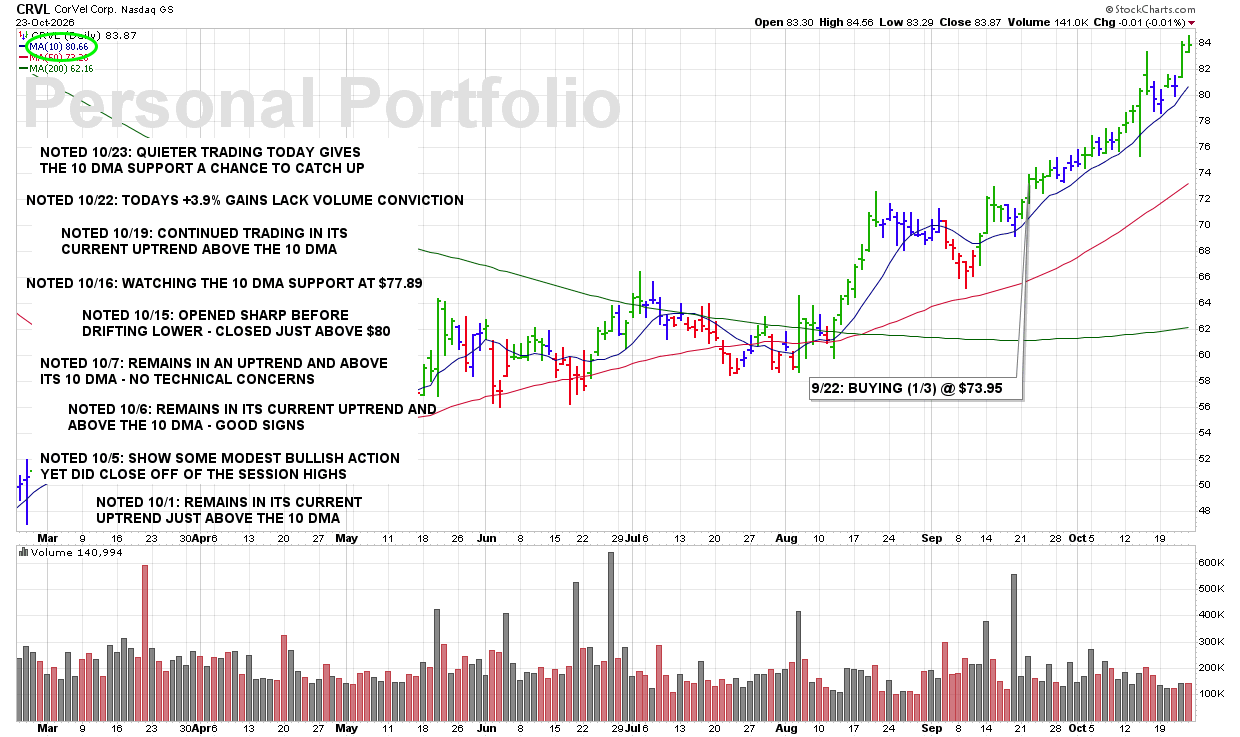
FRI 10/23: CRVL – Quieter Trading Today Gives the 10 DMA Support a Chance to Catch Up

8:15 PM – We are currently reporting on this stock as an active holding and continue to monitor the stock closely for any technical SELL SIGNALS.

The focus always remains on price/volume action around key support levels, including the 10 DMA, 50 DMA, and any nearby trendline or ROUND-$ support.

CLICK/TAP CHART TO ZOOM
Chart services courtesy of stockcharts.com. Annotations by James Taulman.

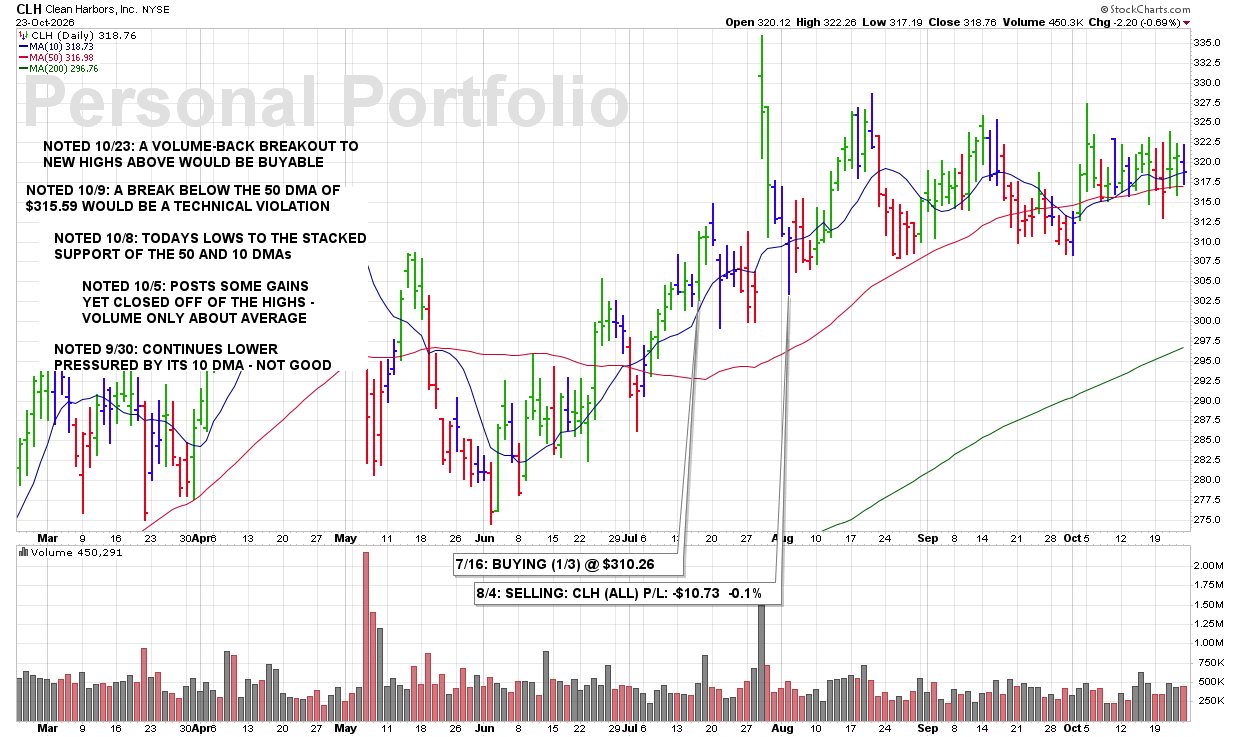
FRI 10/23: CLH – A Volume-Back Breakout to New Highs Above Would Be Buyable

8:05 PM – We are currently reporting on this stock as an active holding and continue to monitor the stock closely for any technical SELL SIGNALS.

The focus always remains on price/volume action around key support levels, including the 10 DMA, 50 DMA, and any nearby trendline or ROUND-$ support.

CLICK/TAP CHART TO ZOOM
Chart services courtesy of stockcharts.com. Annotations by James Taulman.

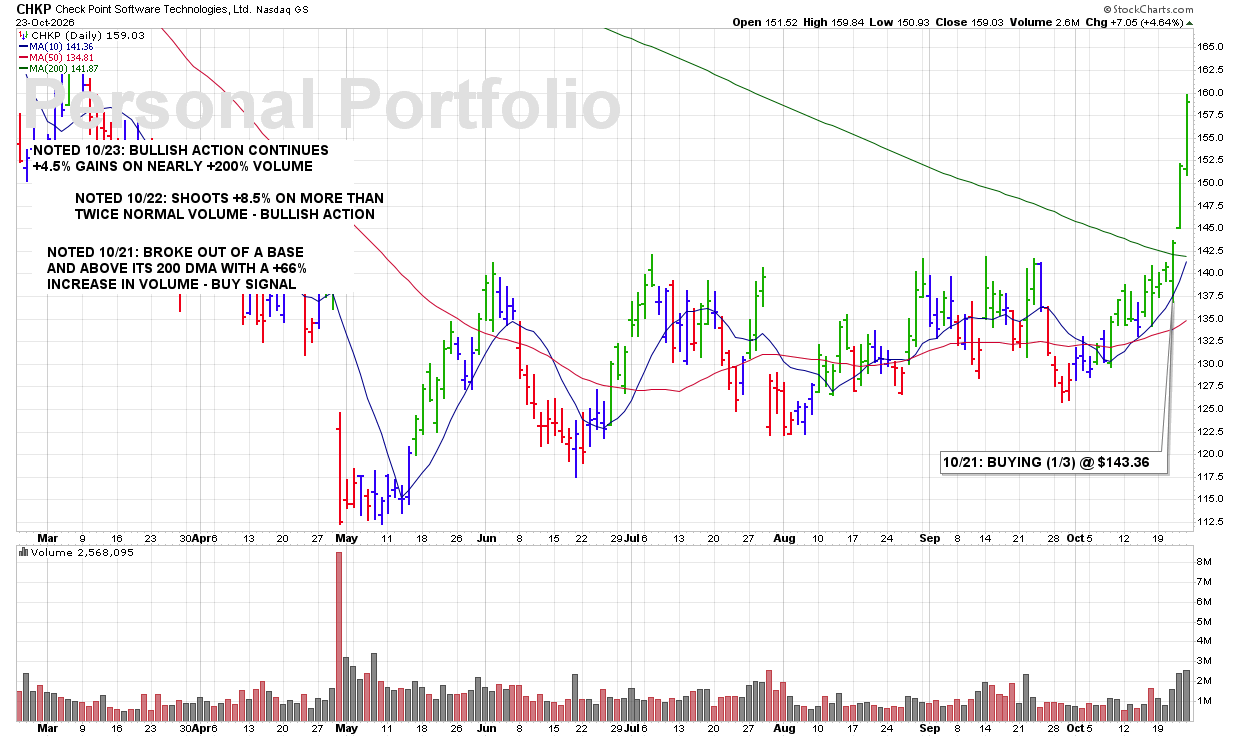
FRI 10/23: CHKP – Bullish Action Continues +4.5% Gains on Nearly +200% Volume

8:00 PM – We are currently reporting on this stock as an active holding and continue to monitor the stock closely for any technical SELL SIGNALS.

The focus always remains on price/volume action around key support levels, including the 10 DMA, 50 DMA, and any nearby trendline or ROUND-$ support.

CLICK/TAP CHART TO ZOOM
Chart services courtesy of stockcharts.com. Annotations by James Taulman.

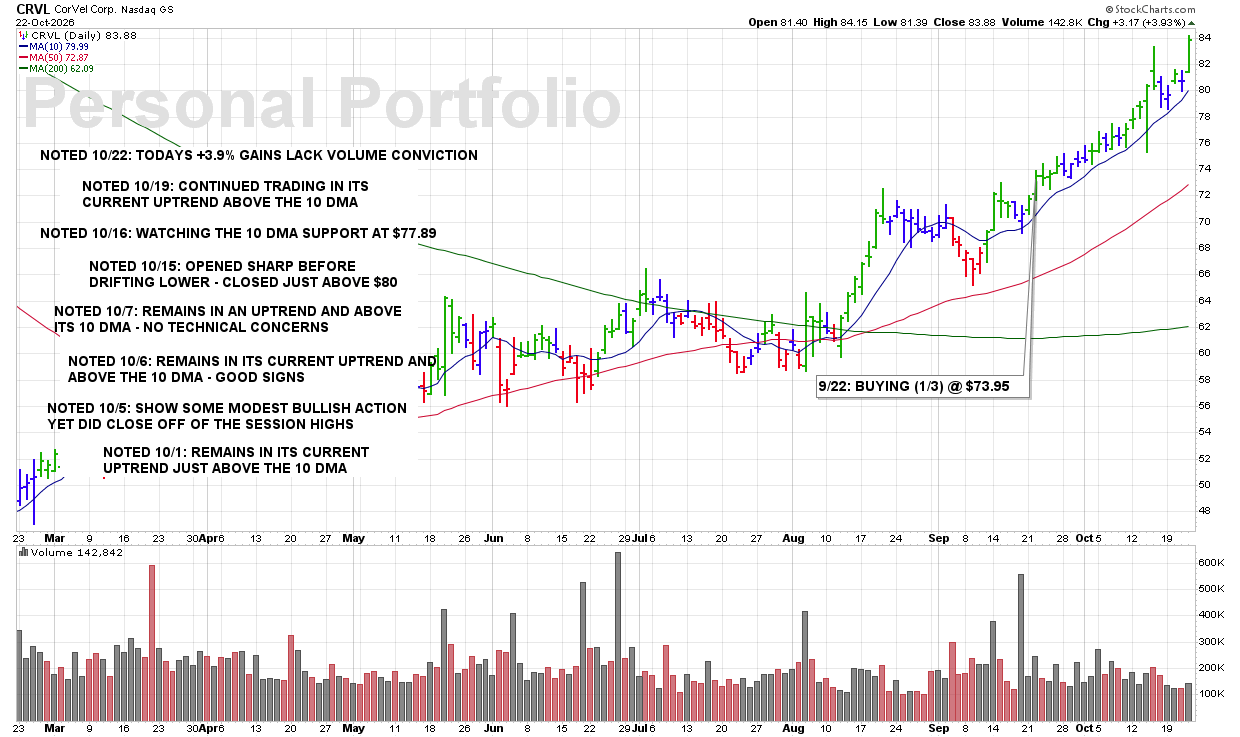
THU 10/22: CRVL – Todays +3.9% Gains Lack Volume Conviction

8:40 PM – We are currently reporting on this stock as an active holding and continue to monitor the stock closely for any technical SELL SIGNALS.

The focus always remains on price/volume action around key support levels, including the 10 DMA, 50 DMA, and any nearby trendline or ROUND-$ support.

CLICK/TAP CHART TO ZOOM
Chart services courtesy of stockcharts.com. Annotations by James Taulman.

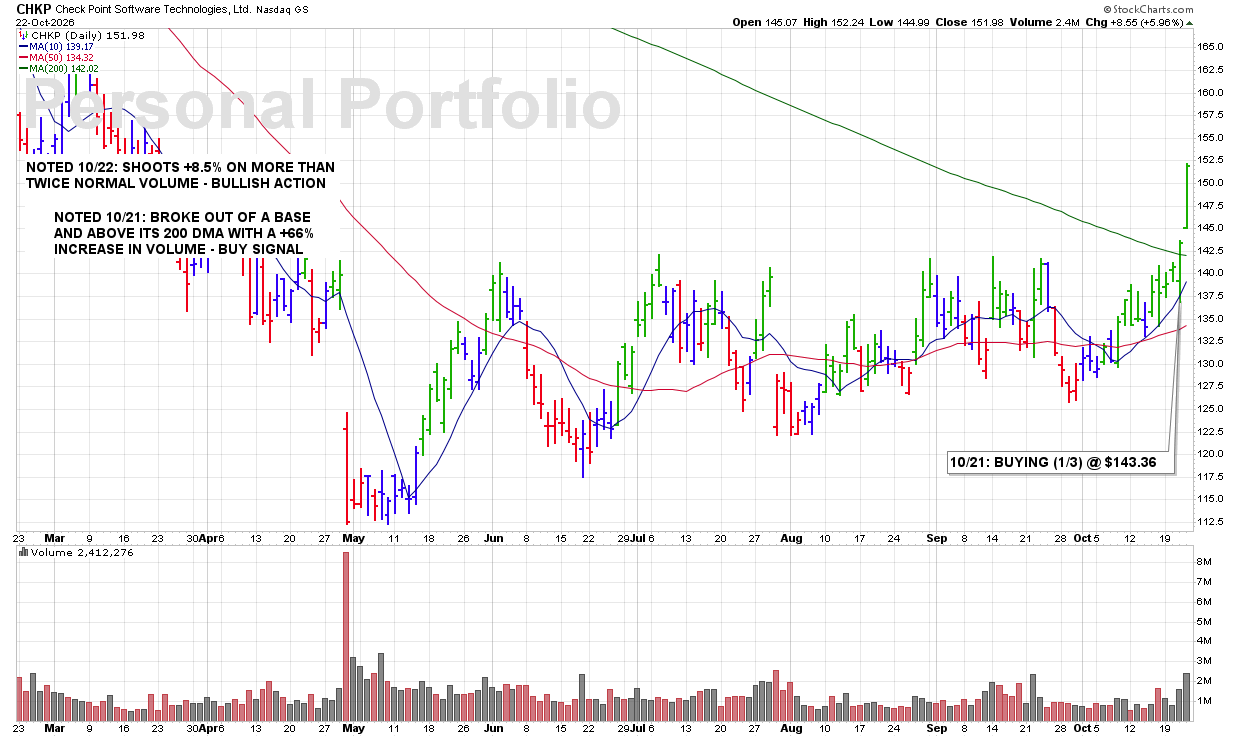
THU 10/22: CHKP – Shoots +8.5% on More Than Twice Normal Volume – Bullish Action

8:35 PM – We are currently reporting on this stock as an active holding and continue to monitor the stock closely for any technical SELL SIGNALS.

The focus always remains on price/volume action around key support levels, including the 10 DMA, 50 DMA, and any nearby trendline or ROUND-$ support.

CLICK/TAP CHART TO ZOOM
Chart services courtesy of stockcharts.com. Annotations by James Taulman.

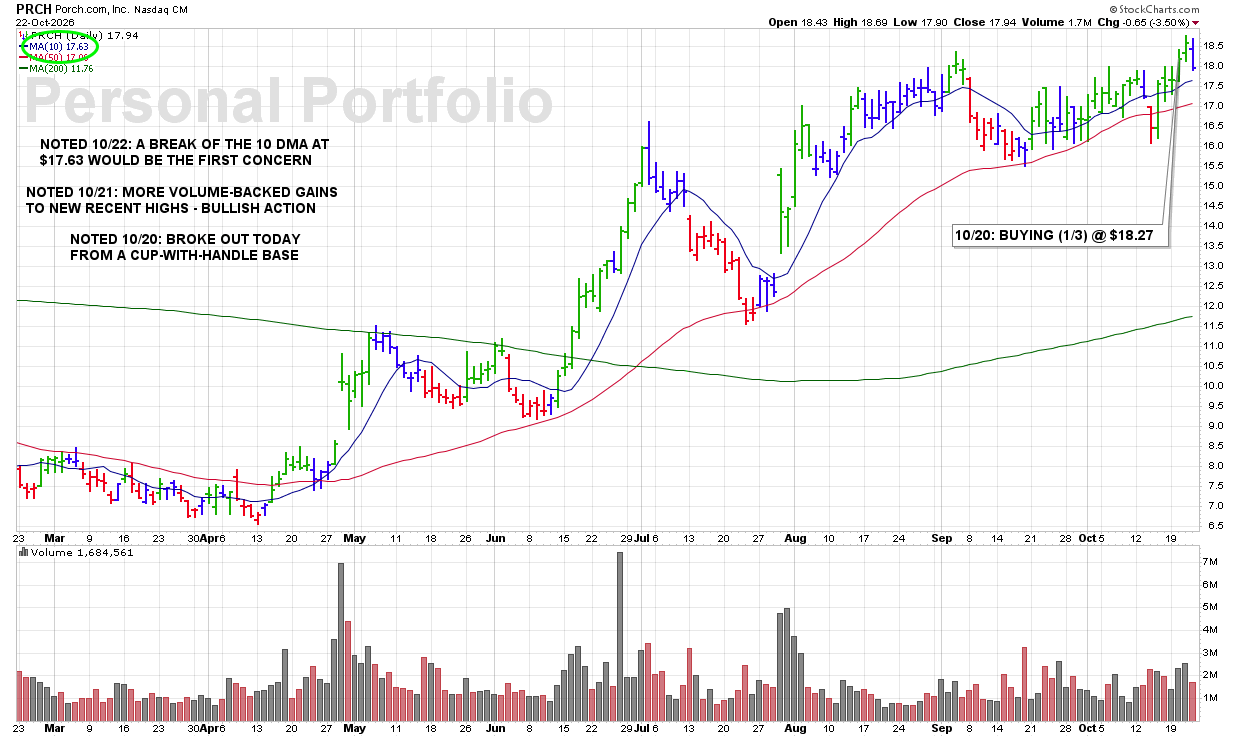
THU 10/22: PRCH – A Break of the 10 DMA at $17.63 Would Be the First Concern

8:30 PM – We are currently reporting on this stock as an active holding and continue to monitor the stock closely for any technical SELL SIGNALS.

The focus always remains on price/volume action around key support levels, including the 10 DMA, 50 DMA, and any nearby trendline or ROUND-$ support.

CLICK/TAP CHART TO ZOOM
Chart services courtesy of stockcharts.com. Annotations by James Taulman.

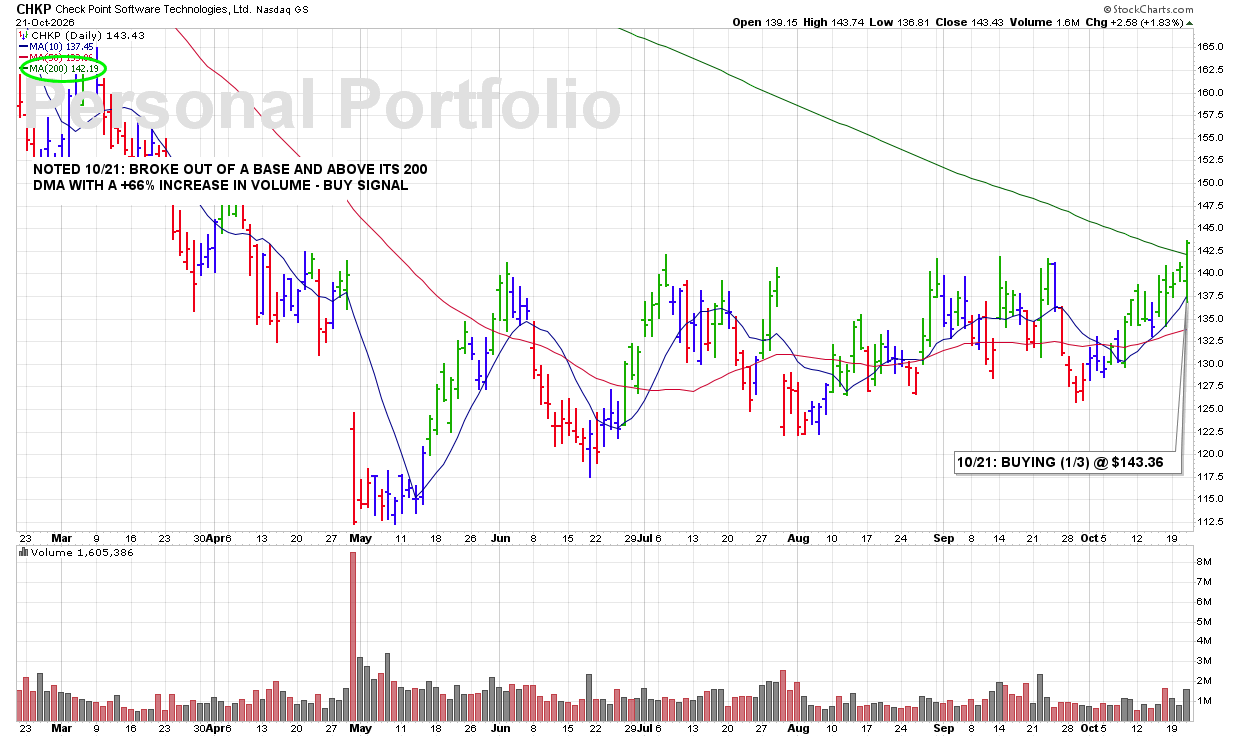
WED 10/21: CHKP – Broke Out of a Base and Above Its 200 DMA With a +66% Increase in Volume – Buy Signal

9:10 PM – We are currently reporting on this stock as an active holding and continue to monitor the stock closely for any technical SELL SIGNALS.

The focus always remains on price/volume action around key support levels, including the 10 DMA, 50 DMA, and any nearby trendline or ROUND-$ support.

CLICK/TAP CHART TO ZOOM
Chart services courtesy of stockcharts.com. Annotations by James Taulman.

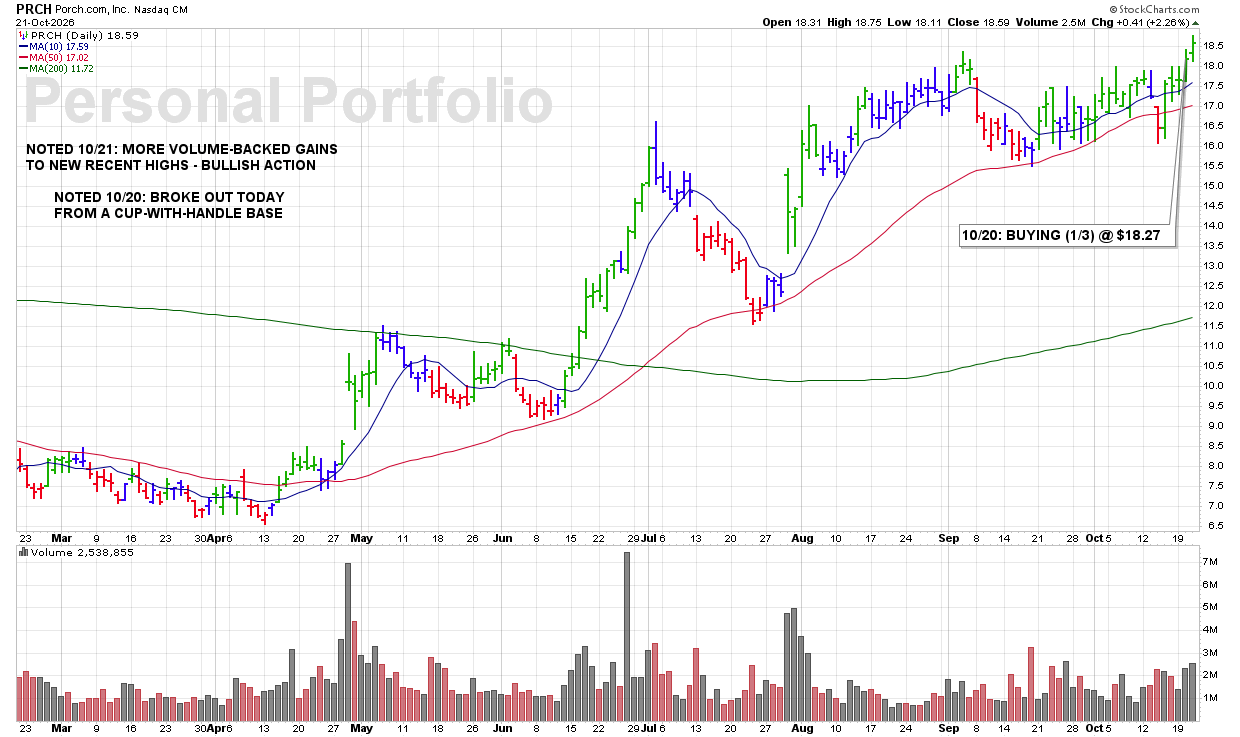
WED 10/21: PRCH – More Volume-Backed Gains to New Recent Highs – Bullish Action

9:00 PM – We are currently reporting on this stock as an active holding and continue to monitor the stock closely for any technical SELL SIGNALS.

The focus always remains on price/volume action around key support levels, including the 10 DMA, 50 DMA, and any nearby trendline or ROUND-$ support.

CLICK/TAP CHART TO ZOOM
Chart services courtesy of stockcharts.com. Annotations by James Taulman.

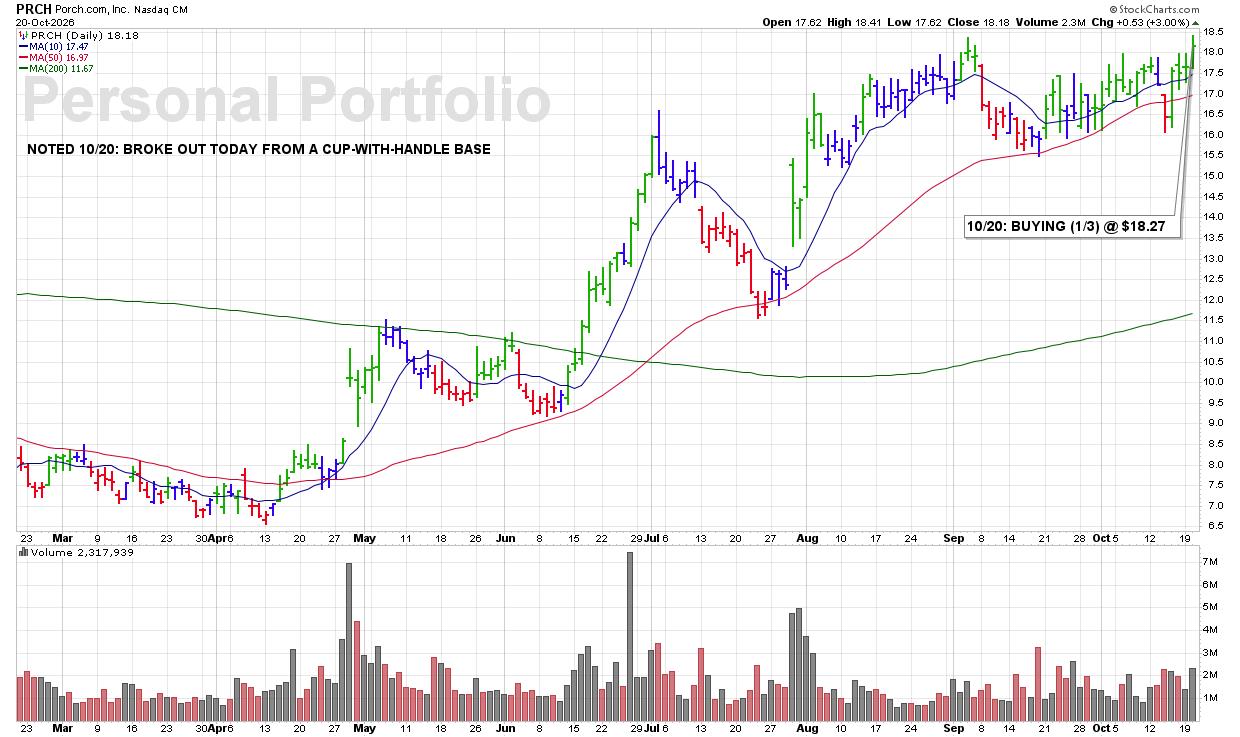
TUE 10/20: PRCH – Broke Out Today From a Cup-With-Handle Base

8:35 PM – We are currently reporting on this stock as an active holding and continue to monitor the stock closely for any technical SELL SIGNALS.

The focus always remains on price/volume action around key support levels, including the 10 DMA, 50 DMA, and any nearby trendline or ROUND-$ support.

CLICK/TAP CHART TO ZOOM
Chart services courtesy of stockcharts.com. Annotations by James Taulman.

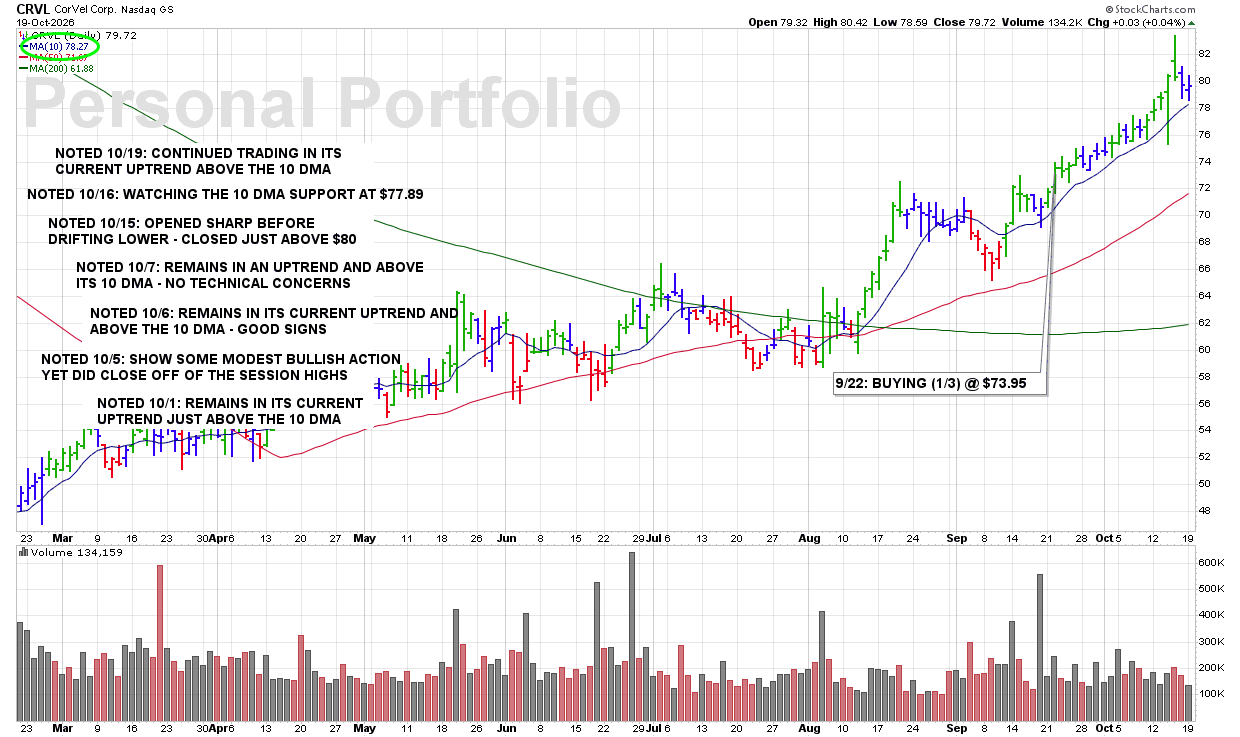
MON 10/19: CRVL – Continued Trading in Its Current Uptrend Above the 10 DMA

8:25 PM – We are currently reporting on this stock as an active holding and continue to monitor the stock closely for any technical SELL SIGNALS.

The focus always remains on price/volume action around key support levels, including the 10 DMA, 50 DMA, and any nearby trendline or ROUND-$ support.

CLICK/TAP CHART TO ZOOM
Chart services courtesy of stockcharts.com. Annotations by James Taulman.

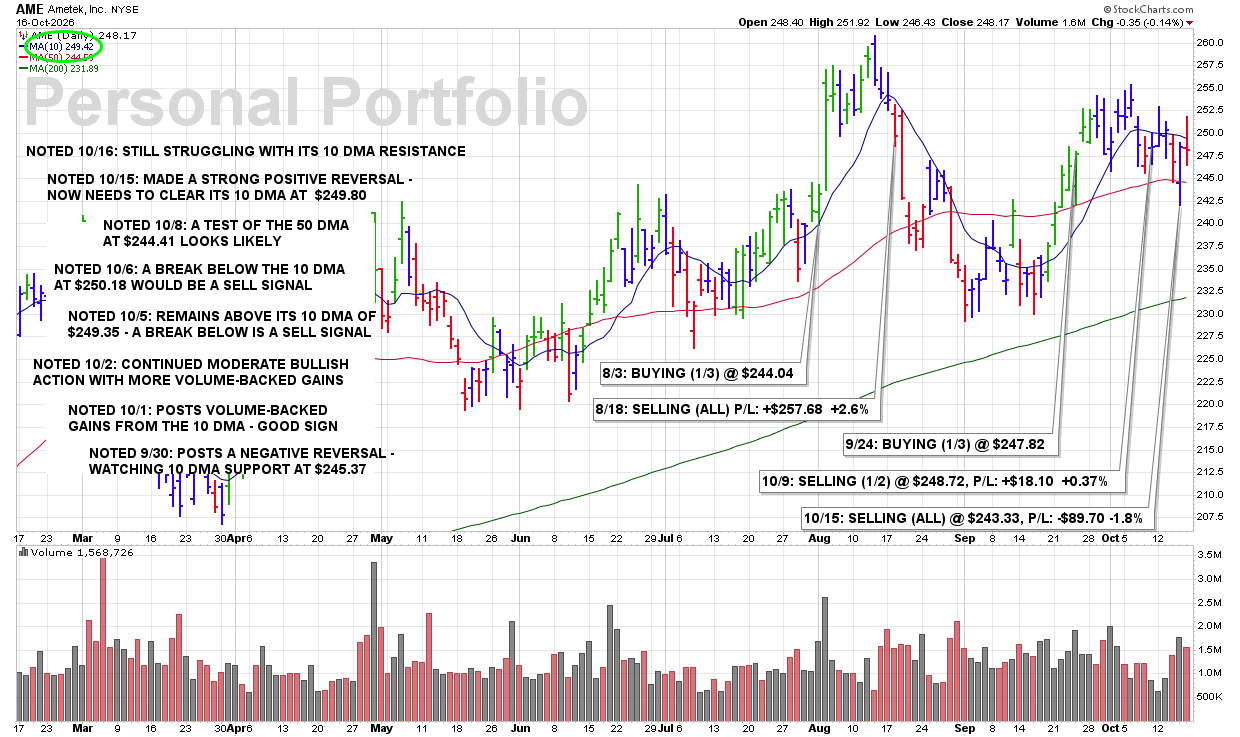
FRI 10/16: AME – Still Struggling With Its 10 DMA Resistance

11:05 PM – We are currently reporting on this stock as an active holding and continue to monitor the stock closely for any technical SELL SIGNALS.

The focus always remains on price/volume action around key support levels, including the 10 DMA, 50 DMA, and any nearby trendline or ROUND-$ support.

CLICK/TAP CHART TO ZOOM
Chart services courtesy of stockcharts.com. Annotations by James Taulman.

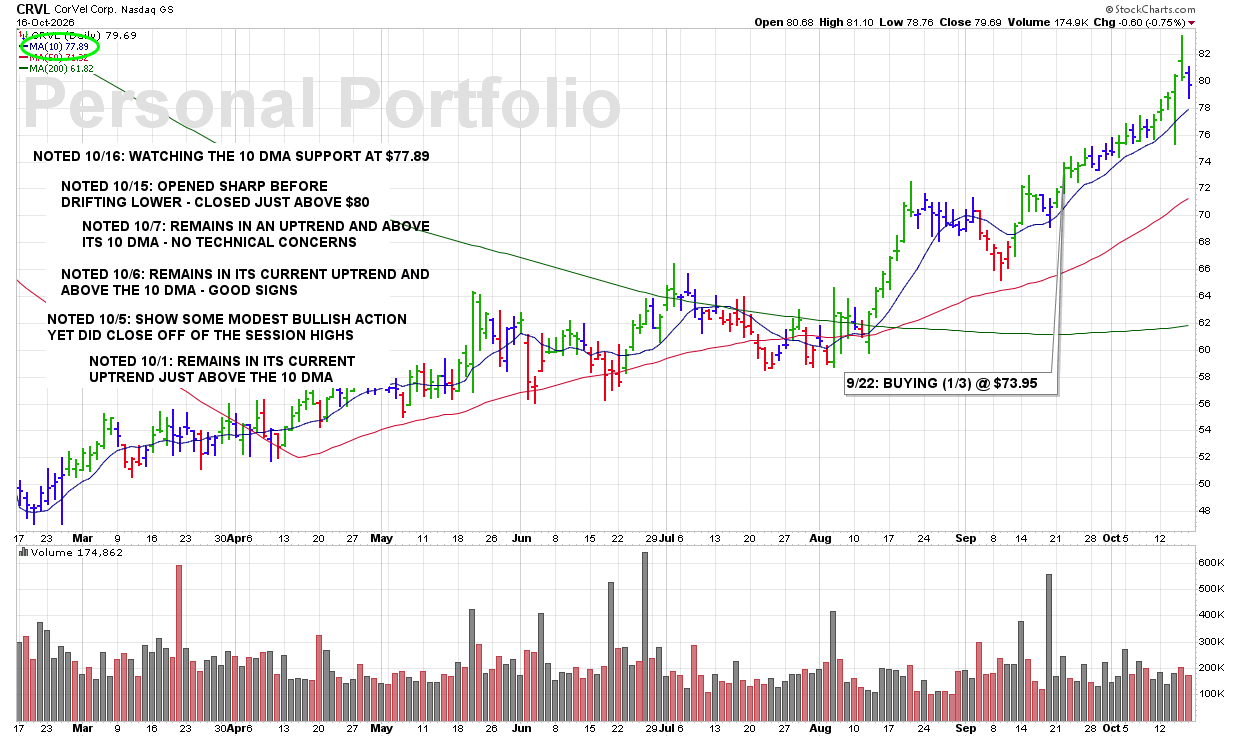
FRI 10/16: CRVL – Watching The 10 DMA Support At $77.89

10:55 PM – We are currently reporting on this stock as an active holding and continue to monitor the stock closely for any technical SELL SIGNALS.

The focus always remains on price/volume action around key support levels, including the 10 DMA, 50 DMA, and any nearby trendline or ROUND-$ support.

CLICK/TAP CHART TO ZOOM
Chart services courtesy of stockcharts.com. Annotations by James Taulman.

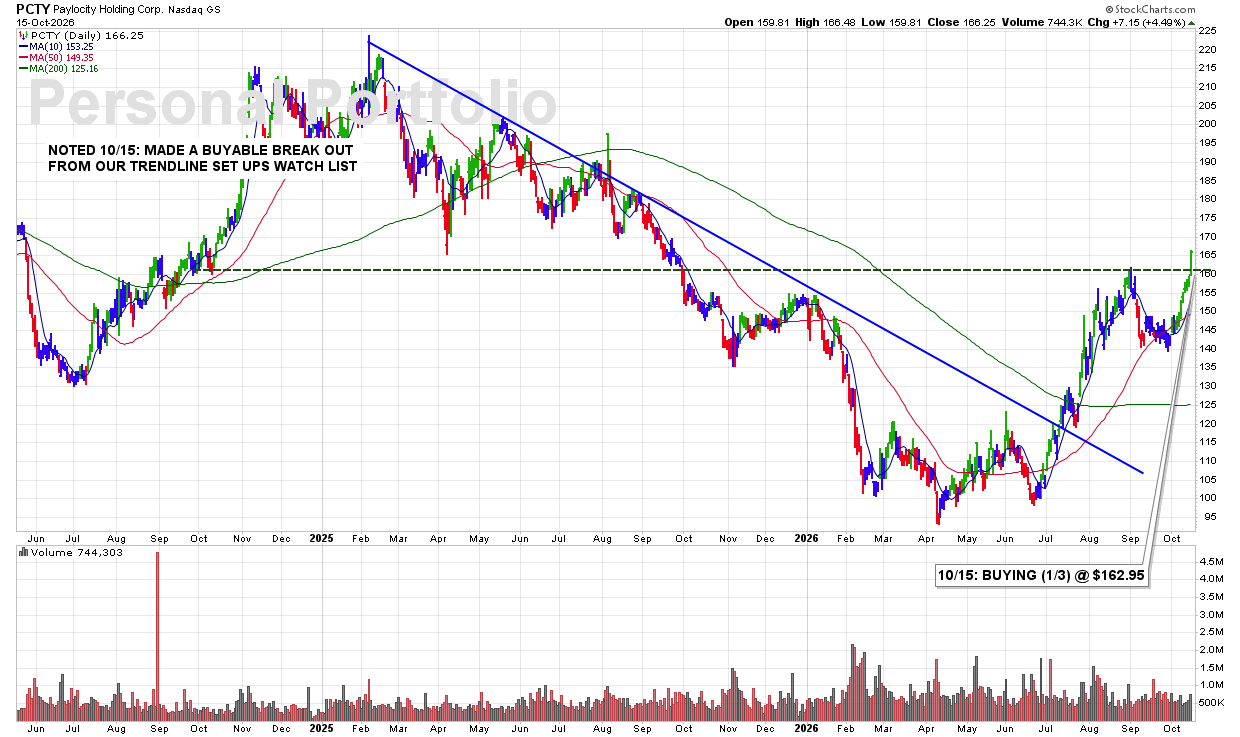
THU 10/15: PCTY — Breaks Out From Our TrendLine BreakOuts Watch List — BUY SIGNAL

11:13 PM – Started a 1/3 position in this Computer Software-Enterprise stock today as shares broke out from a technical pattern we had been monitoring on our TrendLine BreakOuts Watch List.

The breakout represents a bullish technical development and gives me enough confirmation to initiate a starter position under our ULTRA trading rules.

James’ Trader’s Tip: Watch List Breakouts Create Buying Opportunities

  • Our TrendLine BreakOuts Watch List identifies stocks approaching important technical breakout levels.
  • A decisive move above a defined trendline can signal improving price strength and trigger a BUY SIGNAL.
  • Starting with a 1/3 position allows us to participate in the breakout while leaving room to add as the stock confirms its strength.

CLICK/TAP CHART TO ZOOM
Chart services courtesy of stockcharts.com. Annotations by James Taulman.

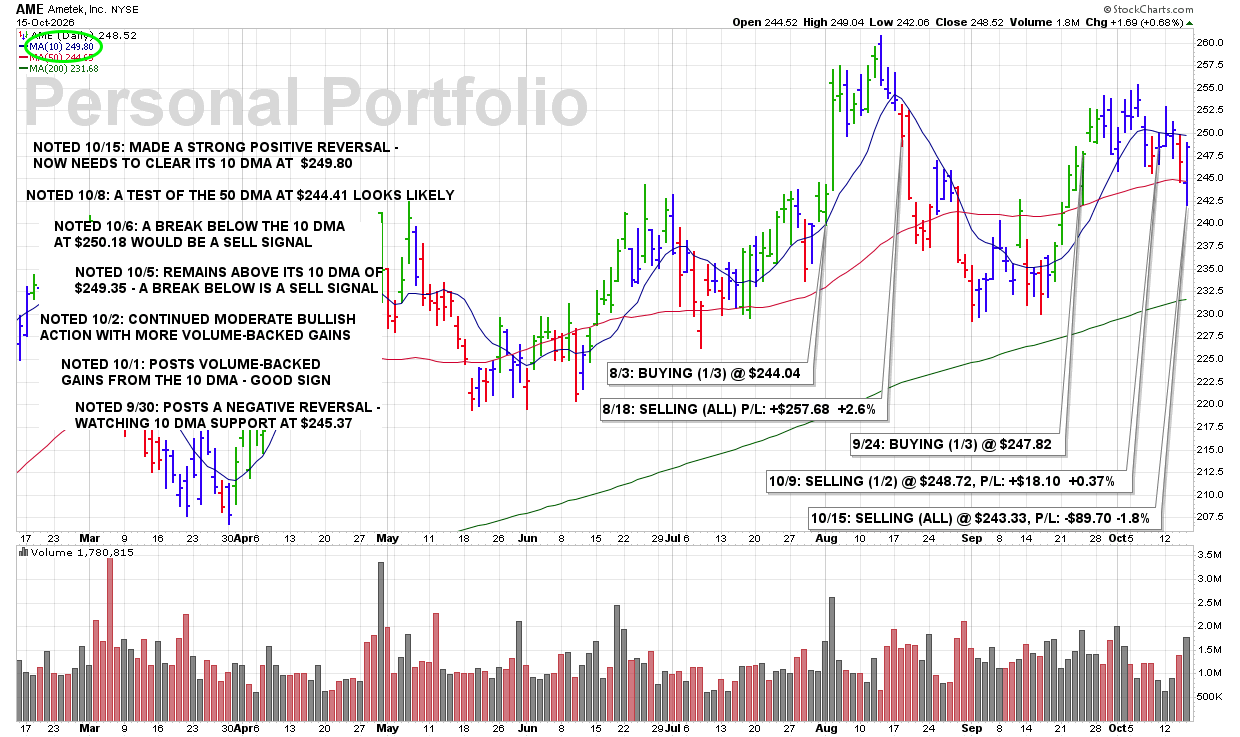
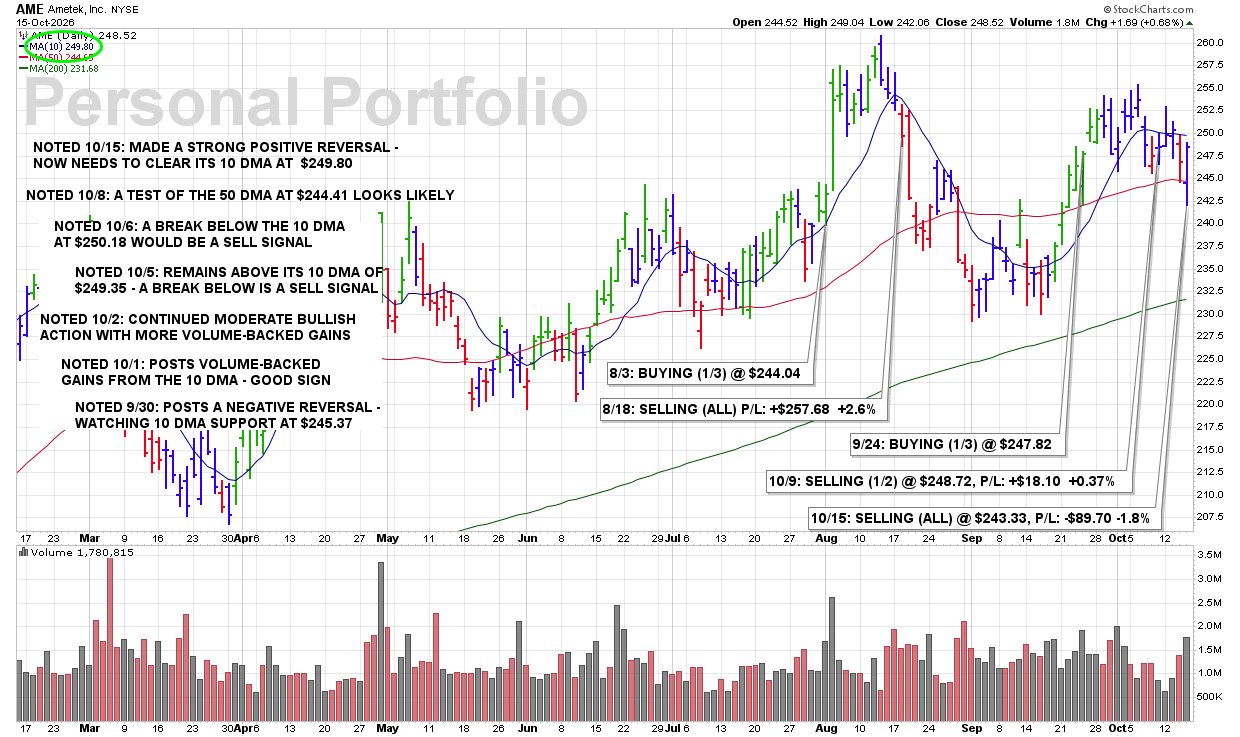
THU 10/15: AME – Made a Strong Positive Reversal – Now Needs to Clear Its 10 DMA at $249.80

11:05 PM – We are currently reporting on this stock as an active holding and continue to monitor the stock closely for any technical SELL SIGNALS.

The focus always remains on price/volume action around key support levels, including the 10 DMA, 50 DMA, and any nearby trendline or ROUND-$ support.

CLICK/TAP CHART TO ZOOM
Chart services courtesy of stockcharts.com. Annotations by James Taulman.

THU 10/15: AME — Breaks Below Its 50 DMA — Sold All on a Technical Violation

11:01 PM – Sold the last of my AME position this morning as the stock has continued to display bearish technical action. Shares have been forming a series of lower highs and have now triggered another significant technical violation with a break below the 50 DMA.

I did notice that shares staged an impressive positive reversal into the close. However, the stock still needs to reclaim its 10 DMA near $249.80, which remains an important resistance level. A turn-back from that line would be another bearish sign and further confirmation of the developing weakness.

Despite today’s recovery, the technical violations were enough for me to follow the rules and exit the position completely. This freed-up capital for other purchases I made today including CNNE.

James’ Trader’s Tip: A Positive Reversal Doesn’t Erase Previous Weakness

  • A series of lower highs can signal deteriorating price strength before a major support level breaks.
  • A positive reversal is encouraging, but the stock must reclaim key resistance levels to demonstrate a meaningful technical recovery.
  • A turn-back from the 10 DMA following a break below the 50 DMA would add another bearish sign. Follow the technical evidence, not the hope of a recovery.

CLICK/TAP CHART TO ZOOM
Chart services courtesy of stockcharts.com. Annotations by James Taulman.

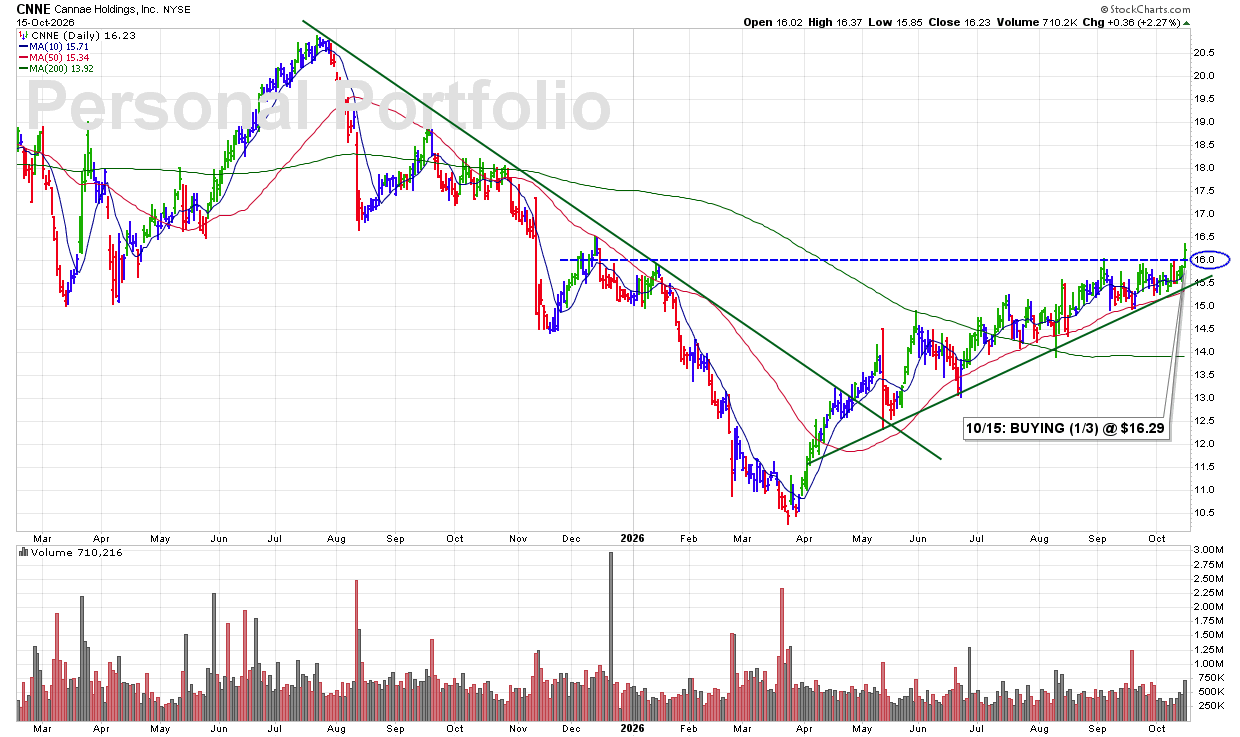
THU 10/15: CNNE — Breaks Above $16 With Strong Volume — BUY SIGNAL

10:56 PM – I started a 1/3 position in this Finance-Investment Management company, which was first introduced on our TrendLine BreakOuts Watch List just a couple of days ago.

Today, shares broke out above $16 with volume running 42% above average. That combination of a breakout above resistance and increased volume is what I consider a clear technical BUY SIGNAL.

This also comes alongside today’s bullish action in the broader market, where I’m finally seeing some meaningful volume return and several of the types of stocks we favor making strong moves. These are encouraging developments that I haven’t seen much of recently.

James’ Trader’s Tip: Look for Breakouts Supported by Volume

  • A breakout above a clearly defined resistance level is an important sign of improving technical strength.
  • Above-average volume adds conviction by showing increased demand behind the move.
  • When multiple leading stocks begin breaking out together, it can signal improving conditions for new BUY SIGNALS.

CLICK/TAP CHART TO ZOOM
Chart services courtesy of stockcharts.com. Annotations by James Taulman.

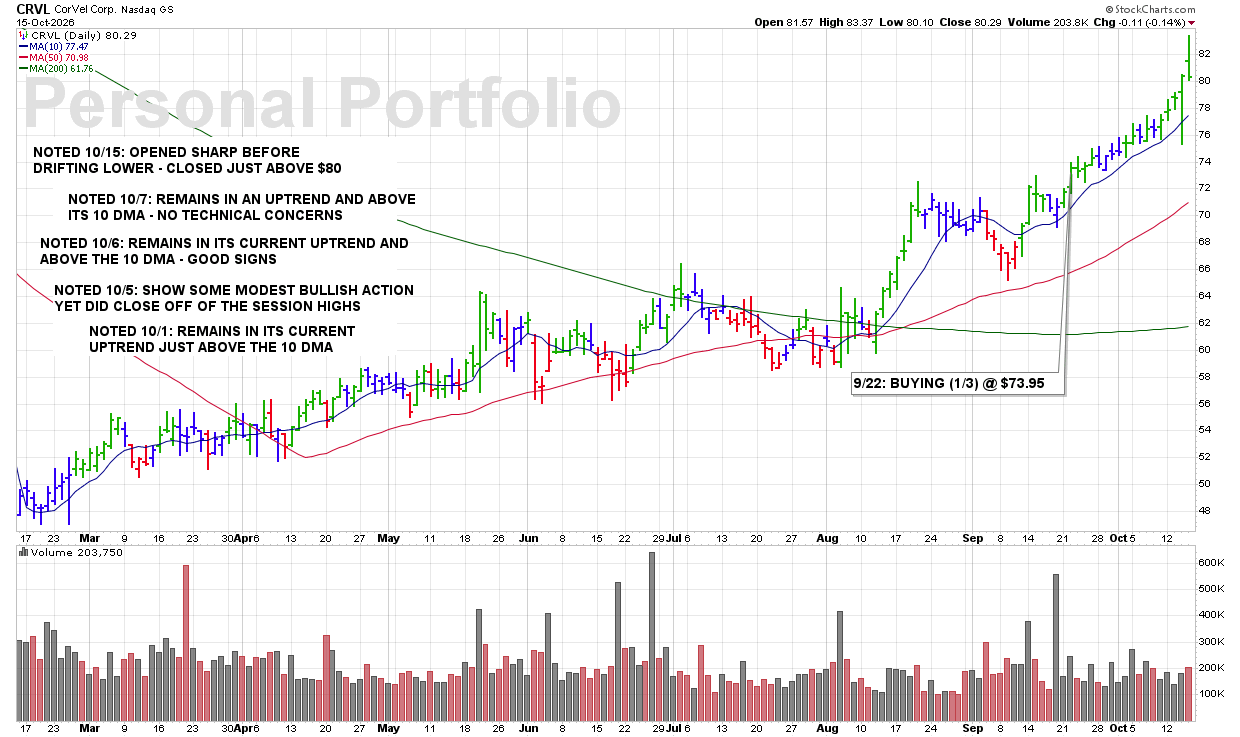
THU 10/15: CRVL – Opened Sharp Before Drifting Lower – Closed Just Above $80

10:55 PM – We are currently reporting on this stock as an active holding and continue to monitor the stock closely for any technical SELL SIGNALS.

The focus always remains on price/volume action around key support levels, including the 10 DMA, 50 DMA, and any nearby trendline or ROUND-$ support.

CLICK/TAP CHART TO ZOOM
Chart services courtesy of stockcharts.com. Annotations by James Taulman.

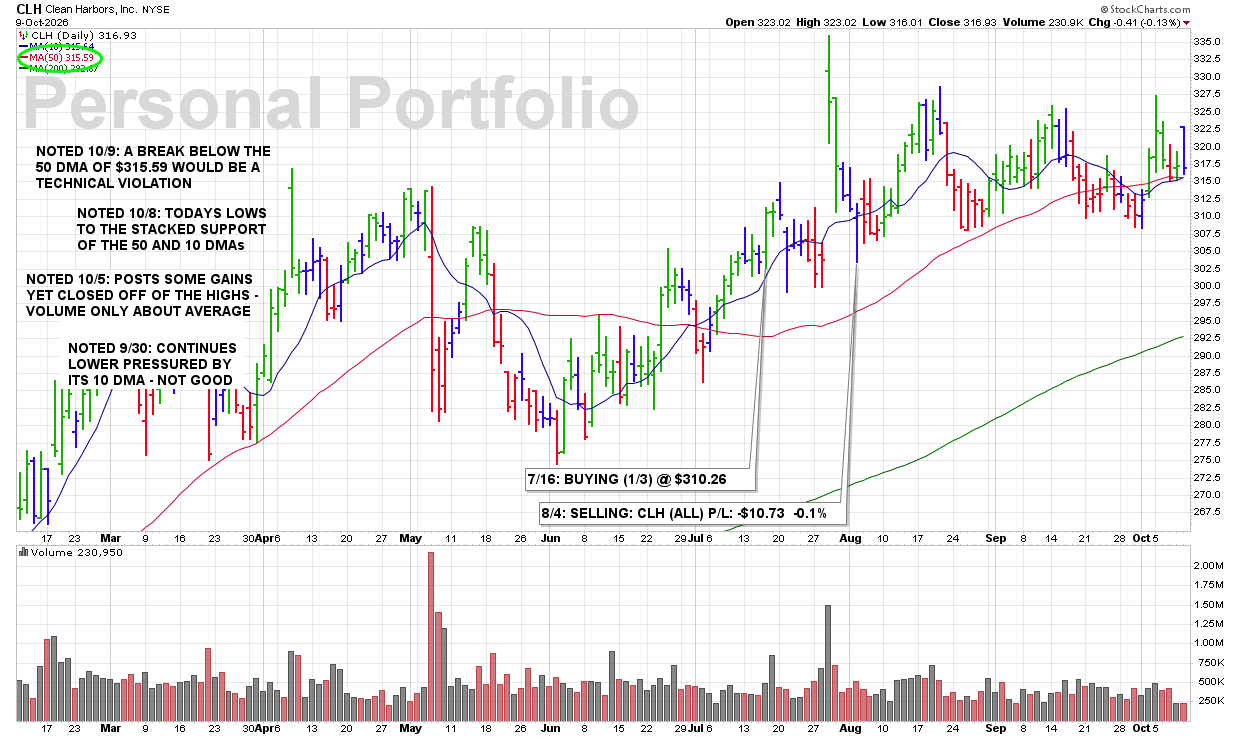
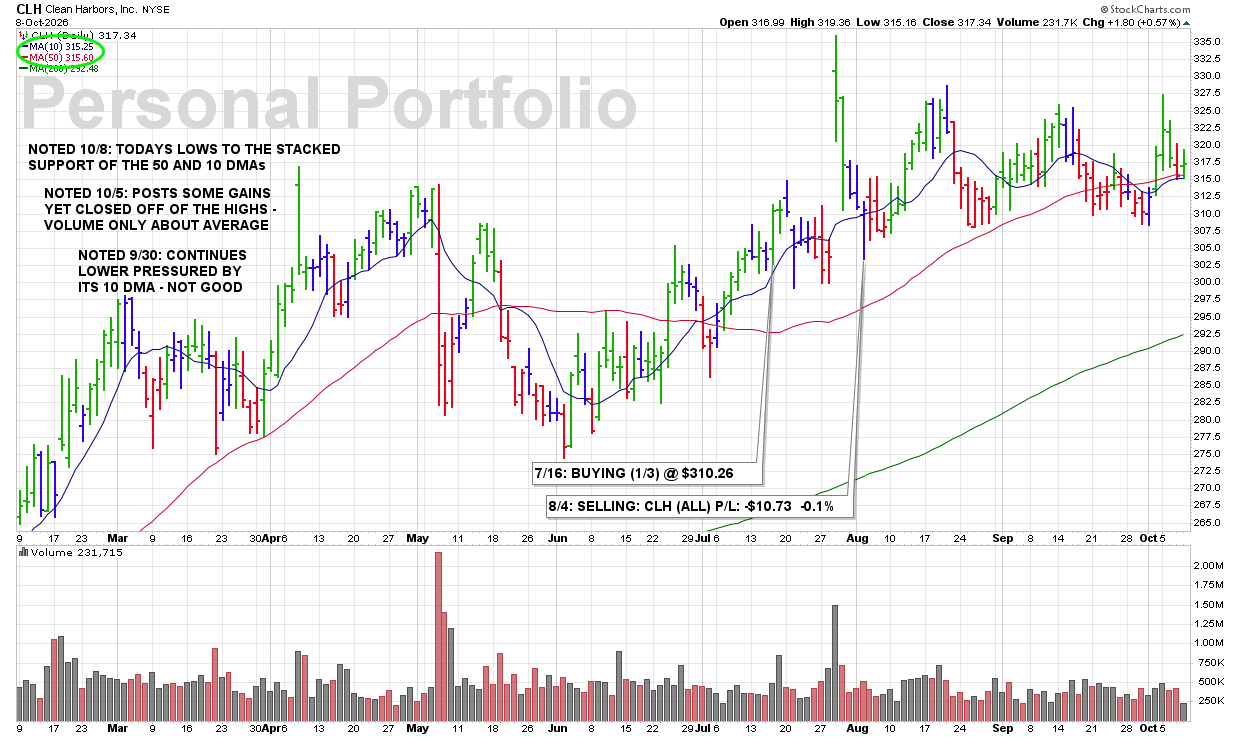
FRI 10/9: CLH – A Break Below The 50 DMA Of $315.59 Would Be A Technical Violation

8:10 PM – We are currently reporting on this stock as an active holding and continue to monitor the stock closely for any technical SELL SIGNALS.

The focus always remains on price/volume action around key support levels, including the 10 DMA, 50 DMA, and any nearby trendline or ROUND-$ support.

CLICK/TAP CHART TO ZOOM
Chart services courtesy of stockcharts.com. Annotations by James Taulman.

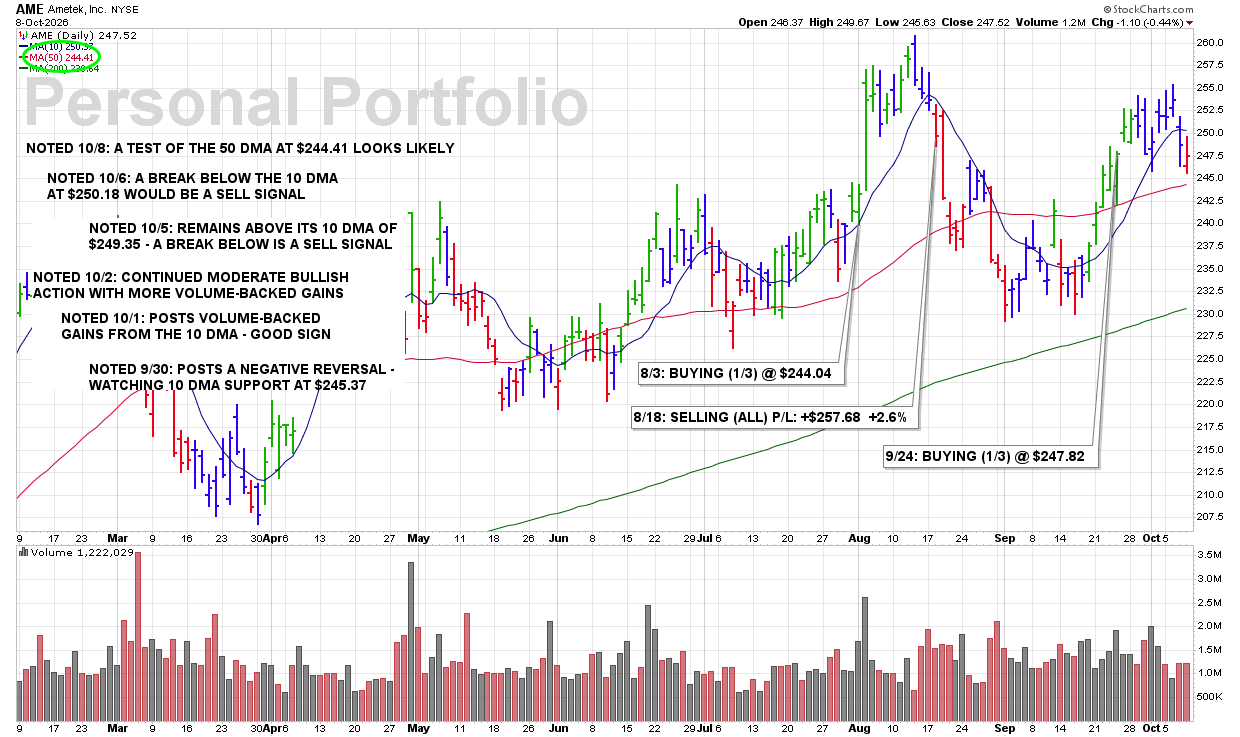
THU 10/8: AME – A Test Of The 50 DMA At $244.41 Looks Likely

7:55 PM – We are currently reporting on this stock as an active holding and continue to monitor the stock closely for any technical SELL SIGNALS.

The focus always remains on price/volume action around key support levels, including the 10 DMA, 50 DMA, and any nearby trendline or ROUND-$ support.

CLICK/TAP CHART TO ZOOM
Chart services courtesy of stockcharts.com. Annotations by James Taulman.

THU 10/8: CLH – Todays Lows to the Stacked Support of the 50 and 10 DMAs

7:50 PM – We are currently reporting on this stock as an active holding and continue to monitor the stock closely for any technical SELL SIGNALS.

The focus always remains on price/volume action around key support levels, including the 10 DMA, 50 DMA, and any nearby trendline or ROUND-$ support.

CLICK/TAP CHART TO ZOOM
Chart services courtesy of stockcharts.com. Annotations by James Taulman.

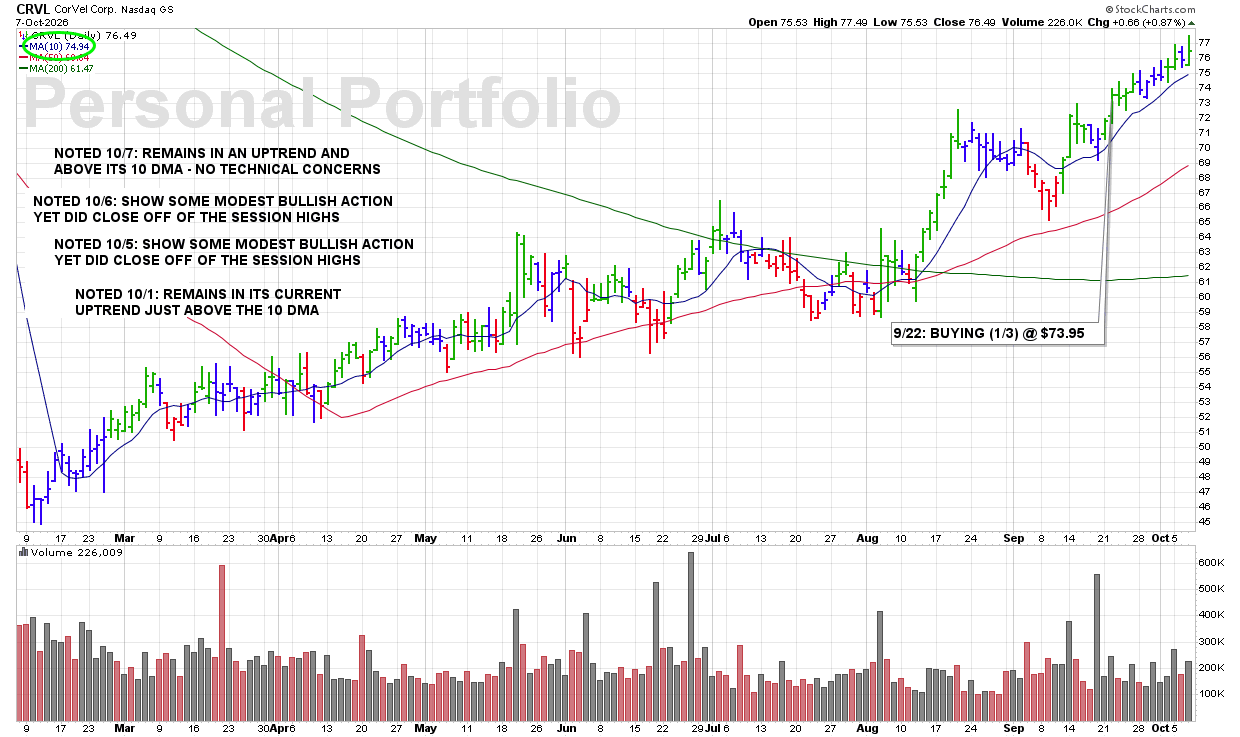
WED 10/7: CRVL – Remains in an Uptrend and Above Its 10 DMA – No Technical Concerns

7:45 PM – We are currently reporting on this stock as an active holding and continue to monitor the stock closely for any technical SELL SIGNALS.

The focus always remains on price/volume action around key support levels, including the 10 DMA, 50 DMA, and any nearby trendline or ROUND-$ support.

CLICK/TAP CHART TO ZOOM
Chart services courtesy of stockcharts.com. Annotations by James Taulman.

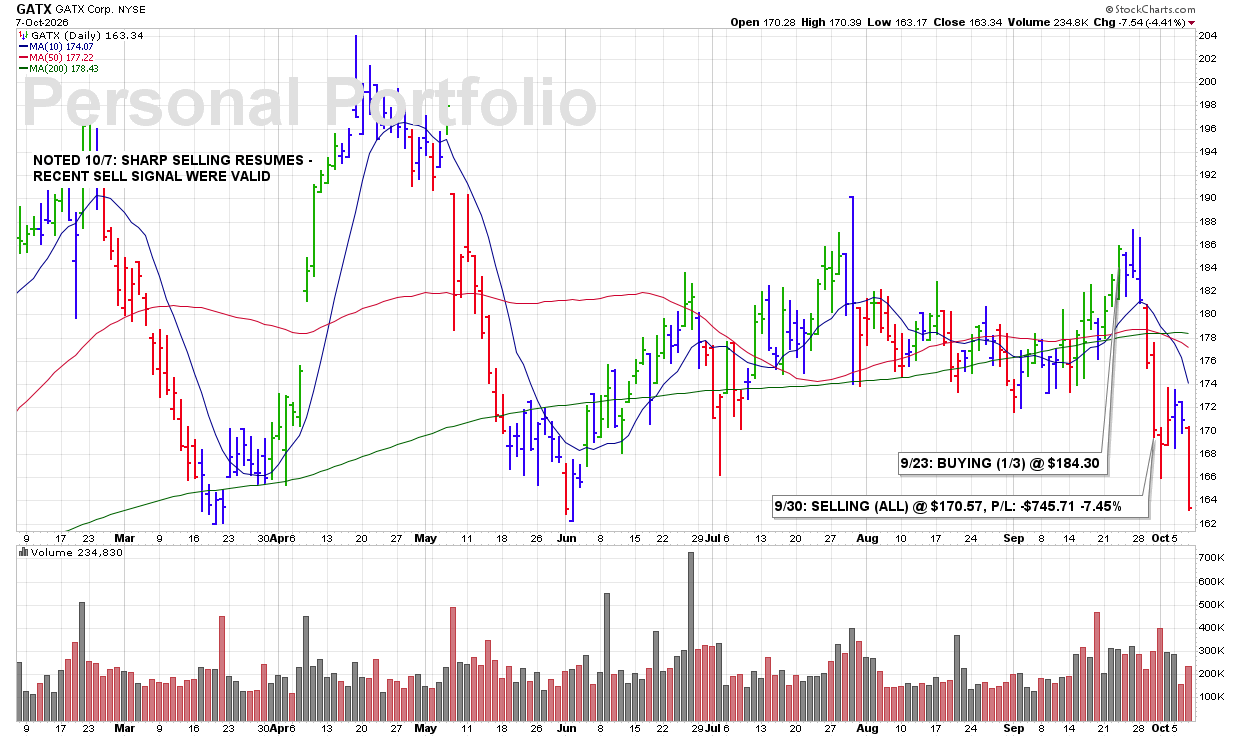
WED 10/7: GATX – Sharp Selling Resumes – Recent Sell Signal Were Valid

7:40 PM – We are currently reporting on this stock as an active holding and continue to monitor the stock closely for any technical SELL SIGNALS.

The focus always remains on price/volume action around key support levels, including the 10 DMA, 50 DMA, and any nearby trendline or ROUND-$ support.

CLICK/TAP CHART TO ZOOM
Chart services courtesy of stockcharts.com. Annotations by James Taulman.

TUE 10/6: CRVL – Remains in Its Current Uptrend and Above the 10 DMA – Good Signs

8:00 PM – We are currently reporting on this stock as an active holding and continue to monitor the stock closely for any technical SELL SIGNALS.

The focus always remains on price/volume action around key support levels, including the 10 DMA, 50 DMA, and any nearby trendline or ROUND-$ support.

CLICK/TAP CHART TO ZOOM
Chart services courtesy of stockcharts.com. Annotations by James Taulman.

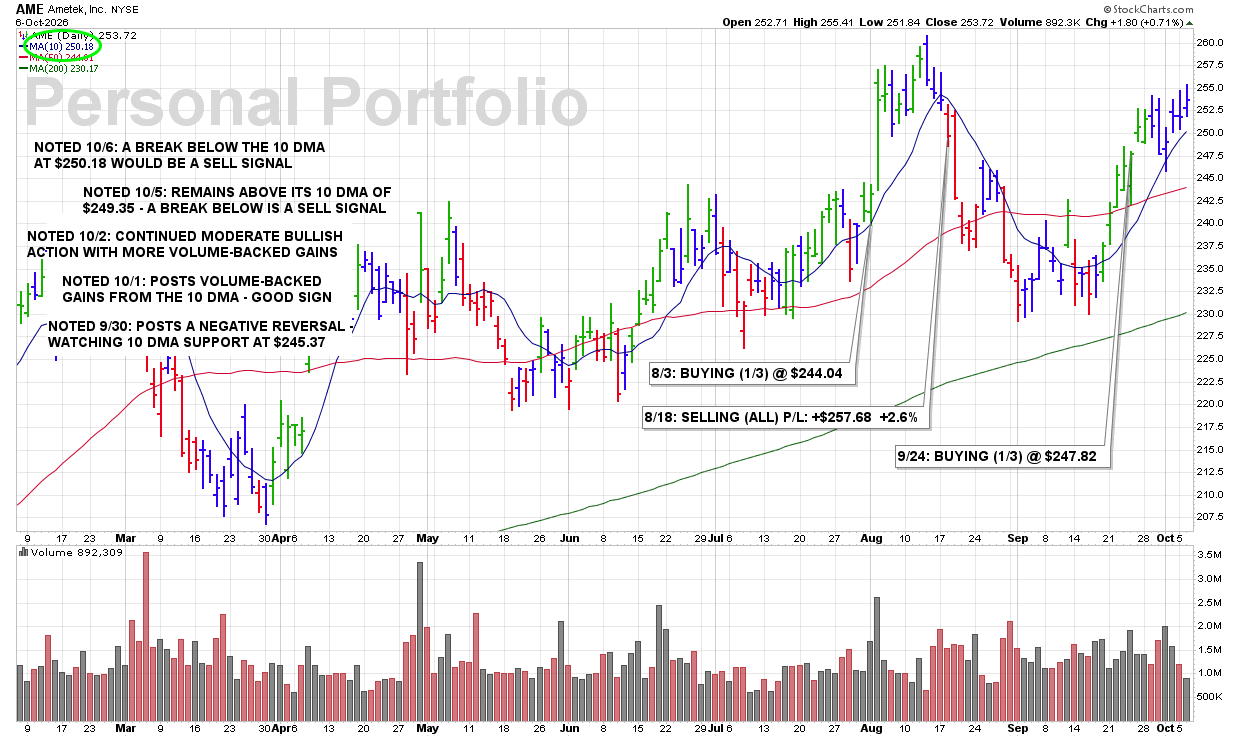
TUE 10/6: AME – A Break Below the 10 DMA at $250.18 Would Be a Sell Signal

7:55 PM – We are currently reporting on this stock as an active holding and continue to monitor the stock closely for any technical SELL SIGNALS.

The focus always remains on price/volume action around key support levels, including the 10 DMA, 50 DMA, and any nearby trendline or ROUND-$ support.

CLICK/TAP CHART TO ZOOM
Chart services courtesy of stockcharts.com. Annotations by James Taulman.

MON 10/5: CLH – Posts Some Gains Yet Closed Off of the Highs – Volume Only About Average

7:55 PM – We are currently reporting on this stock as an active holding and continue to monitor the stock closely for any technical SELL SIGNALS.

The focus always remains on price/volume action around key support levels, including the 10 DMA, 50 DMA, and any nearby trendline or ROUND-$ support.

CLICK/TAP CHART TO ZOOM
Chart services courtesy of stockcharts.com. Annotations by James Taulman.

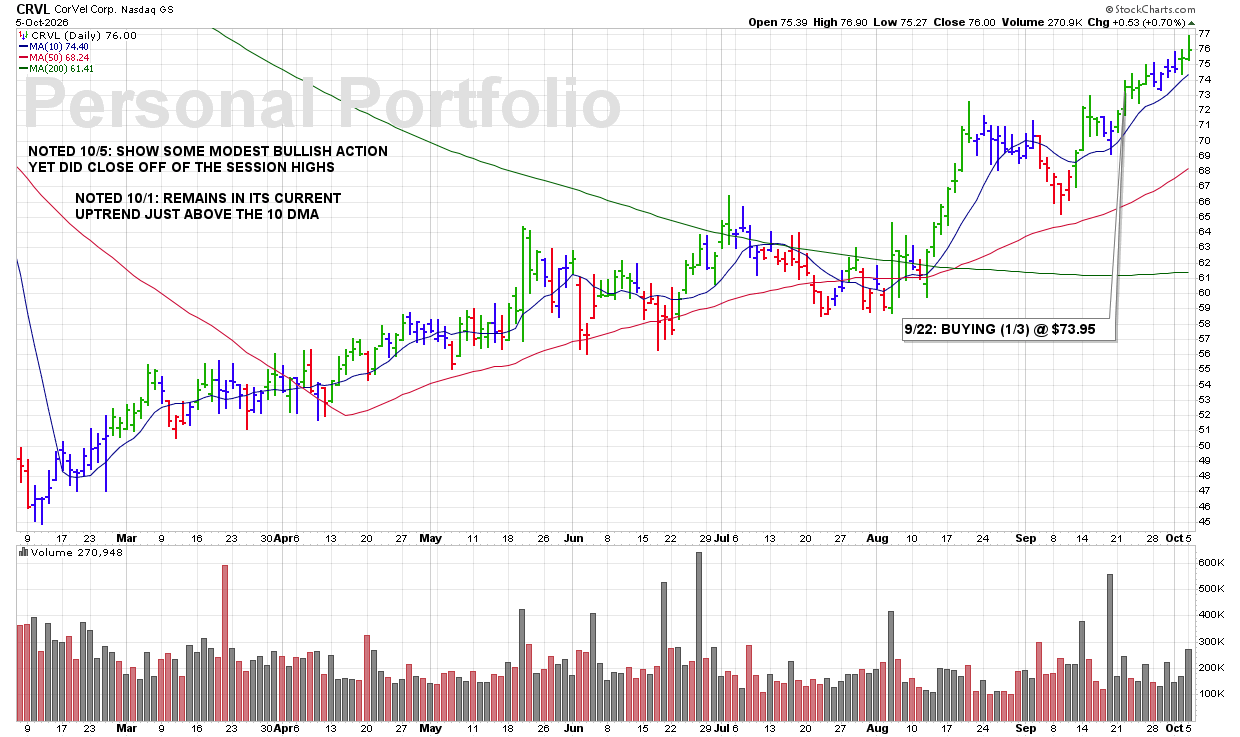
MON 10/5: CRVL – Show Some Modest Bullish Action Yet Did Close Off of the Session Highs

7:50 PM – We are currently reporting on this stock as an active holding and continue to monitor the stock closely for any technical SELL SIGNALS.

The focus always remains on price/volume action around key support levels, including the 10 DMA, 50 DMA, and any nearby trendline or ROUND-$ support.

CLICK/TAP CHART TO ZOOM
Chart services courtesy of stockcharts.com. Annotations by James Taulman.

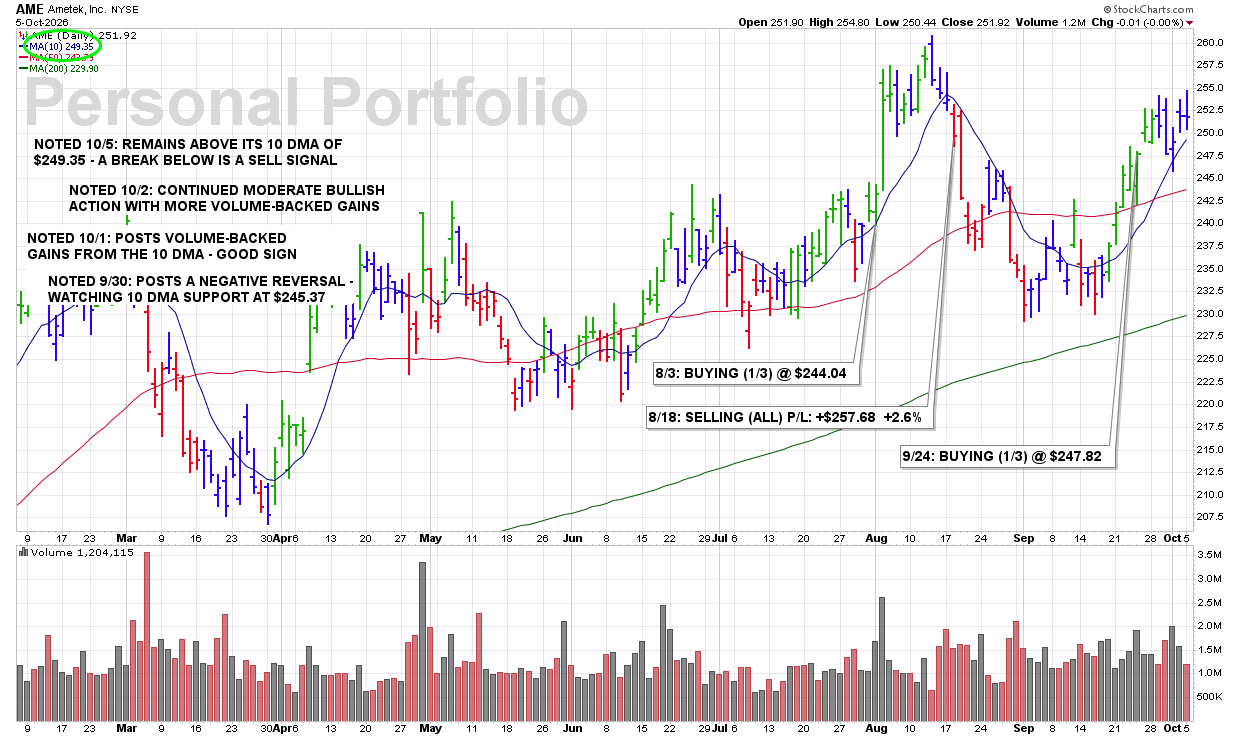
MON 10/5: AME – Remains Above Its 10 DMA of $249.35 – a Break Below Is a Sell Signal

7:45 PM – We are currently reporting on this stock as an active holding and continue to monitor the stock closely for any technical SELL SIGNALS.

The focus always remains on price/volume action around key support levels, including the 10 DMA, 50 DMA, and any nearby trendline or ROUND-$ support.

CLICK/TAP CHART TO ZOOM
Chart services courtesy of stockcharts.com. Annotations by James Taulman.

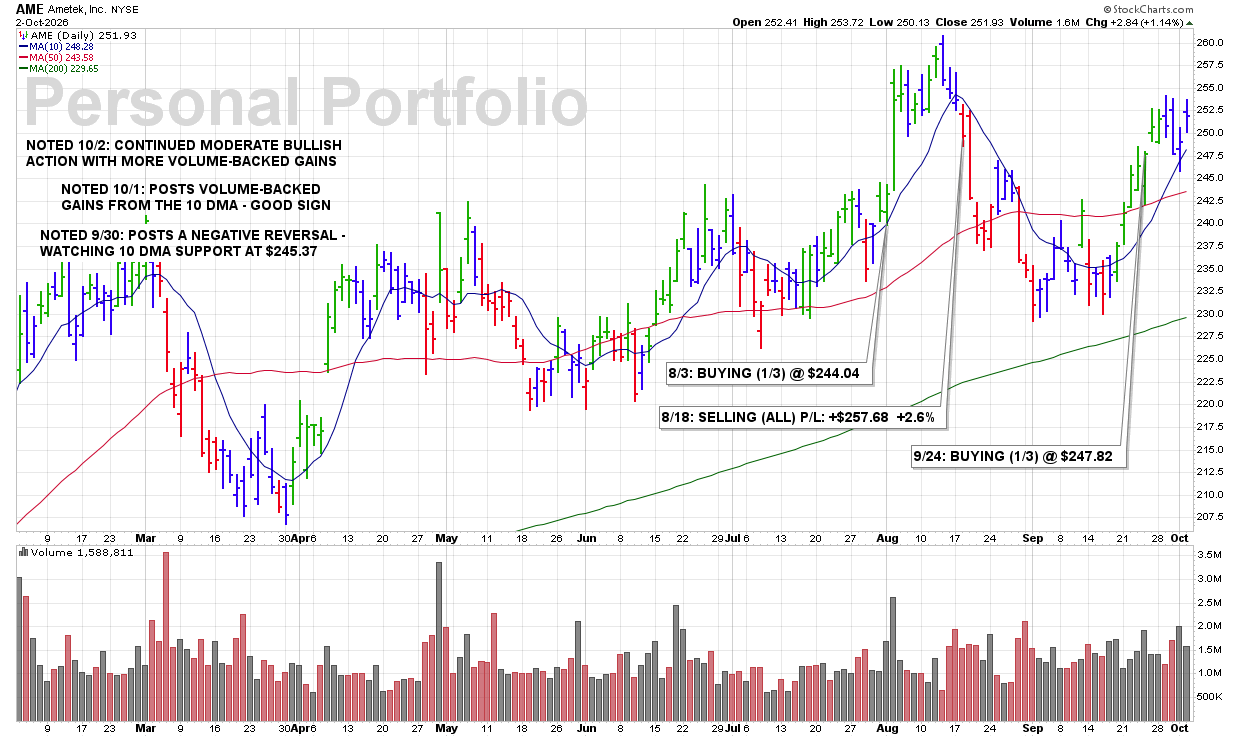
10/2 FRI: AME – Continued Moderate Bullish Action With More Volume-Backed Gains

7:25 PM – We are currently reporting on this stock as an active holding and continue to monitor the stock closely for any technical SELL SIGNALS.

The focus always remains on price/volume action around key support levels, including the 10 DMA, 50 DMA, and any nearby trendline or ROUND-$ support.

CLICK/TAP CHART TO ZOOM
Chart services courtesy of stockcharts.com. Annotations by James Taulman.

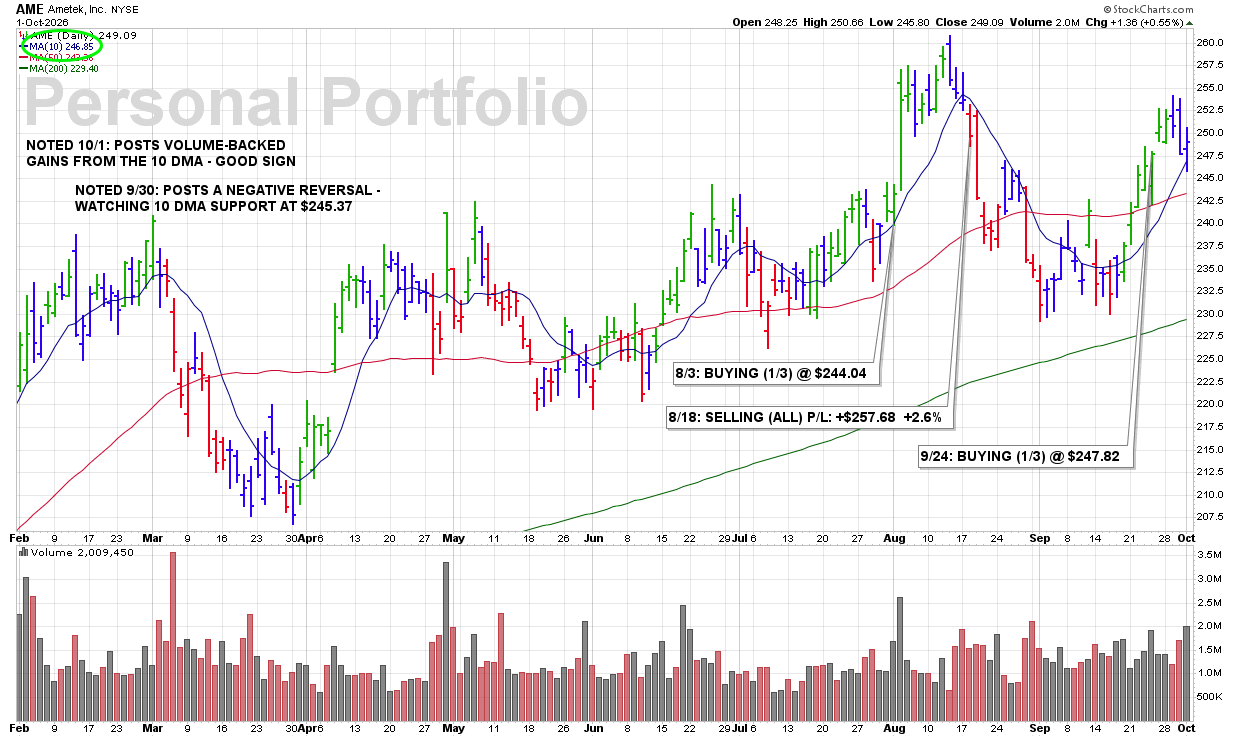
THU 10/1: AME – Posts Volume-Backed Gains From the 10 DMA – Good Sign

8:50 PM – We are currently reporting on this stock as an active holding and continue to monitor the stock closely for any technical SELL SIGNALS.

The focus always remains on price/volume action around key support levels, including the 10 DMA, 50 DMA, and any nearby trendline or ROUND-$ support.

CLICK/TAP CHART TO ZOOM
Chart services courtesy of stockcharts.com. Annotations by James Taulman.

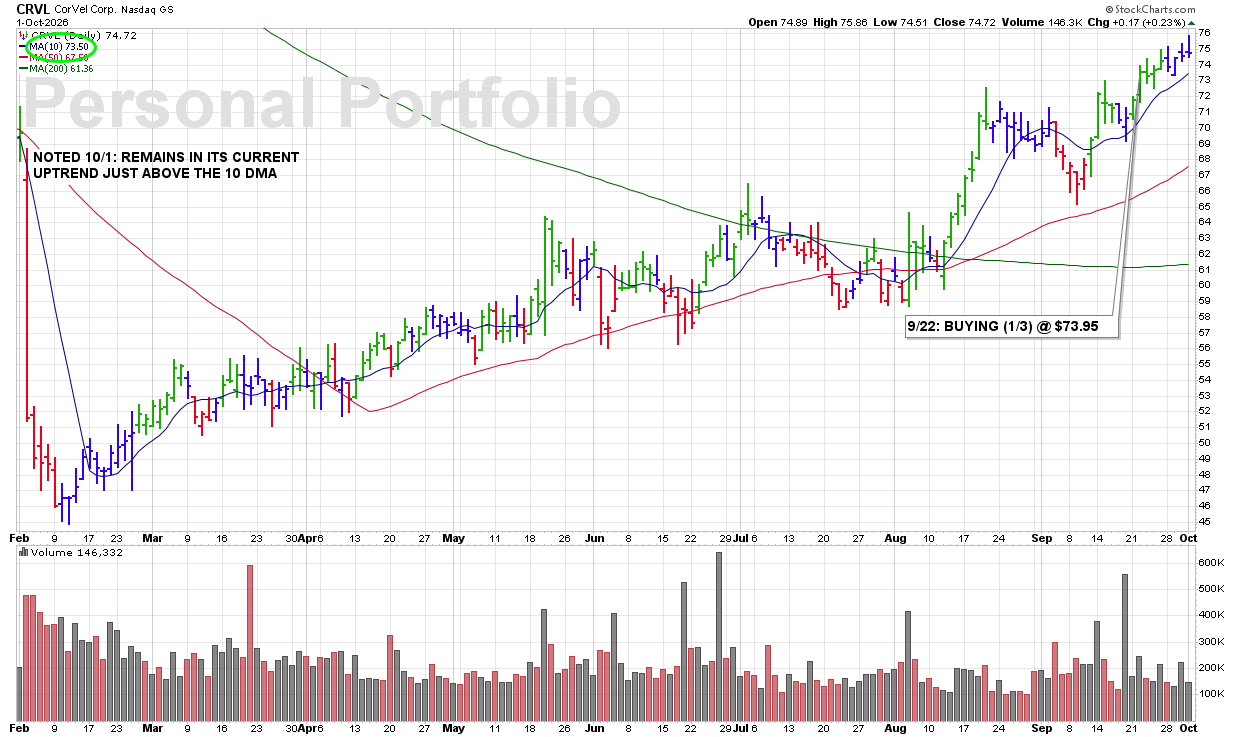
THU 10/1: CRVL – Remains in Its Current Uptrend Just Above the 10 DMA

9:45 PM – We are currently reporting on this stock as an active holding and continue to monitor the stock closely for any technical SELL SIGNALS.

The focus always remains on price/volume action around key support levels, including the 10 DMA, 50 DMA, and any nearby trendline or ROUND-$ support.

CLICK/TAP CHART TO ZOOM
Chart services courtesy of stockcharts.com. Annotations by James Taulman.

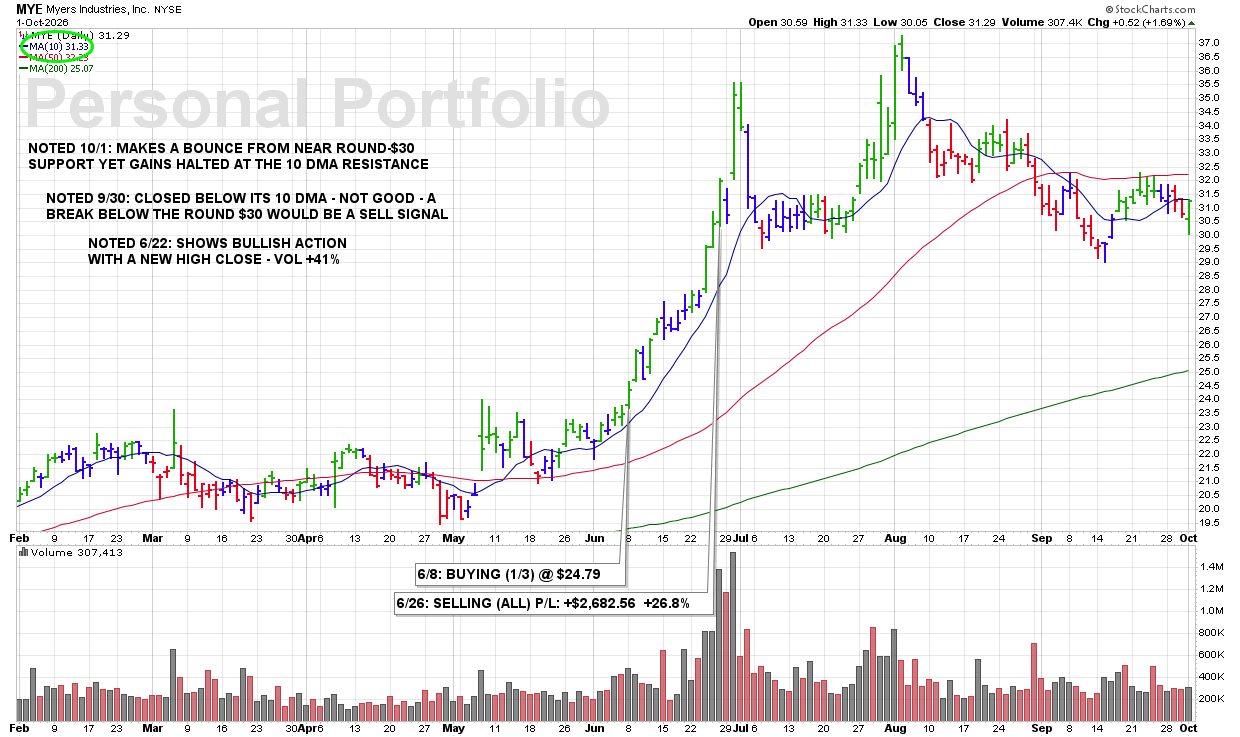
THU 10/1: MYE – Makes a Bounce From Near Round-$30 Support Yet Gains Halted at the 10 DMA Resistance

8:40 PM – We are currently reporting on this stock as an active holding and continue to monitor the stock closely for any technical SELL SIGNALS.

The focus always remains on price/volume action around key support levels, including the 10 DMA, 50 DMA, and any nearby trendline or ROUND-$ support.

CLICK/TAP CHART TO ZOOM
Chart services courtesy of stockcharts.com. Annotations by James Taulman.

WED 9/30: AME – Posts a Negative Reversal – Watching 10 DMA Support at $245.37

9:53 PM – We are currently reporting on this stock as an active holding and continue to monitor the stock closely for any technical SELL SIGNALS.

The focus always remains on price/volume action around key support levels, including the 10 DMA, 50 DMA, and any nearby trendline or ROUND-$ support.

CLICK/TAP CHART TO ZOOM
Chart services courtesy of stockcharts.com. Annotations by James Taulman.

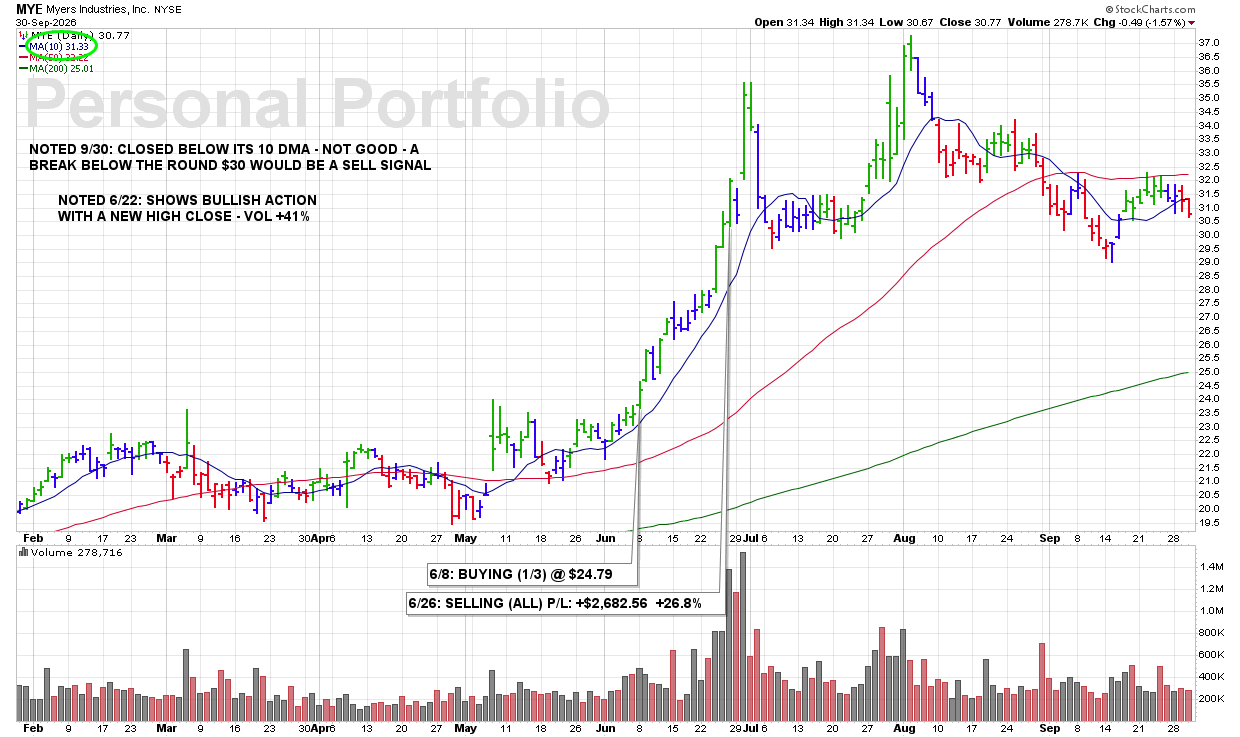
WED 9/30: MYE – Closed Below Its 10 DMA – Not Good – a Break Below the Round $30 Would Be a Sell Signal

9:41 PM – We are currently reporting on this stock as an active holding and continue to monitor the stock closely for any technical SELL SIGNALS.

The focus always remains on price/volume action around key support levels, including the 10 DMA, 50 DMA, and any nearby trendline or ROUND-$ support.

CLICK/TAP CHART TO ZOOM
Chart services courtesy of stockcharts.com. Annotations by James Taulman.

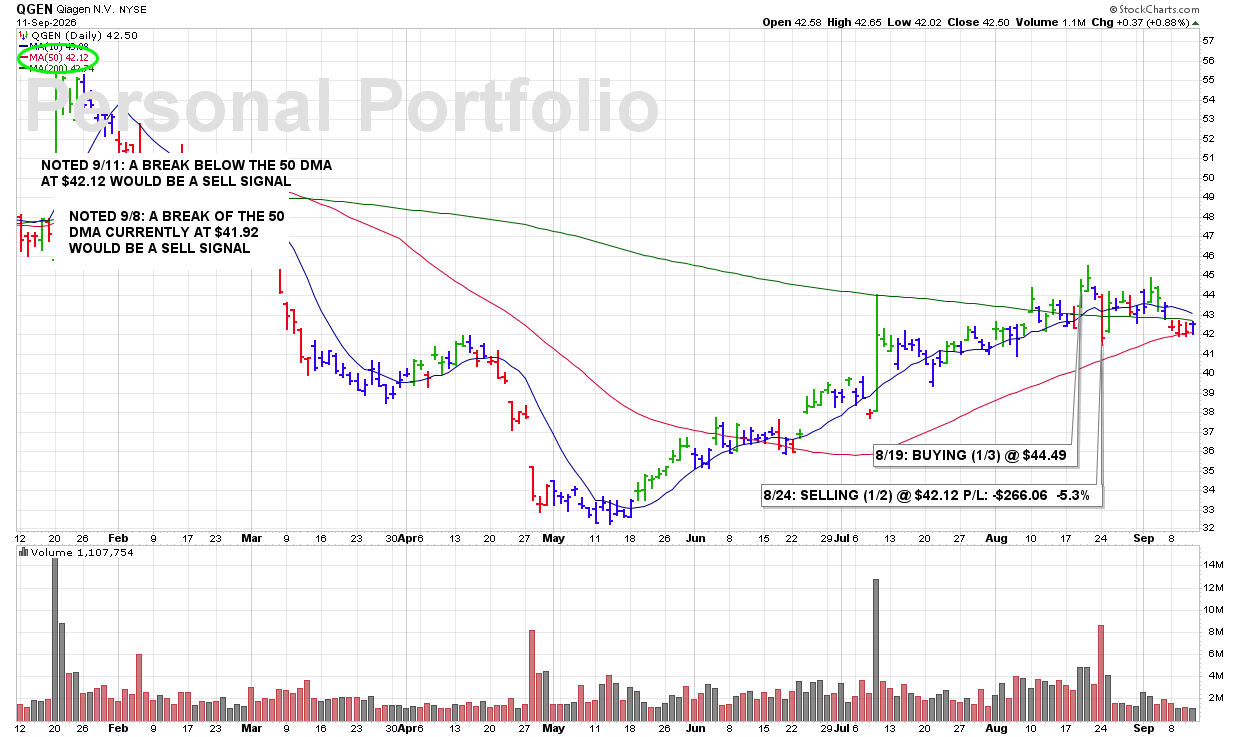
FRI 9/11: QGEN – A Break Below the 50 DMA at $42.12 Would Be a Sell Signal

9:20 PM – We are currently reporting on this stock as an active holding and continue to monitor the stock closely for any technical SELL SIGNALS.

The focus always remains on price/volume action around key support levels, including the 10 DMA, 50 DMA, and any nearby trendline or ROUND-$ support.

CLICK/TAP CHART TO ZOOM
Chart services courtesy of stockcharts.com. Annotations by James Taulman.

FRI 9/11: HTGC – Starting to Make Lower Highs – Not Good

9:15 PM – We are currently reporting on this stock as an active holding and continue to monitor the stock closely for any technical SELL SIGNALS.

The focus always remains on price/volume action around key support levels, including the 10 DMA, 50 DMA, and any nearby trendline or ROUND-$ support.

CLICK/TAP CHART TO ZOOM
Chart services courtesy of stockcharts.com. Annotations by James Taulman.

FRI 9/11: HIPO – Got Turned Back From Its 10 DMA Today – Not Good

9:10 PM – We are currently reporting on this stock as an active holding and continue to monitor the stock closely for any technical SELL SIGNALS.

The focus always remains on price/volume action around key support levels, including the 10 DMA, 50 DMA, and any nearby trendline or ROUND-$ support.

CLICK/TAP CHART TO ZOOM
Chart services courtesy of stockcharts.com. Annotations by James Taulman.

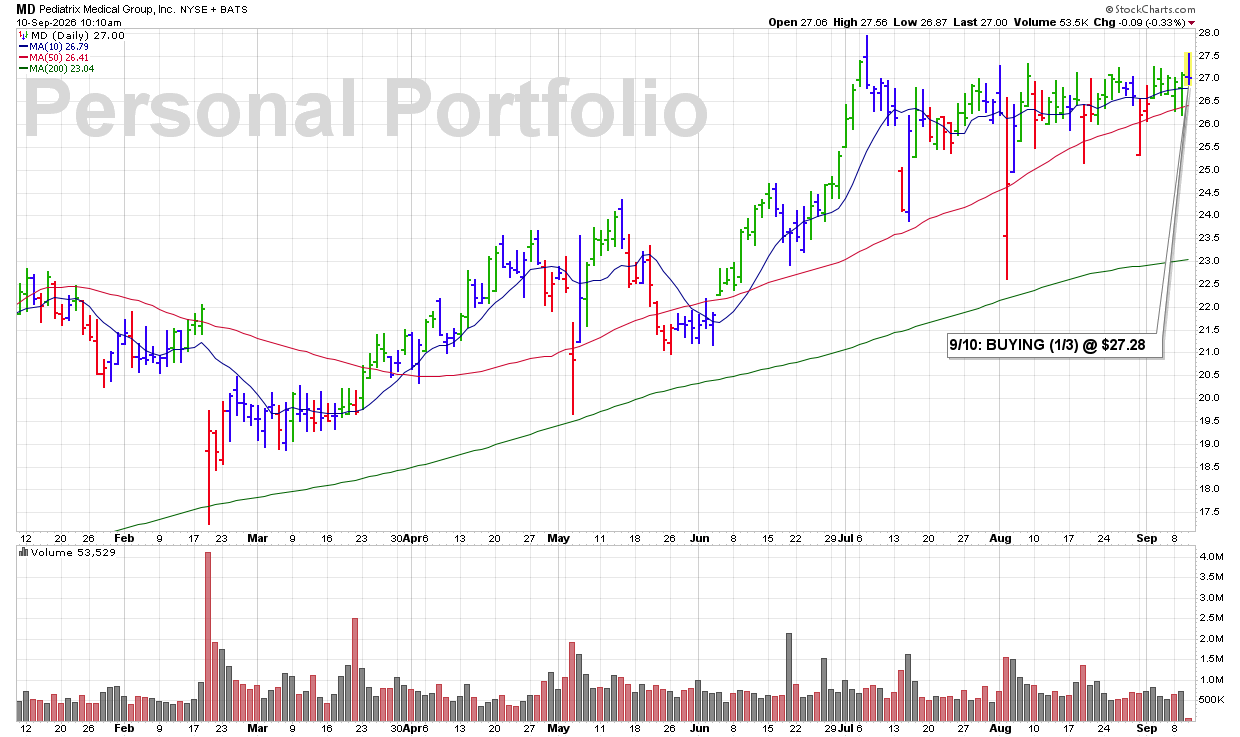
THU 9/10: MD — High-Ranked Medical Services Stock Breaking Out to New All-Time Highs

10:20 AM – Picked up a 1/3 position in this Medical Services stock as it sports very high overall rankings, is part of a leading industry group ranked 5th, and is clearly breaking above its previous highs with an increase in volume. The combination of strong rankings, industry group leadership, a breakout to new all-time highs, and increased volume gives me enough bullish technical evidence to initiate a position.

James’ Trader’s Tip: Look for Leadership Confirmed by Price and Volume

  • Stocks breaking into new all-time highs are demonstrating clear price strength.

  • Strength within a leading industry group adds another positive characteristic.

  • Increased volume helps confirm that there is meaningful demand behind the breakout.

CLICK/TAP CHART TO ZOOM
Chart services courtesy of stockcharts.com. Annotations by James Taulman.

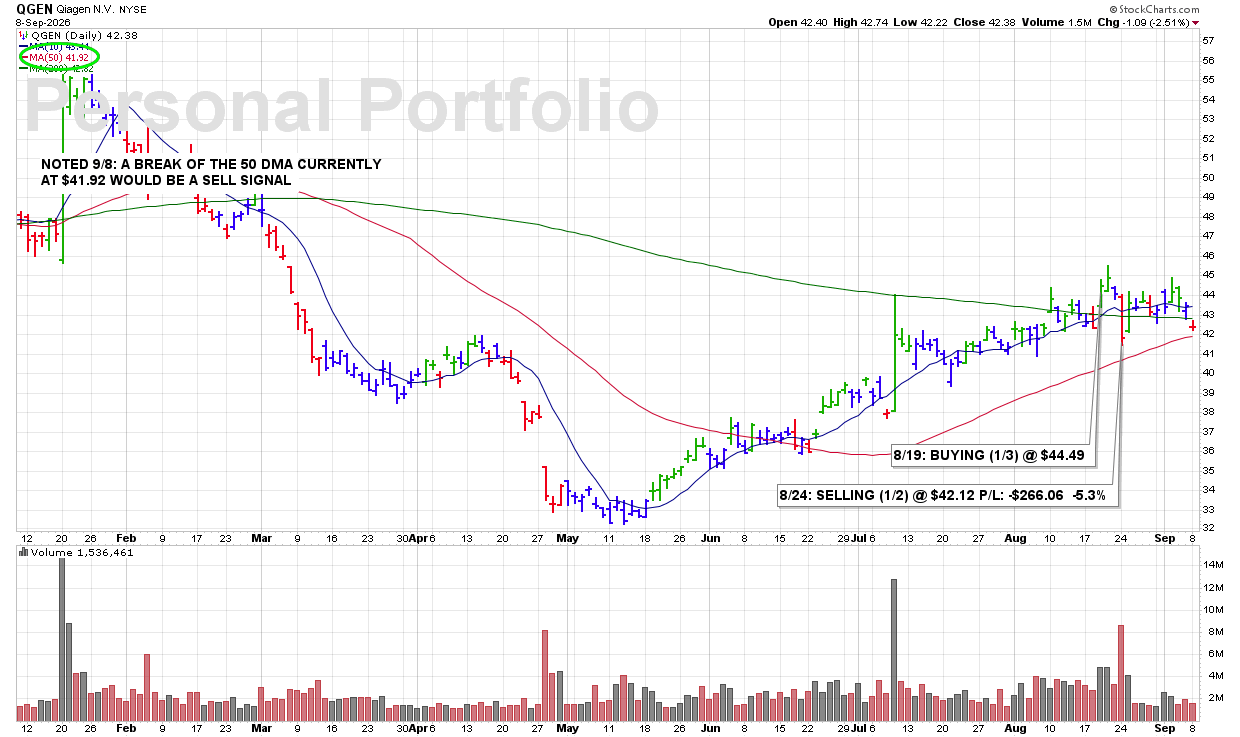
TUE 9/8: QGEN – A Break of the 50 DMA Currently at $41.92 Would Be a Sell Signal

Latest Chart Update: QGEN

9:50 PM – We are currently reporting on this stock as an active holding and continue to monitor the stock closely for any technical SELL SIGNALS.

The focus always remains on price/volume action around key support levels, including the 10 DMA, 50 DMA, and any nearby trendline or ROUND-$ support.

CLICK/TAP CHART TO ZOOM
Chart services courtesy of stockcharts.com. Annotations by James Taulman.

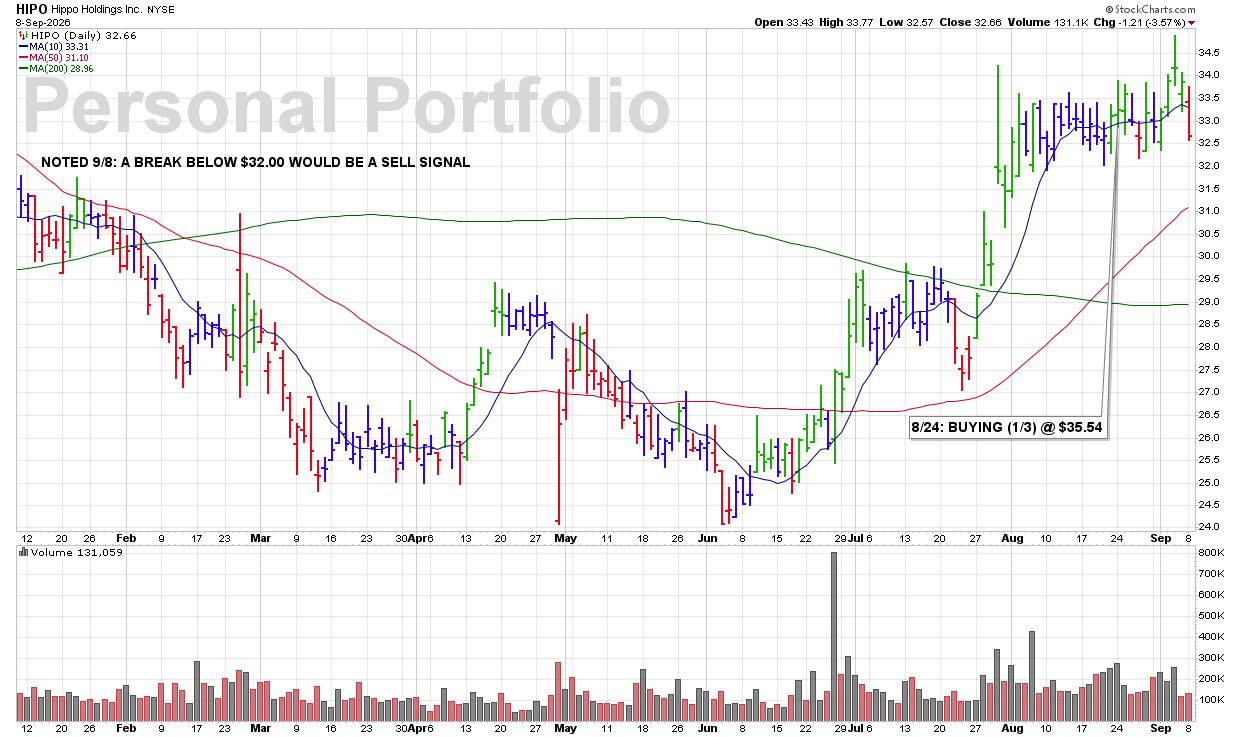
TUE 9/8: HIPO – A Break Below $32.00 Would Be a Sell Signal

Latest Chart Update: HIPO

9:45 PM – We are currently reporting on this stock as an active holding and continue to monitor the stock closely for any technical SELL SIGNALS.

The focus always remains on price/volume action around key support levels, including the 10 DMA, 50 DMA, and any nearby trendline or ROUND-$ support.

CLICK/TAP CHART TO ZOOM
Chart services courtesy of stockcharts.com. Annotations by James Taulman.

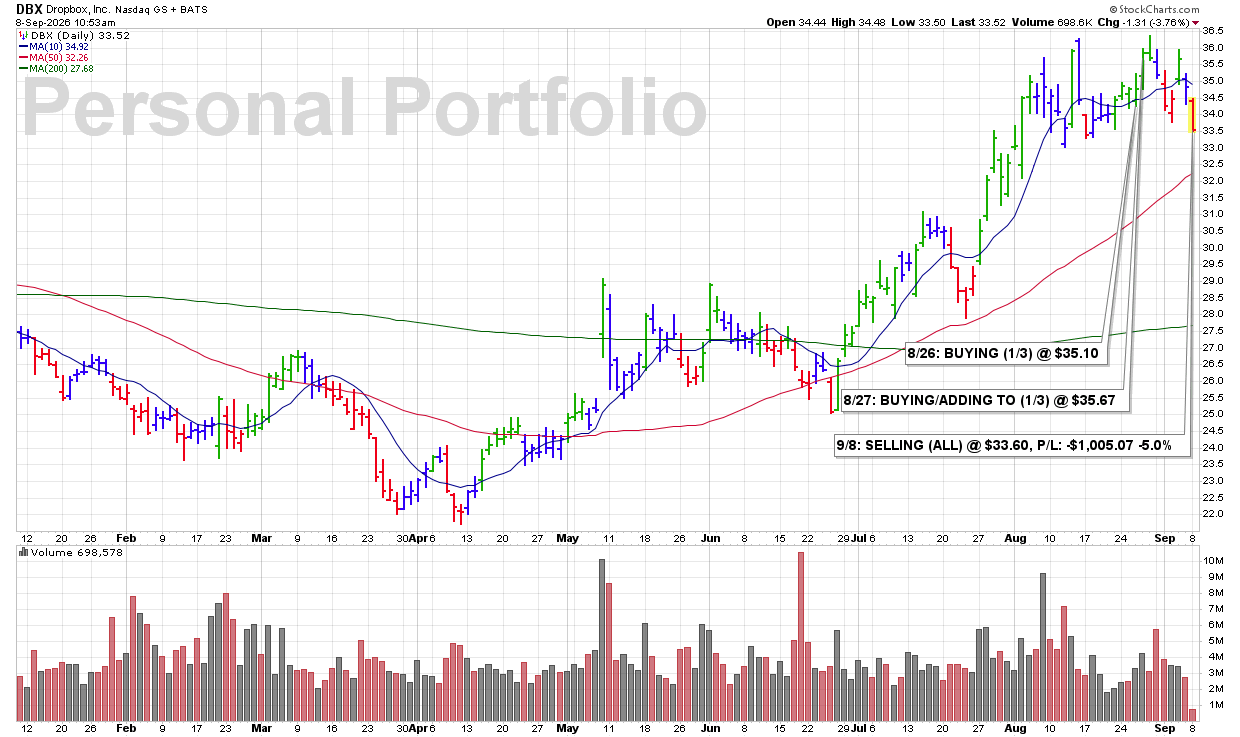
TUE 9/8: DBX – Makes a Sharp Sell-Off With Increased Volume — SELL SIGNAL

10:59 AM – Dumping all of my DBX position here this morning as shares sell off sharply and make new recent lows with an increase in volume. The combination of declining price, new lows, and increased selling volume is clear bearish technical action and enough for me to exit the position completely.

James’ Trader’s Tip: New Lows With Volume Demand Attention

  • New recent lows show that the stock’s technical condition continues to deteriorate.

  • Increased volume adds significance by showing stronger selling pressure behind the decline.

  • When price and volume turn decisively bearish together, follow the SELL rules and protect capital.

CLICK/TAP CHART TO ZOOM
Chart services courtesy of stockcharts.com. Annotations by James Taulman.

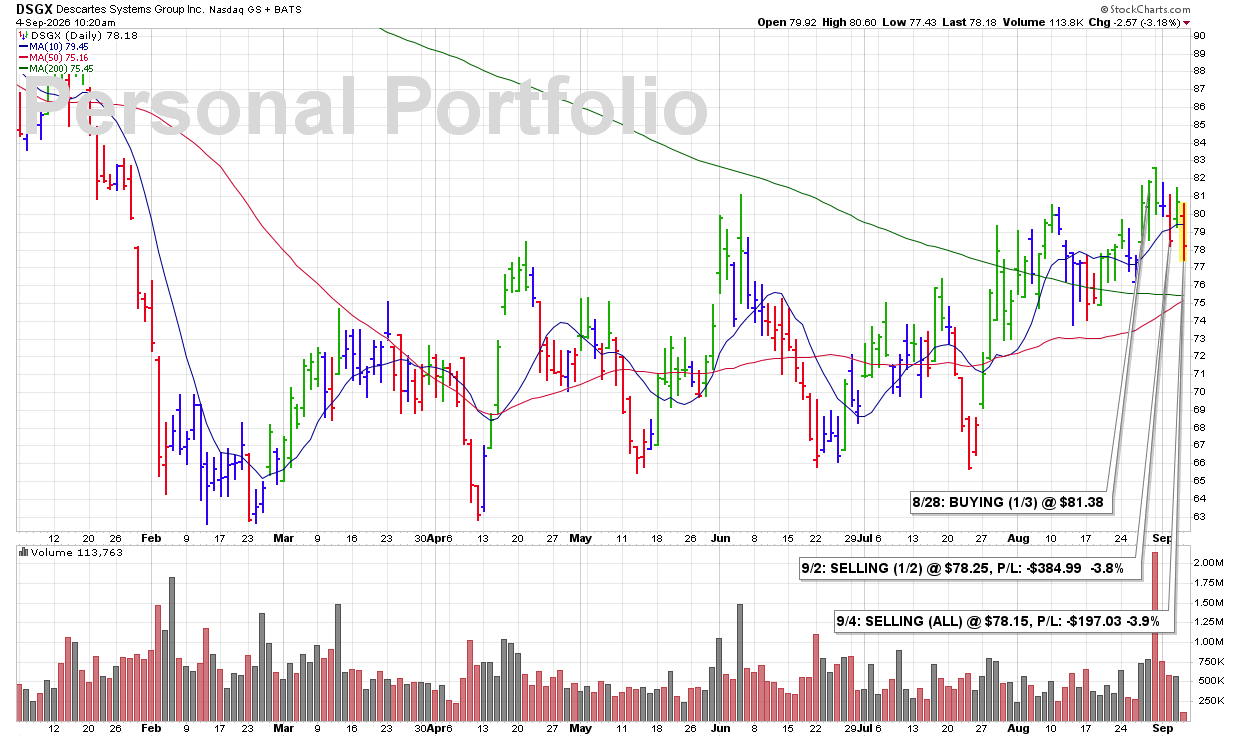
FRI 9/4: DSGX — Breaks Its 10 DMA With Volume — SELL SIGNAL

10:10 AM – Selling the last of my DSGX position here as shares break below the 10 DMA with a sharp increase in volume. The combination of a key support violation and heavy selling volume is a clear SELL SIGNAL under our rules, so I’m exiting the position completely.

James’ Trader’s Tip: Volume Confirms the Breakdown

  • A break below the 10 DMA is an important technical violation.

  • A sharp increase in volume makes the weakness more meaningful by confirming stronger selling pressure.

  • When price and volume turn bearish together, follow the rules and protect capital.

CLICK/TAP CHART TO ZOOM
Chart services courtesy of stockcharts.com. Annotations by James Taulman.

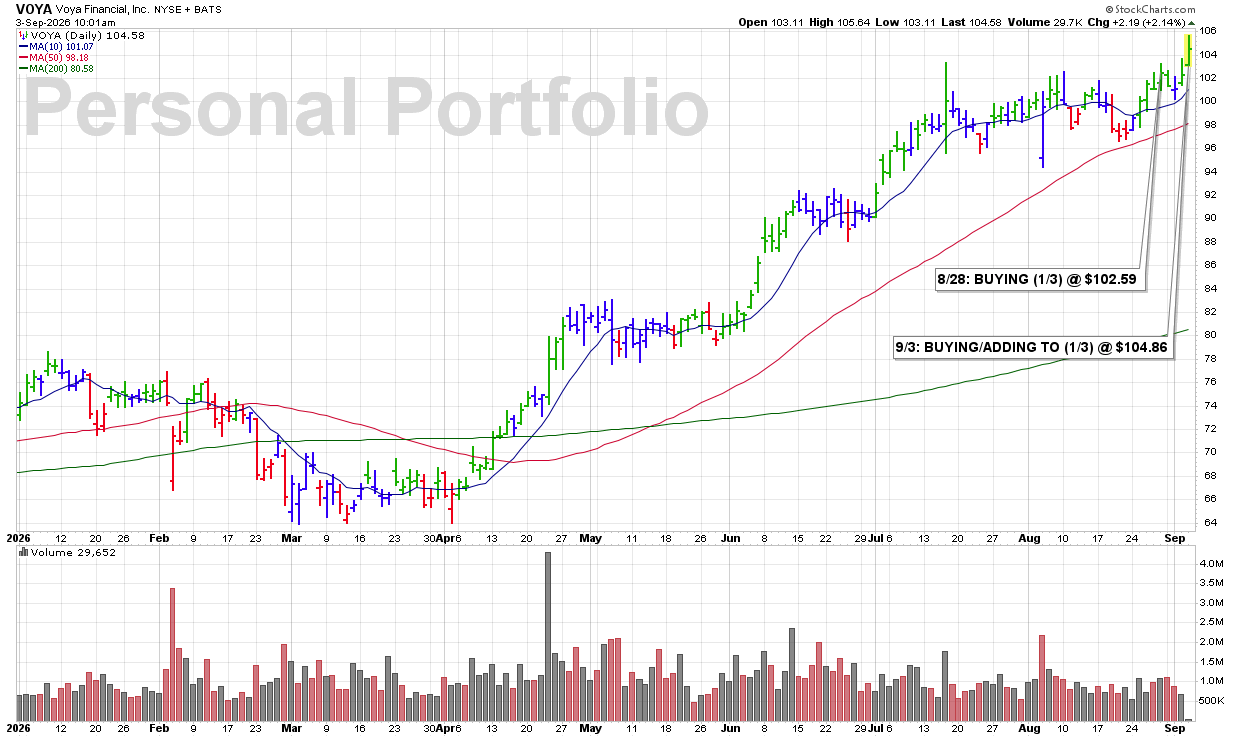
THU 9/3: VOYA – Adding to My Position as the Stock is Breaking Out to New Highs

9:53 AM – Adding another 1/3 to my VOYA position here as shares break out to new highs with what is, at this time, an increase in volume. The combination of new-high price strength and increased volume is bullish technical action and gives me enough confirmation to add to the position.

I now have 2/3 of what I consider a full position in VOYA.

ULTRA Trader’s Tip: Add as Strength Is Confirmed

  • A breakout to new highs shows that buyers are successfully pushing through previous resistance.

  • Increased volume adds conviction and helps confirm the strength of the move.

  • Scaling in by thirds allows the stock to prove itself before committing a full position.

CLICK/TAP CHART TO ZOOM
Chart services courtesy of stockcharts.com. Annotations by James Taulman.

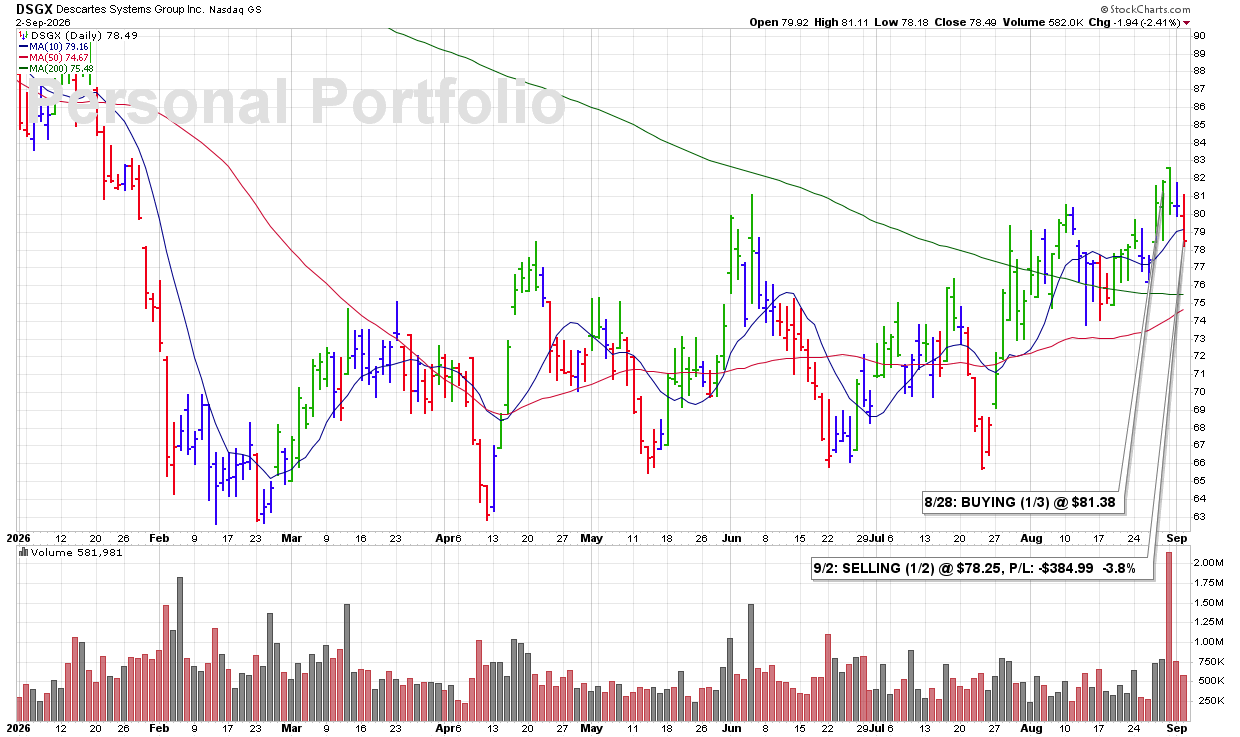
WED 9/2: DSGX — Following the Rules and Selling a Portion on Technical Weakness

10:56 PM – As much as I hate to sell this quickly, I couldn’t ignore today’s technical weakness in DSGX. Three bearish signs stood out: (1) shares were down about 2.4%, (2) price was dropping below the 10 DMA, and (3) volume was running above average.

That combination is enough technical weakness for me to follow the rules and reduce the position. I sold half at the close for a $192.45 loss, or -3.8%.

CORRECTION: The loss was incorrectly reported in the SMS as -$384.99. The correct realized loss on the half position sold was -$192.45.


James’ Trader’s Tip: Follow the Rules Even When You Don’t Want To

  • A break below the 10 DMA is an important technical violation under our rules.

  • Weak price action accompanied by above-average volume makes the deterioration more significant.

  • Selling a portion allows us to reduce risk while still giving the remaining position an opportunity to recover.


CLICK/TAP CHART TO ZOOM
Chart services courtesy of stockcharts.com. Annotations by James Taulman.

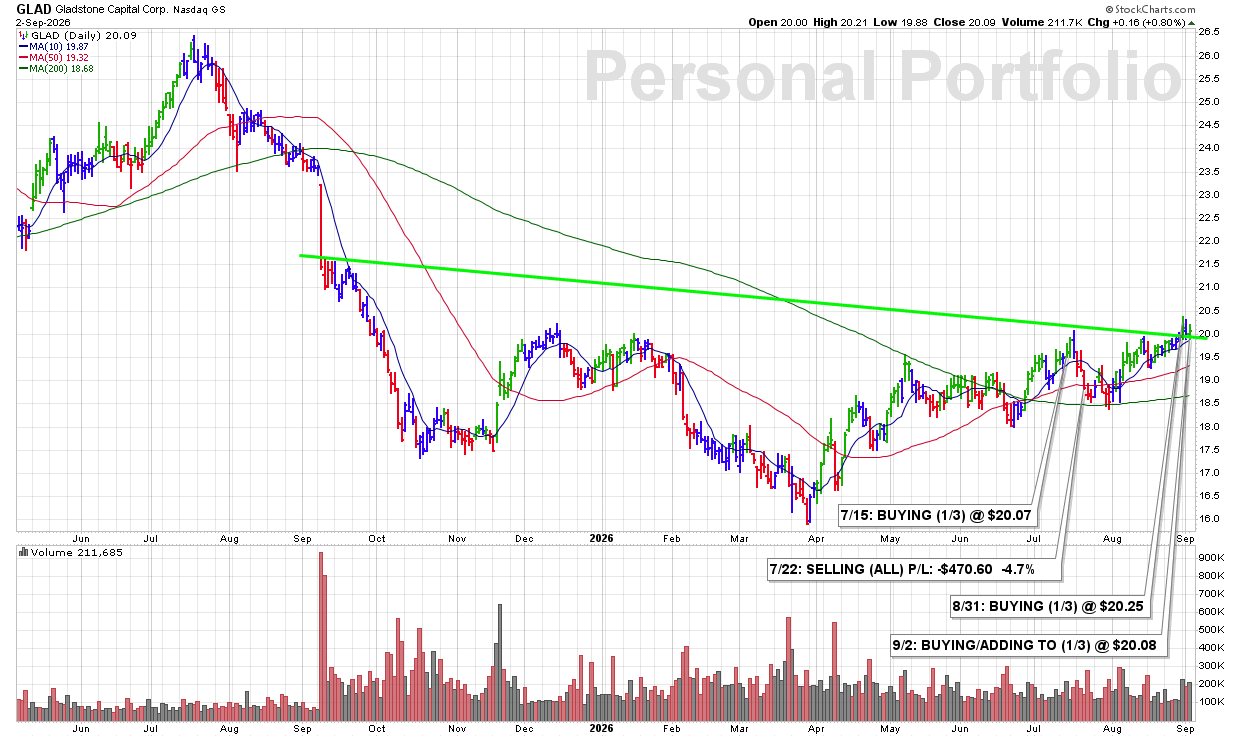
WED 9/2: GLAD — Gains From the 10 DMA With Volume — A BUY SIGNAL

9:58 PM – I added another 1/3 position to my GLAD holding today as shares traded higher from the 10 DMA with an increase in volume. This is a very typical technical scenario I look for when adding to an existing position: support at the 10 DMA followed by an advance on increased volume.

I now have 2/3 of what I consider a full position in GLAD, in a market where stocks have generally lacked much follow-through.

The cost basis will be adjusted inside ULTRA for tracking purposes.


James’ Trader’s Tip: Add From Proven Support

  • An advance from the 10 DMA with increased volume is one of the most common bullish technical signals I look for.

  • Scaling in allows the stock to prove itself before committing a full position.

  • When stocks are showing limited follow-through overall, maintaining some restraint with position size helps manage risk.


CLICK/TAP CHART TO ZOOM
Chart services courtesy of stockcharts.com. Annotations by James Taulman.

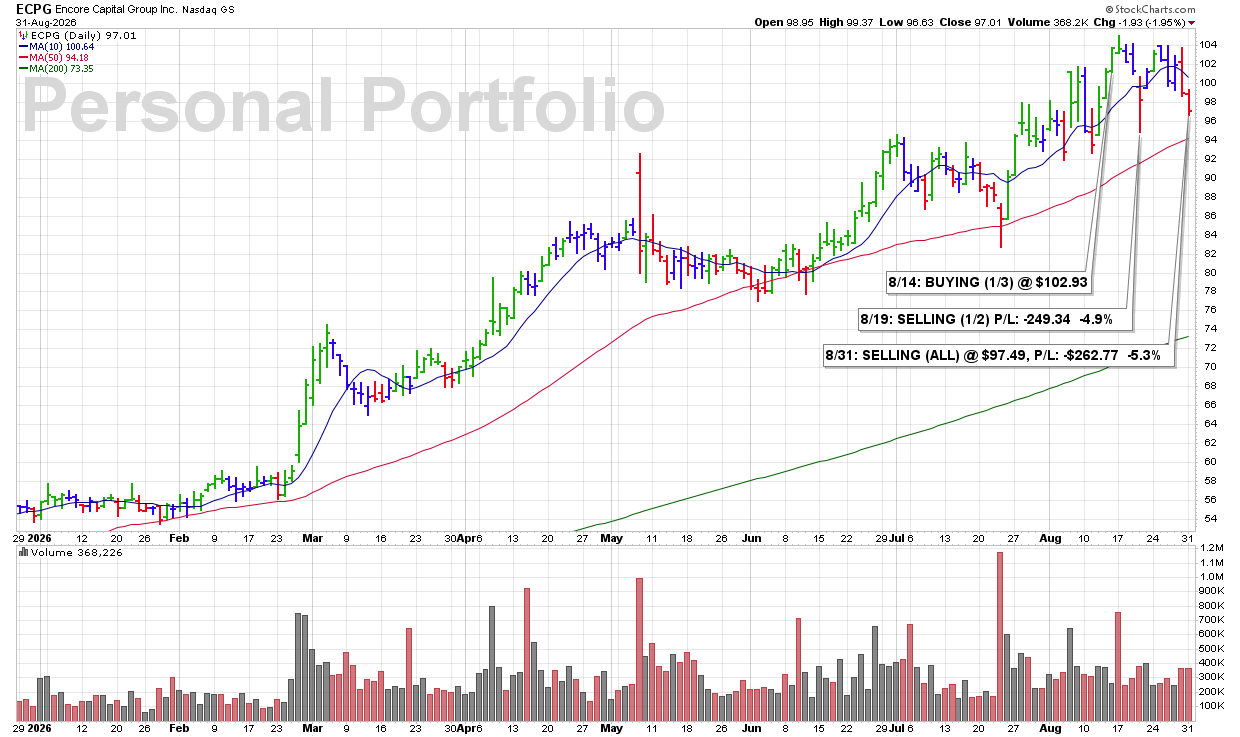
MON 8/31: ECPG – Persistent Bearish Action is a Reason to Reduce Exposure

3:58 PM – Selling the last half of my ECPG position here this afternoon as the stock continues to display bearish technical signs. With the weakness persisting and my overall posture becoming more defensive at this point, I see no reason to continue holding the remaining shares. I’m exiting the position completely and protecting capital.

James’ Trader’s Tip: Adjust Your Exposure as Conditions Change

  • Persistent bearish action is a reason to reduce exposure rather than wait for conditions to worsen.

  • Individual stock weakness becomes even more important when your overall posture is turning defensive.

  • Capital preserved today is capital available for the next strong BUY SIGNAL.

CLICK/TAP CHART TO ZOOM
Chart services courtesy of stockcharts.com. Annotations by James Taulman.

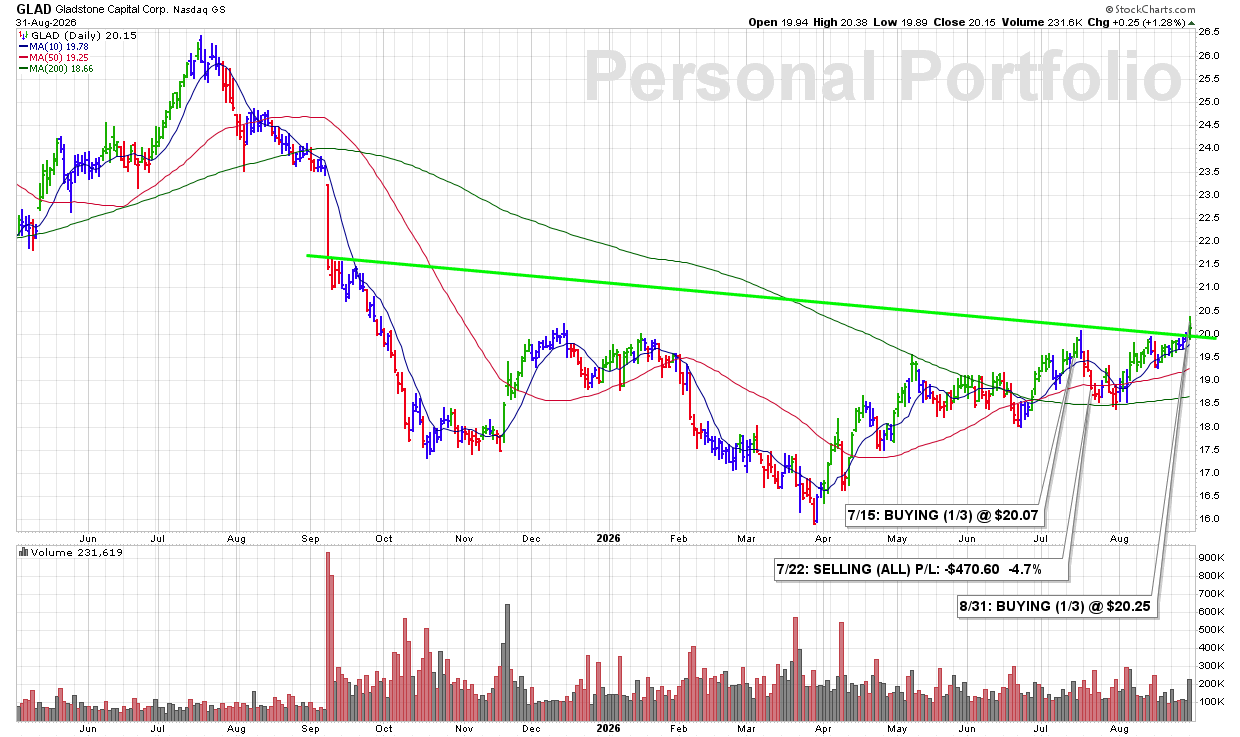
MON 8/31: GLAD – Just Starting to Break Out of a Downtrend as Volume Shows Some Conviction

3:38 PM – Starting a 1/3 position in this Finance-Investment Management company as shares begin to break out of their recent downtrend while volume runs 39% above average. The improving price action combined with increased volume gives me enough bullish technical evidence to initiate a starter position.

James’ Trader’s Tip: A Trend Change Needs Confirmation

  • Breaking out of a downtrend can signal an important change in the stock’s technical character.

  • Above-average volume strengthens the move by showing increased demand behind the breakout.

  • Starting with a 1/3 position lets us participate while requiring the stock to prove itself before committing additional capital.

CLICK/TAP CHART TO ZOOM
Chart services courtesy of stockcharts.com. Annotations by James Taulman.