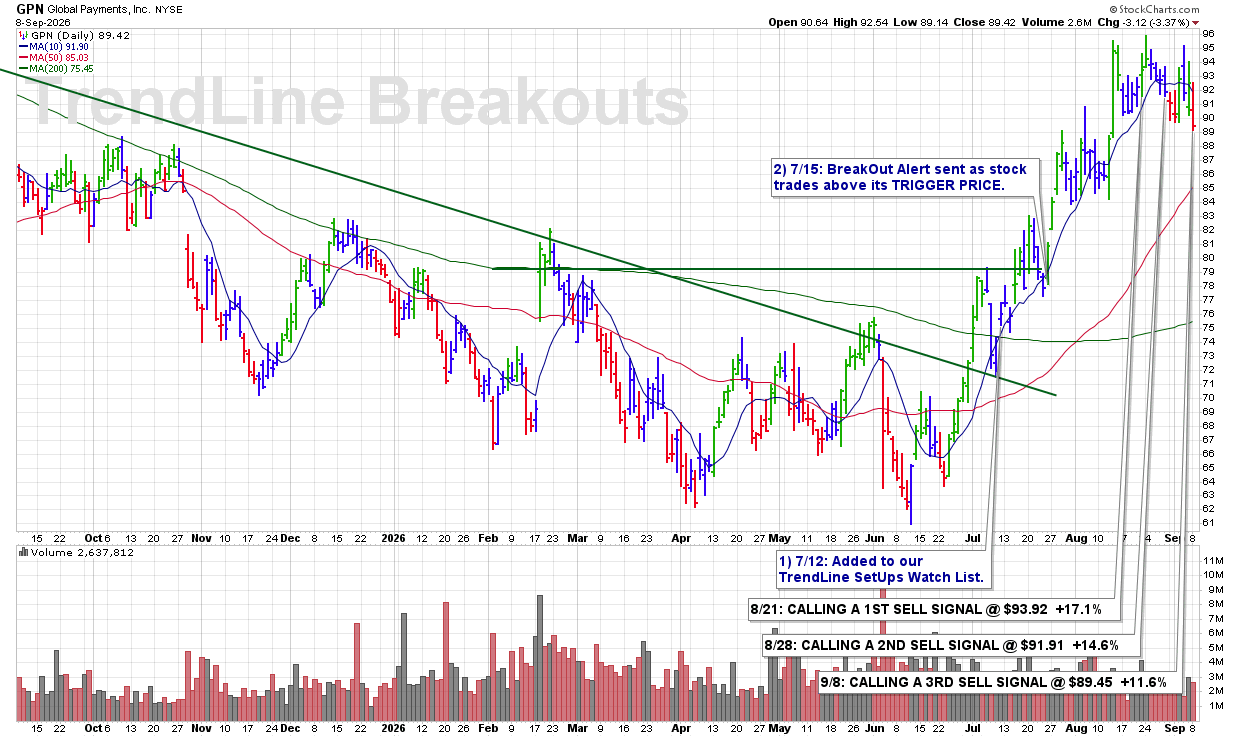
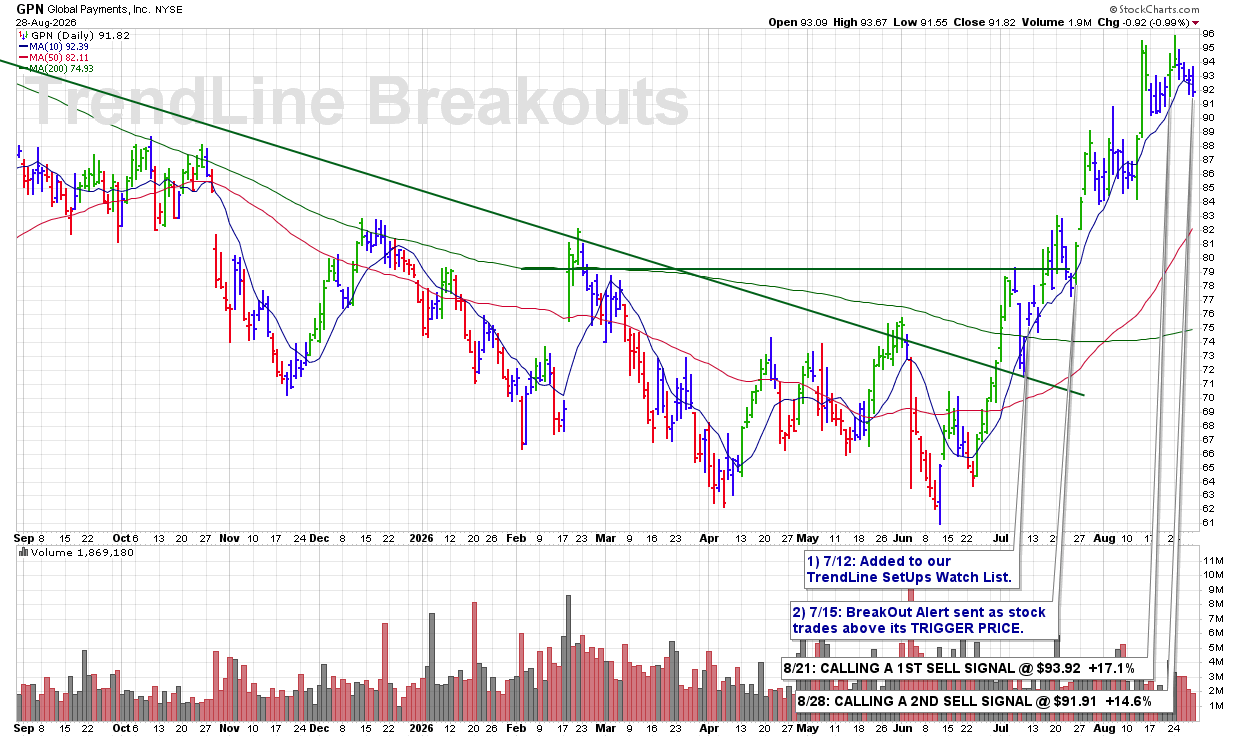
FRI 8/28: GPN – CALLING A 2ND SELL SIGNAL @ $91.91 +14.6%

3:26 PM – Calling a 2ND SELL SIGNAL as shares are now clearly breaking below the 10 DMA while also forming a series of lower highs. That combination is a bearish technical development and can mark the beginning of a developing downtrend. With the position still showing a +14.6% gain, this is the type of weakness we want to respect rather than ignore.

ULTRA Trader’s Tip: Lower Highs Can Signal a Trend Change

  • A series of lower highs shows that buyers are becoming less willing to push the stock back to previous levels.

  • A break below the 10 DMA adds another important technical violation.

  • When weakening price structure and a support break occur together, protect profits and follow the SELL rules.

CLICK/TAP CHART TO ZOOM
Chart services courtesy of stockcharts.com. Annotations by James Taulman.

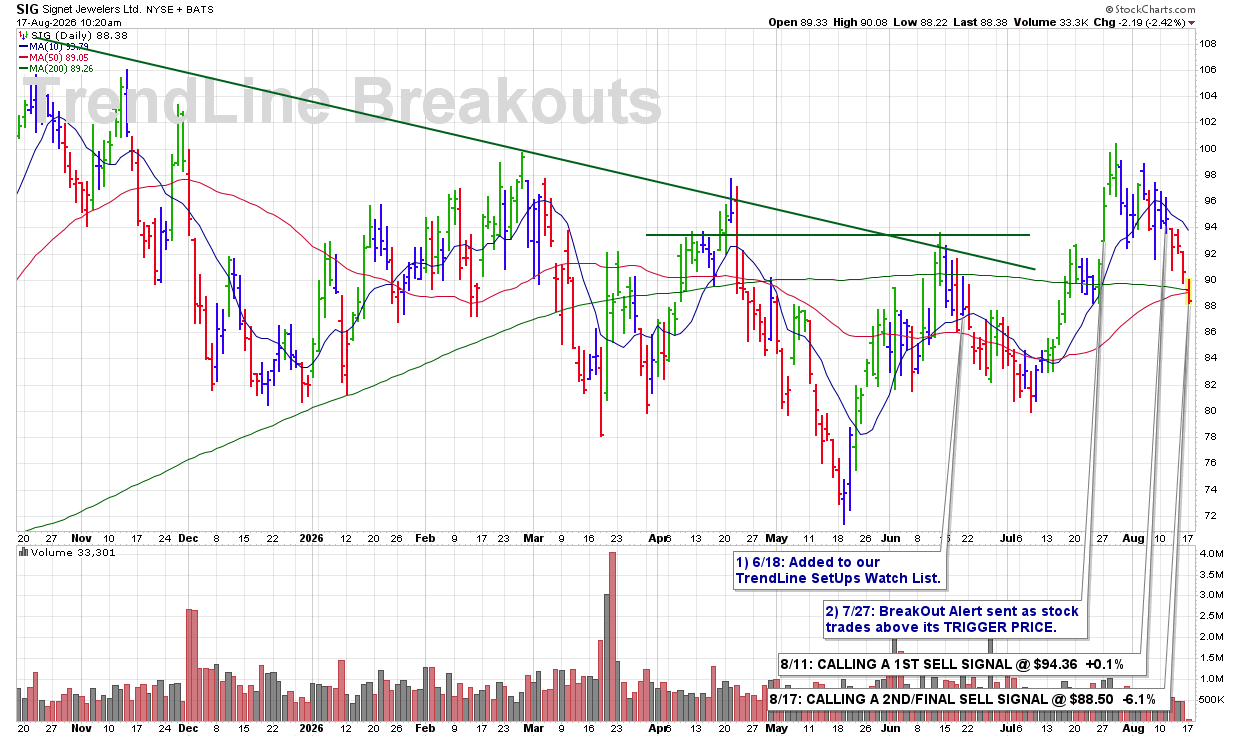
MON 8/17: SIG – CALLING A 2ND/FINAL SELL SIGNAL @ $88.50 -6.1%

10:04 AM – Calling a 2ND and FINAL SELL SIGNAL this morning as shares break below the 50 DMA. That loss of a major technical support level is a standard SELL SIGNAL under our rules and warrants fully closing out this selection.

ULTRA Trader’s Tip: Major Support Breaks End the Debate

  • The 50 DMA is one of the most important intermediate-term support levels we track.

  • A clear break below that line confirms that technical weakness has progressed beyond a short-term pullback.

  • When a major support level fails, follow the rule and move on.

CLICK/TAP CHART TO ZOOM
Chart services courtesy of stockcharts.com. Annotations by James Taulman.

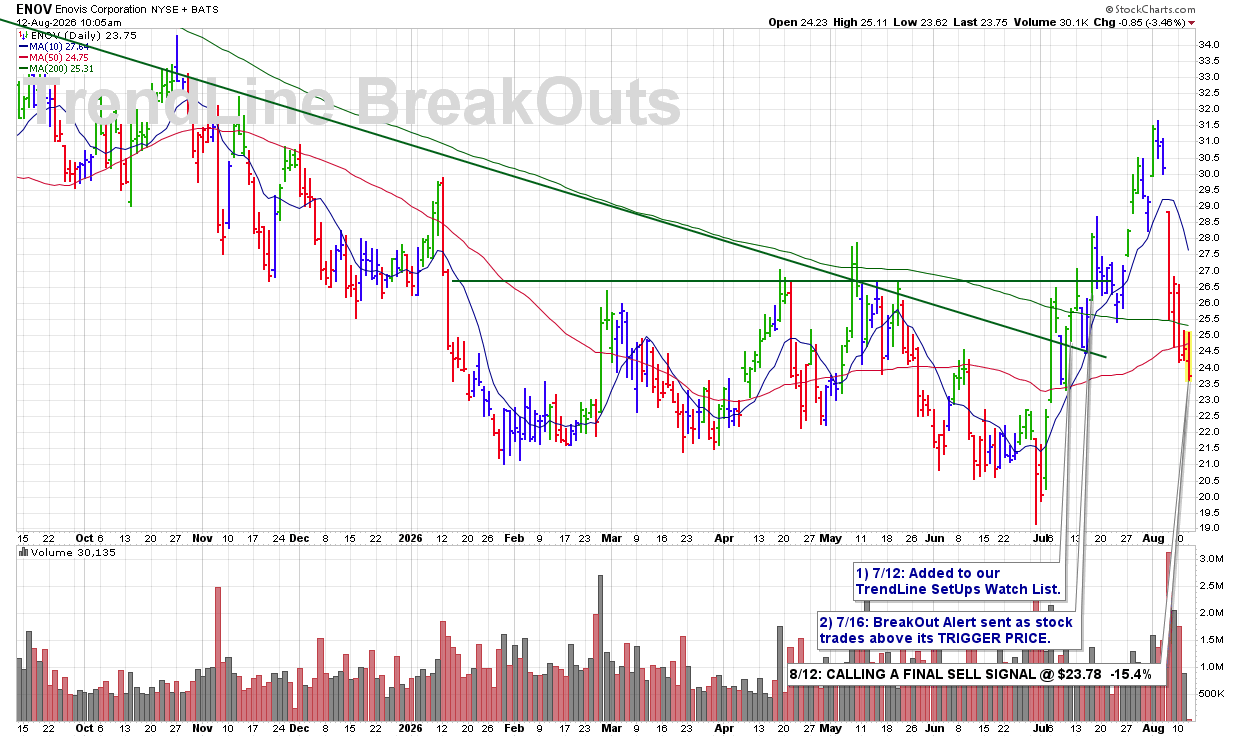
WED 8/12: ENOV – CALLING A FINAL SELL SIGNAL @ $23.78 -15.4%

9:47 AM – Calling a FINAL SELL SIGNAL this morning as the stock has failed to recover from its earnings sell-off and is making new lows today. The continued inability to rebound following the sharp decline confirms the ongoing technical weakness and warrants fully closing out this selection.

ULTRA Trader’s Tip: Failure to Recover Is Technical Weakness

  • After a sharp sell-off, a healthy stock should begin showing signs of stabilization or recovery.

  • Continued weakness and new lows indicate that sellers remain in control.

  • When a stock repeatedly fails to recover after a major technical breakdown, respect the weakness and move on.

CLICK/TAP CHART TO ZOOM
Chart services courtesy of stockcharts.com. Annotations by James Taulman.

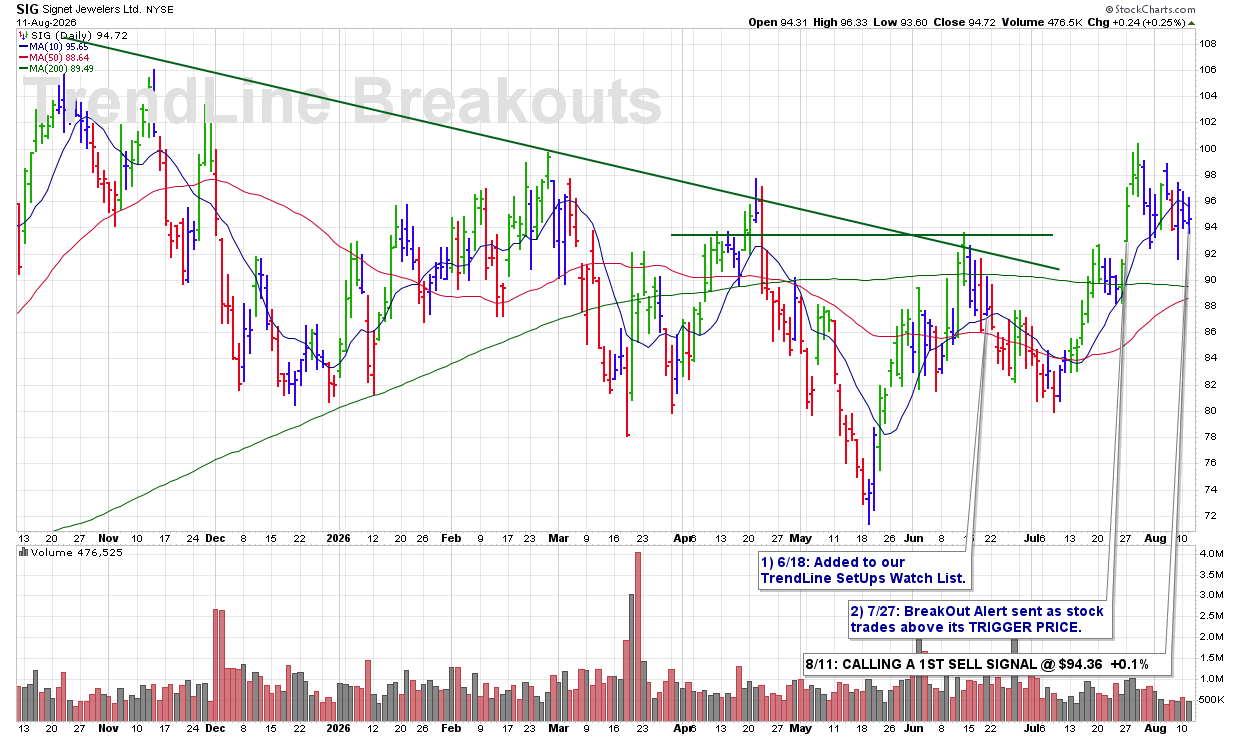
TUE 8/11: SIG – CALLING A 1ST SELL SIGNAL @ $94.36 +0.1%

3:38 PM – Calling a 1ST SELL SIGNAL as shares continue to exhibit bearish technical action after running into resistance near the previous high at the ROUND-$100 level. The stock has now developed a series of lower highs, fallen back below its 10 DMA, and appears to be developing a short-term downtrend. With multiple signs of technical weakness beginning to stack up, I’m calling the first SELL SIGNAL here.

ULTRA Trader’s Tip: Watch for a Pattern of Lower Highs

  • A series of lower highs shows that buyers are becoming less aggressive with each rally attempt.

  • When that pattern is accompanied by a break below the 10 DMA, the technical picture becomes increasingly bearish.

  • Recognizing a developing downtrend early allows you to reduce exposure before additional technical damage occurs.

CLICK/TAP CHART TO ZOOM
Chart services courtesy of stockcharts.com. Annotations by James Taulman.

FRI 7/31: BBSI – SELLING (1/2) P/L: -$637.20 -6.4%

3:43 PM – Selling half of my BBSI position this afternoon. After yesterday’s close just below the 10 DMA, shares are continuing to exhibit bearish technical action today, breaking below the recent lows near $39.00 on well above-average volume. Although I previously sold this stock for a solid profit and then bought it back on July 29th after a fresh BUY SIGNAL, I can no longer ignore the current technical deterioration. Stocks will tell you what to do—you simply have to listen.

James’ Trader’s Tip: Listen to What the Stock Is Saying

  • Every trade is based on the stock’s current technical behavior—not your previous opinion of it.

  • A stock can issue a valid BUY SIGNAL one day and a valid SELL SIGNAL soon after.

  • Successful traders stay flexible and respond to the evidence, allowing the stock’s price and volume action—not emotion—to dictate their decisions.

CLICK/TAP CHART TO ZOOM
Chart services courtesy of stockcharts.com. Annotations by James Taulman.

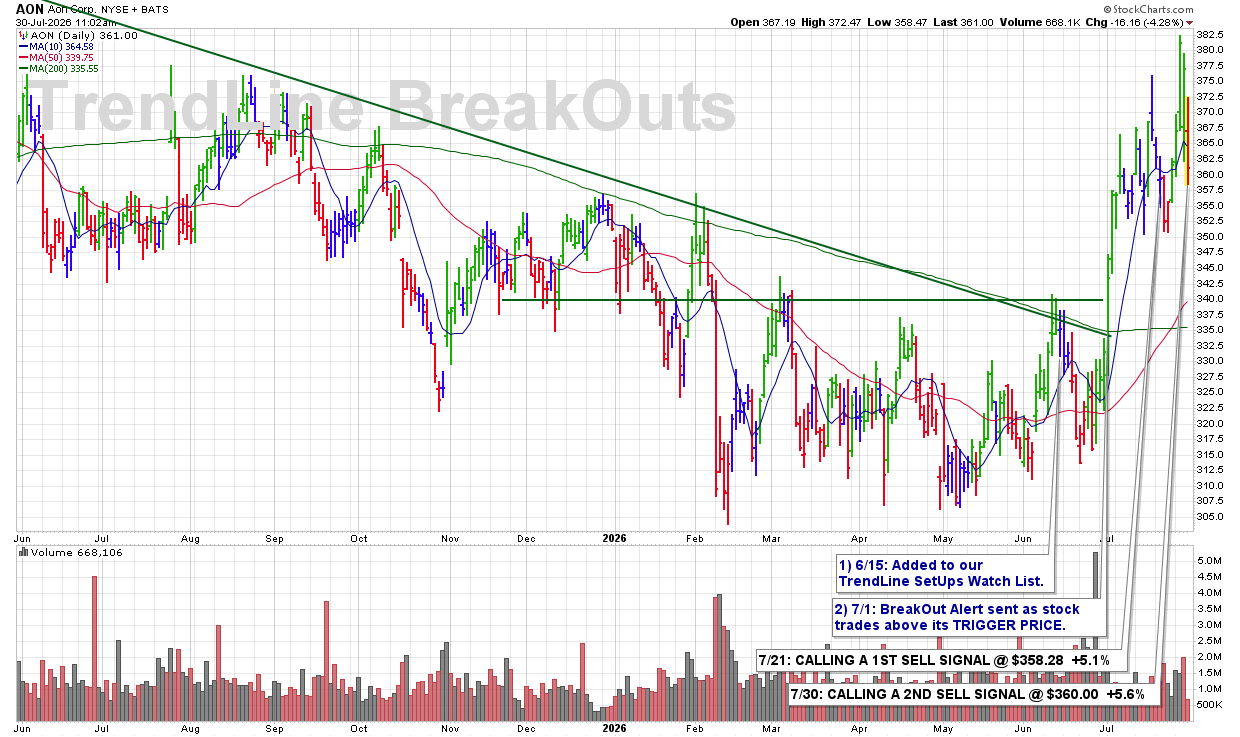
THU 7/30: AON – CALLING A 2ND SELL SIGNAL @ $360.00 +5.6%

10:55 AM – Calling a 2ND SELL SIGNAL this morning as shares break below the 10 DMA on a sharp increase in trading volume. The combination of a key technical violation and expanding volume suggests institutional selling pressure is increasing and supports further reducing the position.

ULTRA Trader’s Tip: Volume Confirms the Technical Breakdown

• A break below the 10 DMA becomes more meaningful when accompanied by above-average volume.

• Increasing volume often reflects institutional distribution rather than routine profit-taking.

• Scaling out as technical weakness develops helps preserve gains while reducing portfolio risk.

CLICK/TAP CHART TO ZOOM
Chart services courtesy of stockcharts.com. Annotations by James Taulman.

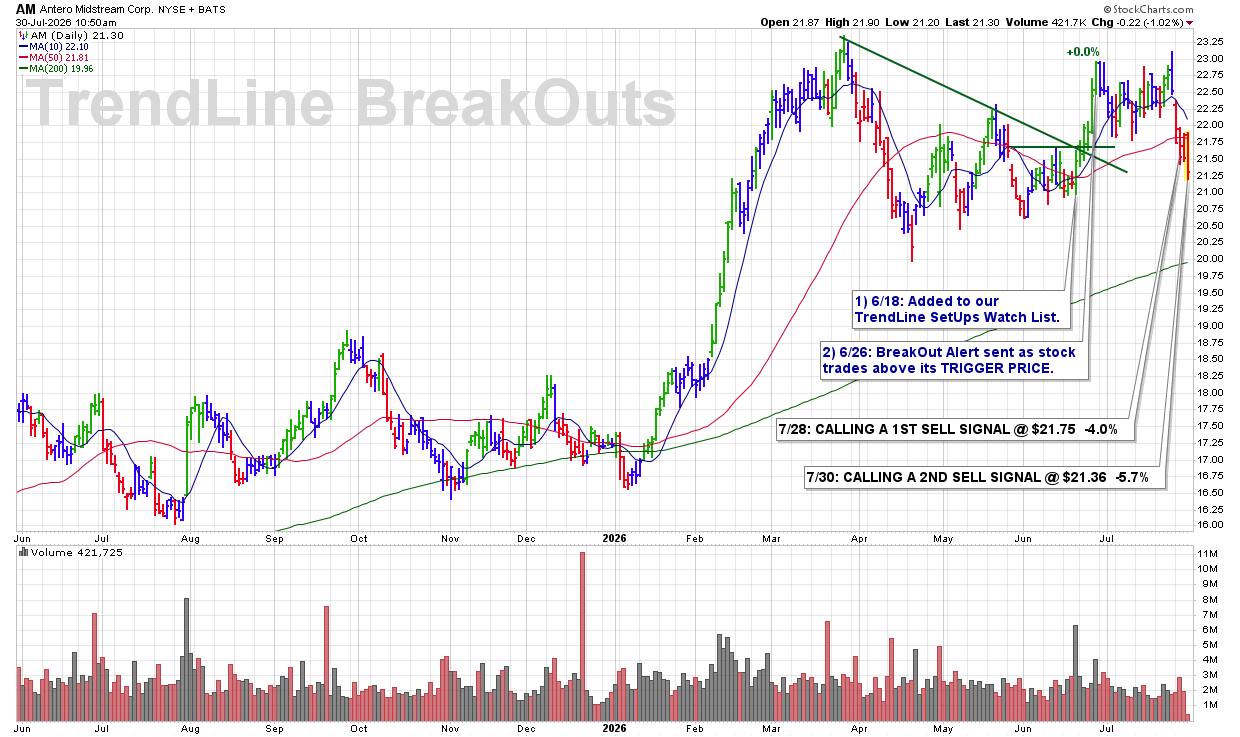
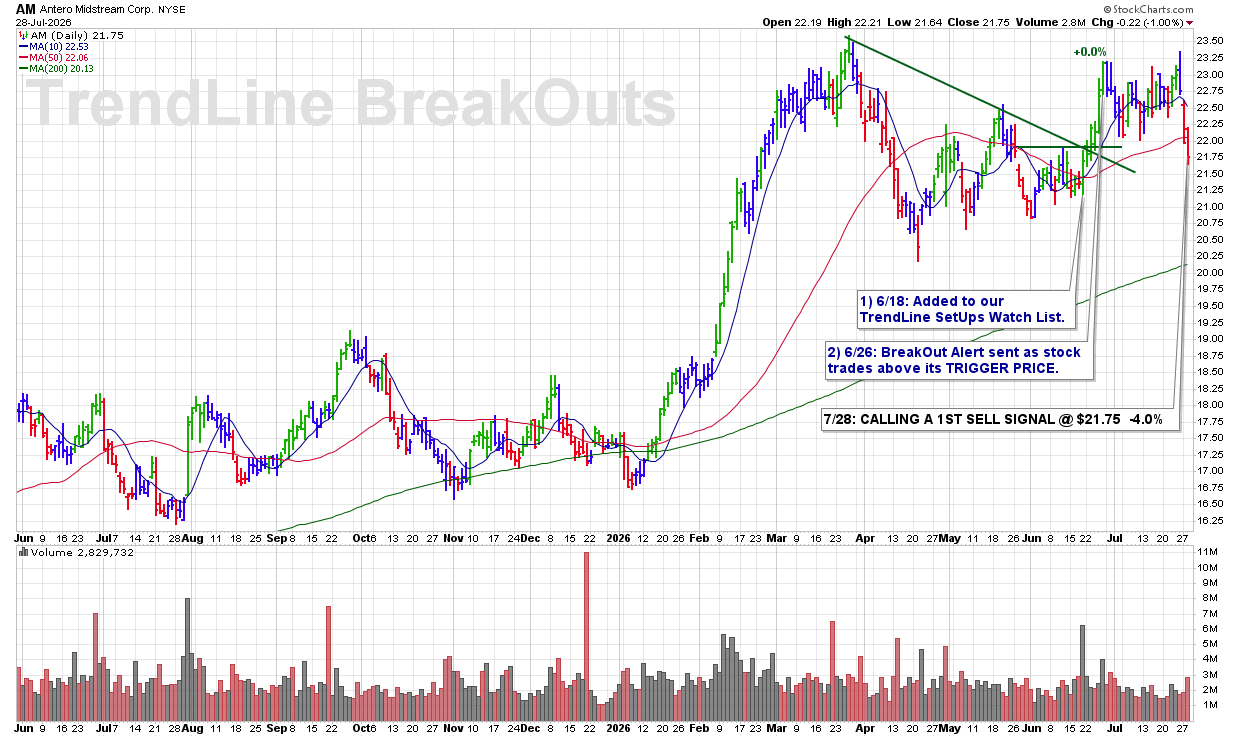
THU 7/30: AM – CALLING A 2ND / FINAL SELL SIGNAL @ $21.36 -5.7%

10:39 AM – Calling a 2ND and FINAL SELL SIGNAL as the stock continues to trade below its 50 DMA and displays persistent technical weakness. The failure to reclaim this key support level confirms the deterioration in the stock’s technical condition coupled with the near -6% decline warrants completing the exit.

ULTRA Trader’s Tip: Do Not Wait for Weakness to Become Worse

• Continued trading below the 50 DMA confirms that an important support level has been lost.

• A stock’s failure to recover after a major technical violation is often a signal to reduce the remaining exposure.

• Completing the exit protects capital and keeps losses from becoming more difficult to manage.

CLICK/TAP CHART TO ZOOM
Chart services courtesy of stockcharts.com. Annotations by James Taulman.

TUE 7/28: AM – CALLING A 1ST SELL SIGNAL @ $21.75 -4.0%

3:47 PM – Calling a 1ST SELL SIGNAL here as the stock has clearly broken below its 50 DMA support and is closing near the session lows on a 27% increase in volume. The combination of a major support violation, weak closing action, and rising volume represents a meaningful deterioration in the stock’s technical condition.

ULTRA Trader’s Tip: Respect a Break of Major Support

• The 50 DMA is an important intermediate-term support level.

• A break below support carries greater significance when volume expands.

• Closing near the session lows confirms that sellers remained in control through the end of the day.

CLICK/TAP CHART TO ZOOM
Chart services courtesy of stockcharts.com. Annotations by James Taulman.

THU 7/23: AFRM – CALLING A 3RD SELL SIGNAL @ $71.19 +1.6%

10:20 AM – The stock gapped lower this morning, breaking decisively below its 50 DMA. That is a significant technical violation and triggers a 3RD and FINAL SELL SIGNAL under our rules. The breakdown confirms continued technical deterioration and warrants exiting the remaining position.

ULTRA Trader’s Tip: The 50 DMA Is a Critical Support Level

  • A decisive break below the 50 DMA often signals that a stock’s intermediate-term trend is changing.

  • Gap-down breaks through major support indicate that selling pressure has intensified.

  • When a stock violates the 50 DMA after prior SELL SIGNALS, the technical evidence favors exiting the remaining position.

CLICK/TAP CHART TO ZOOM
Chart services courtesy of stockcharts.com. Annotations by James Taulman.

FRI 7/17: AROC – CALLING A 3RD SELL SIGNAL @ $36.17 -3.3%

9:55 AM – The stock is now clearly breaking below its 50 DMA after encountering repeated resistance at the 10 DMA over the past several weeks. That continued technical deterioration triggers a 3RD and FINAL SELL SIGNAL this morning.

ULTRA Trader’s Tip: Failed Recoveries Often Lead Lower

  • When a stock repeatedly fails to reclaim its 10 DMA, buying interest is weakening.

  • A subsequent break below the 50 DMA confirms that sellers have taken control.

  • Respecting these stacked technical violations helps preserve capital for stronger opportunities.

CLICK/TAP CHART TO ZOOM
Chart services courtesy of stockcharts.com. Annotations by James Taulman.

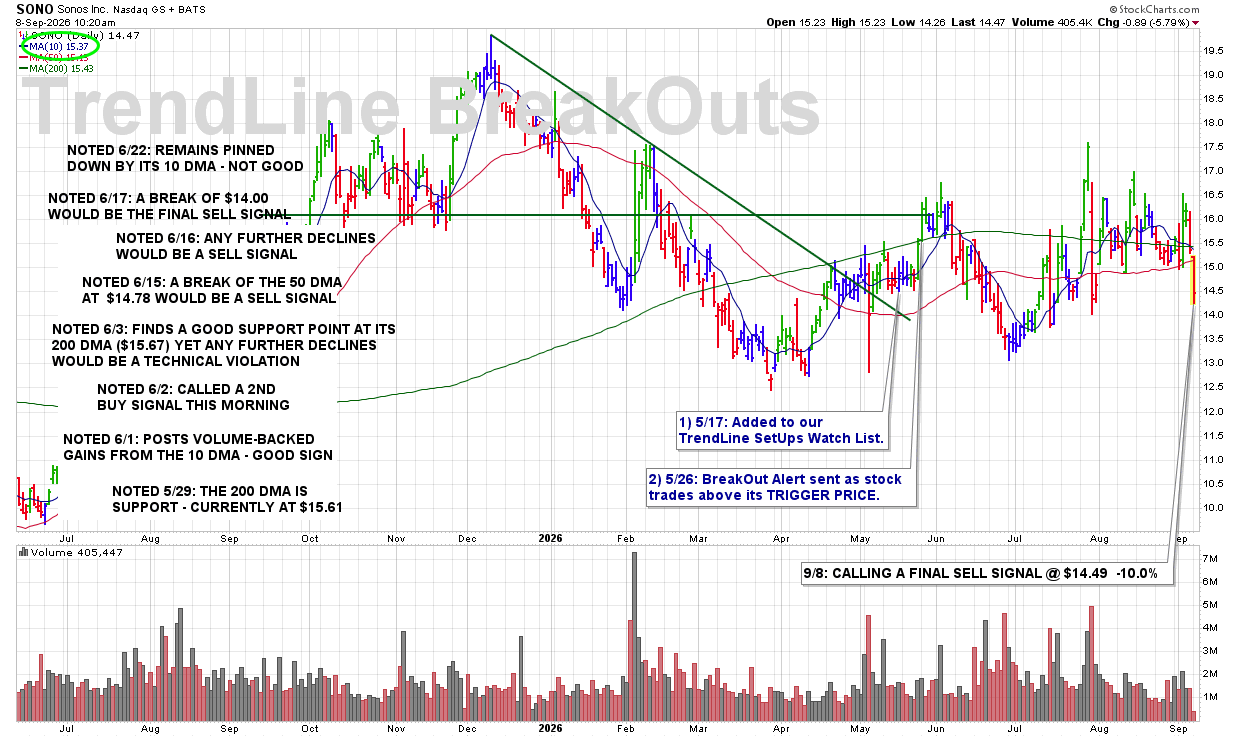
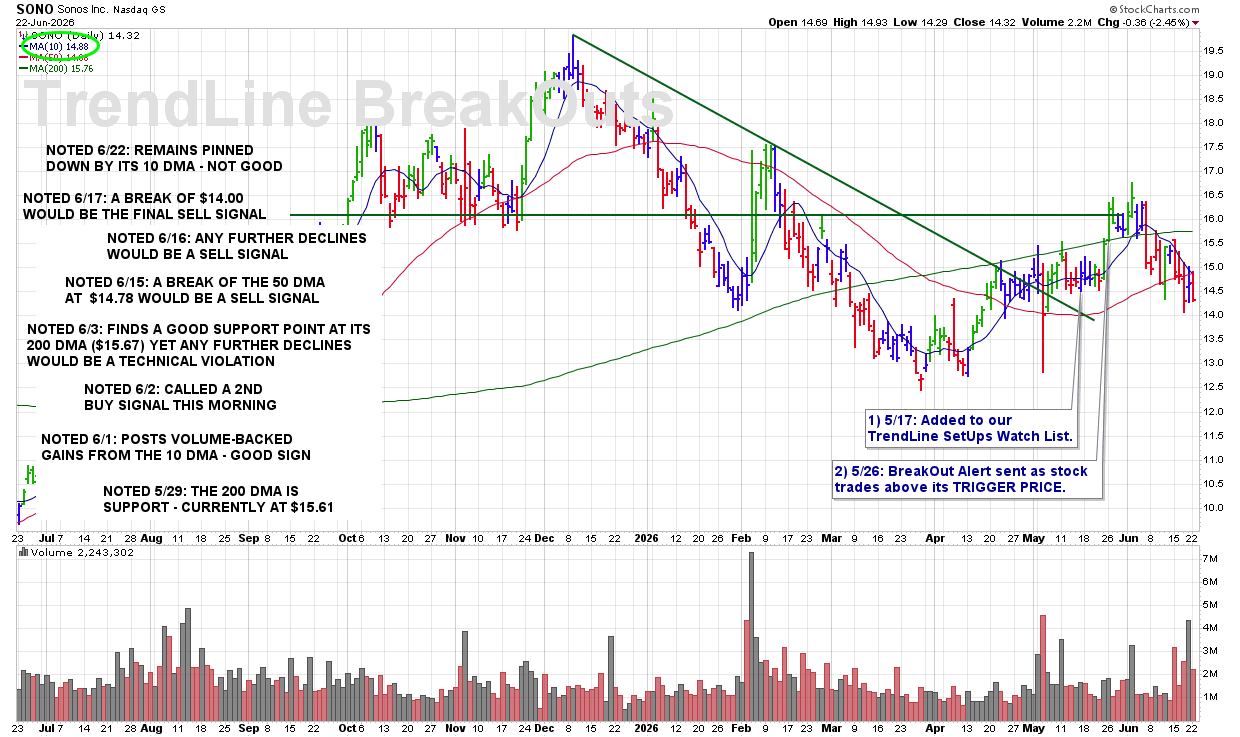
MON 6/22: SONO – Remains Pinned Down by Its 10 DMA – Not Good

Latest Chart Update: SONO

9:00 PM – We are currently reporting on this stock as an active holding and continue to monitor the stock closely for any technical SELL SIGNALS.

The focus always remains on price/volume action around key support levels, including the 10 DMA, 50 DMA, and any nearby trendline or ROUND-$ support.

CLICK/TAP CHART TO ZOOM
Chart services courtesy of stockcharts.com. Annotations by James Taulman.

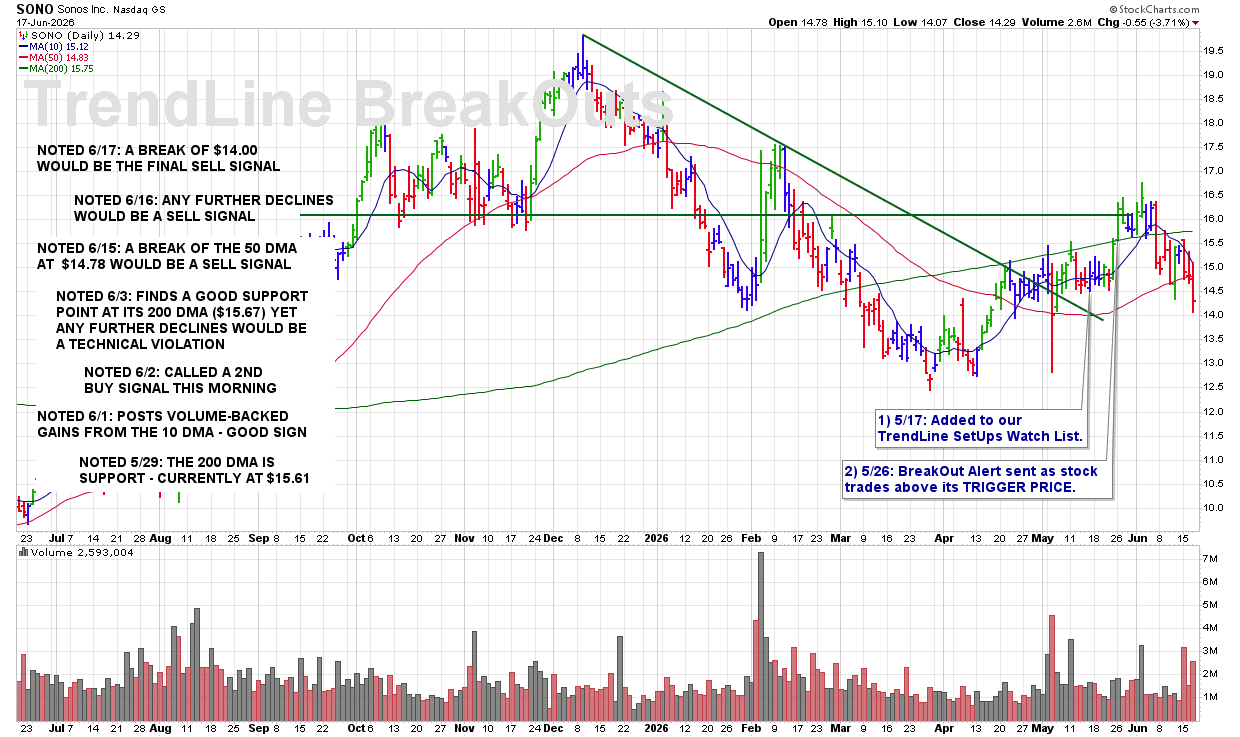
WED 6/17: SONO – A Break of $14.00 Would Be the Final Sell Signal

Latest Chart Update: SONO

9:00 PM – We are currently reporting on this stock as an active holding and continue to monitor the stock closely for any technical SELL SIGNALS.

The focus always remains on price/volume action around key support levels, including the 10 DMA, 50 DMA, and any nearby trendline or ROUND-$ support.

CLICK/TAP CHART TO ZOOM
Chart services courtesy of stockcharts.com. Annotations by James Taulman.

TUE 6/16: SONO – Any Further Declines Would Be a Sell Signal

Latest Chart Update: SONO

9:00 PM – We are currently reporting on this stock as an active holding and continue to monitor the stock closely for any technical SELL SIGNALS.

The focus always remains on price/volume action around key support levels, including the 10 DMA, 50 DMA, and any nearby trendline or ROUND-$ support.

CLICK/TAP CHART TO ZOOM
Chart services courtesy of stockcharts.com. Annotations by James Taulman.

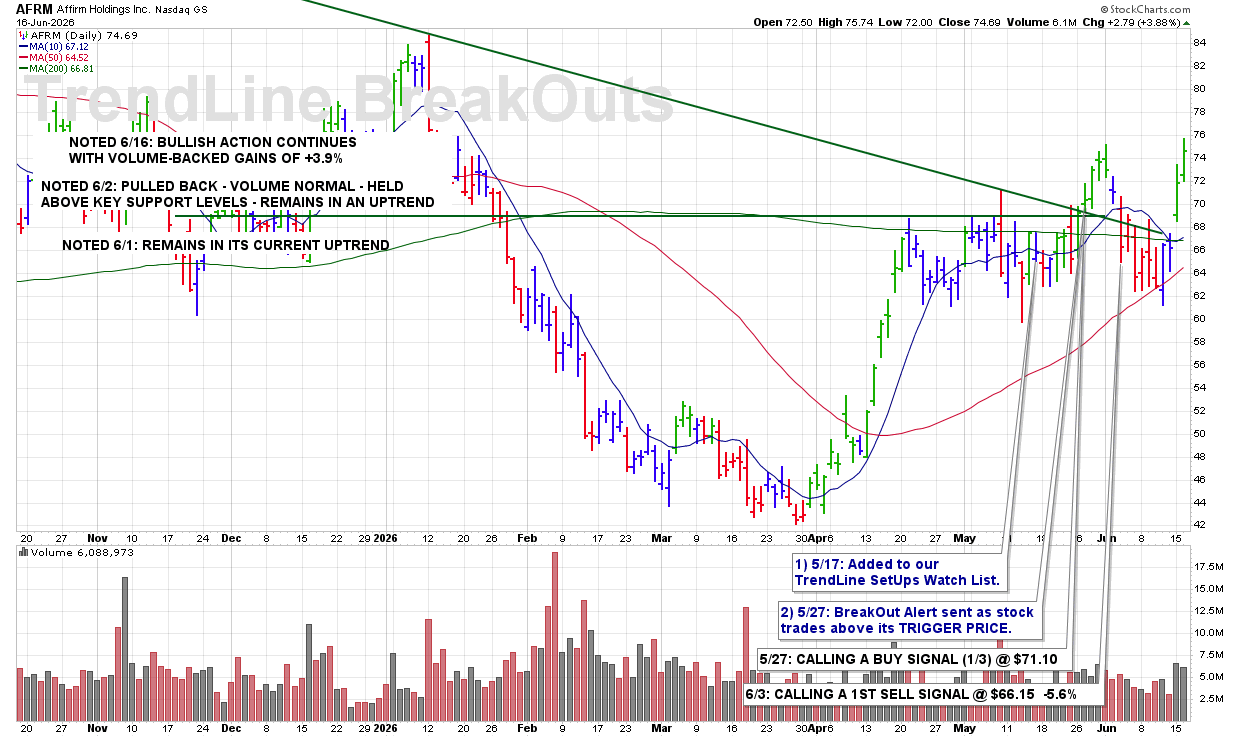
TUE 6/16: AFRM – Bullish Action Continues With Volume-Backed Gains of +3.9%

Latest Chart Update: AFRM

8:50 PM – We are currently reporting on this stock as an active holding and continue to monitor the stock closely for any technical SELL SIGNALS.

The focus always remains on price/volume action around key support levels, including the 10 DMA, 50 DMA, and any nearby trendline or ROUND-$ support.

CLICK/TAP CHART TO ZOOM
Chart services courtesy of stockcharts.com. Annotations by James Taulman.

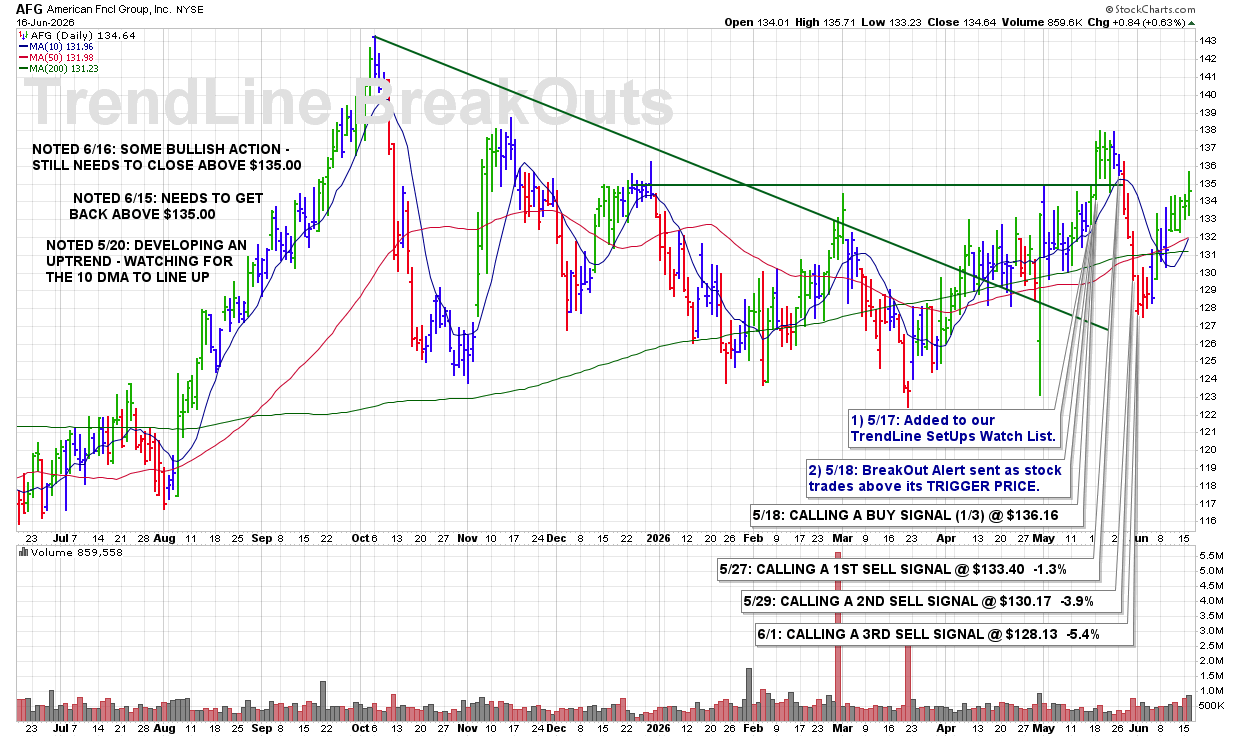
TUE 6/16: AFG – Some Bullish Action – Still Needs to Close Above $135.00

Latest Chart Update: AFG

8:45 PM – We are currently reporting on this stock as an active holding and continue to monitor the stock closely for any technical SELL SIGNALS.

The focus always remains on price/volume action around key support levels, including the 10 DMA, 50 DMA, and any nearby trendline or ROUND-$ support.

CLICK/TAP CHART TO ZOOM
Chart services courtesy of stockcharts.com. Annotations by James Taulman.

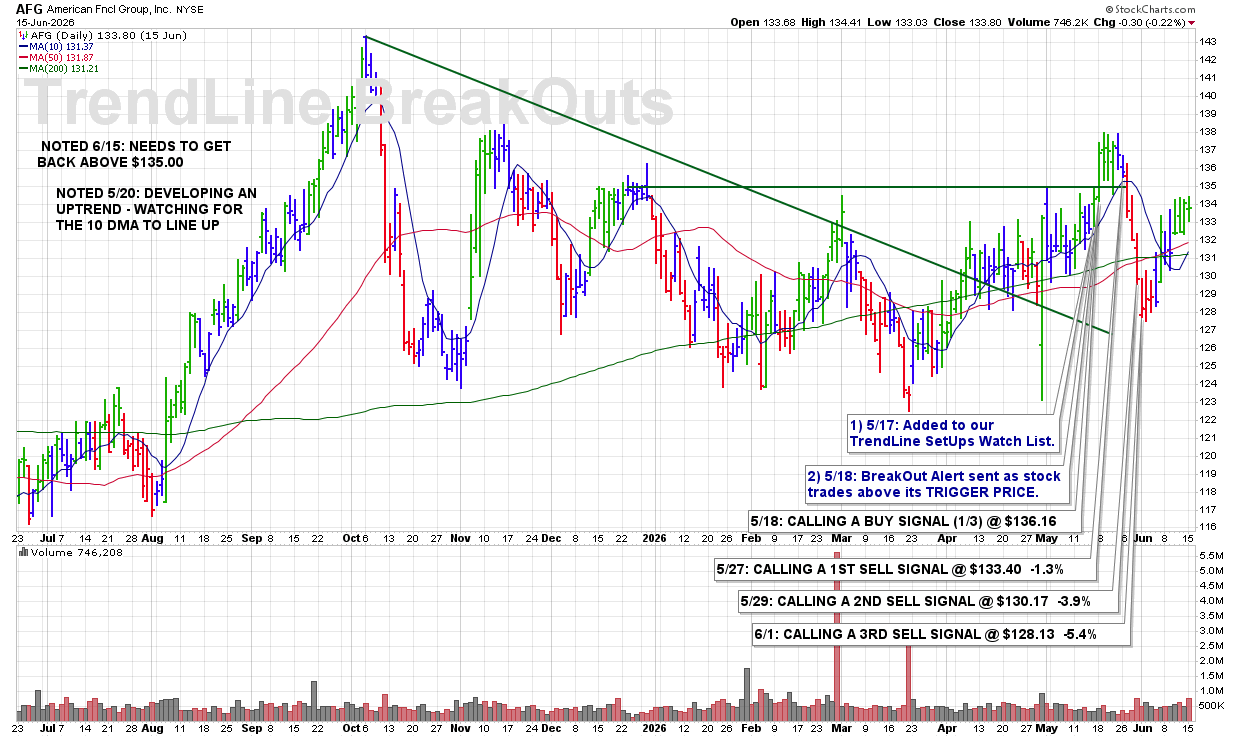
MON 6/15: AFG – Needs to Get Back Above $135.00

Latest Chart Update: AFG

9:30 PM -We are currently reporting on this stock as an active holding and continue to monitor the stock closely for any technical SELL SIGNALS.

The focus always remains on price/volume action around key support levels, including the 10 DMA, 50 DMA, and any nearby trendline or ROUND-$ support.

CLICK/TAP CHART TO ZOOM
Chart services courtesy of stockcharts.com. Annotations by James Taulman.

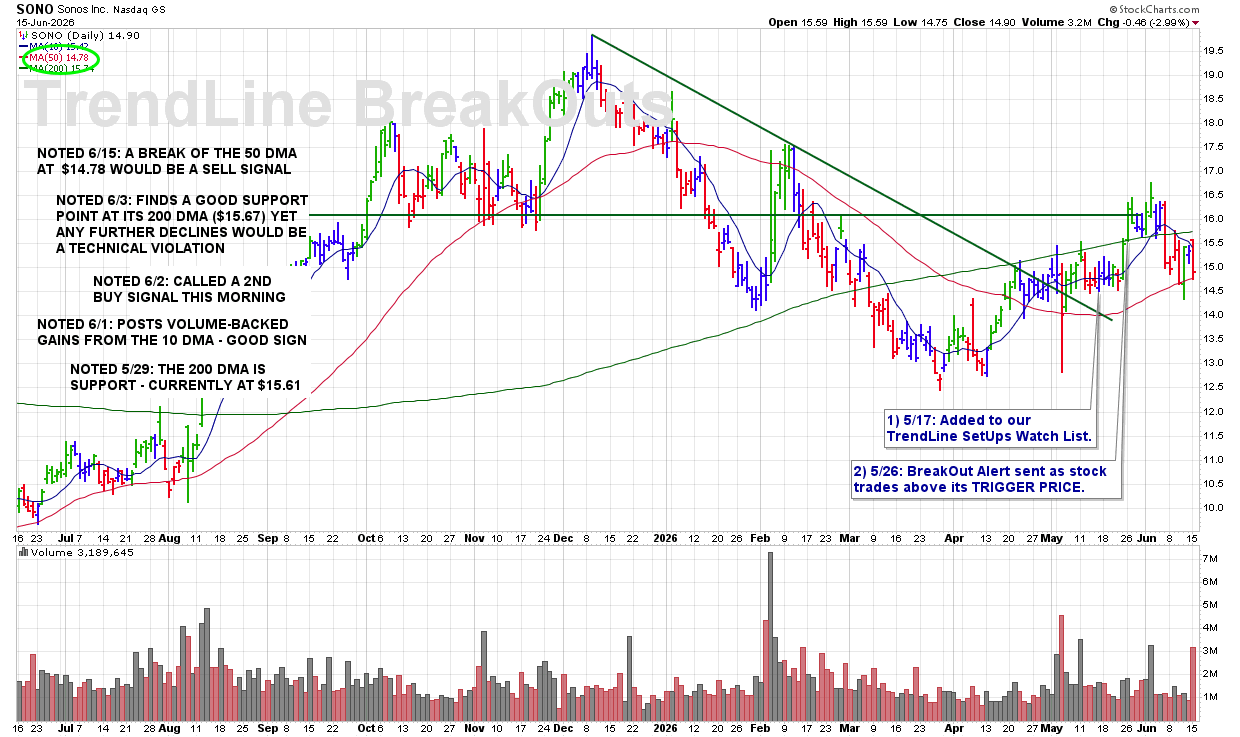
MON 6/15: SONO – A Break of the 50 DMA at $14.78 Would Be a Sell Signal

Latest Chart Update: SONO

9:20 PM -We are currently reporting on this stock as an active holding and continue to monitor the stock closely for any technical SELL SIGNALS.

The focus always remains on price/volume action around key support levels, including the 10 DMA, 50 DMA, and any nearby trendline or ROUND-$ support.

CLICK/TAP CHART TO ZOOM
Chart services courtesy of stockcharts.com. Annotations by James Taulman.

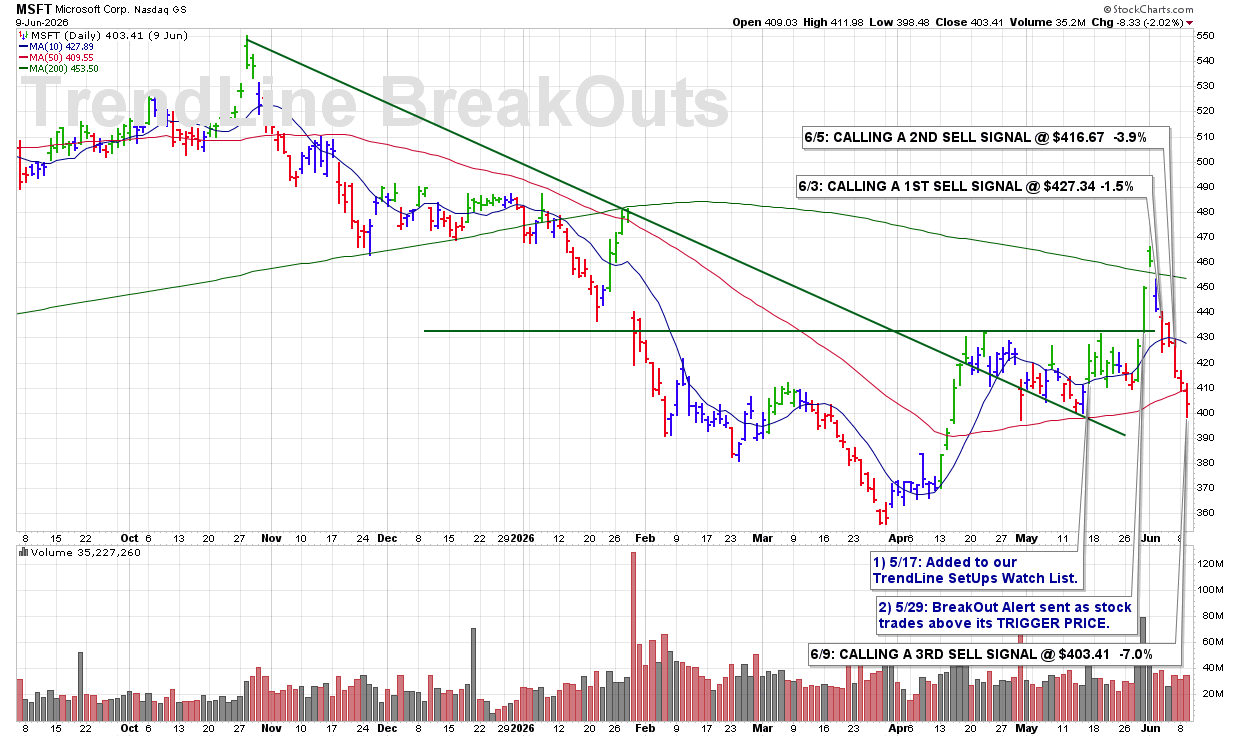
TUE 6/9: MSFT – CALLING A 3RD SELL SIGNAL @ $403.41 -7.0%

3:54 PM – Shares have now broken below the 50 DMA, currently at $410.20, and that is another significant technical violation. This triggers a 3RD and FINAL SELL SIGNAL under our rules.

ULTRA Trader’s Tip: The 50 DMA Often Marks the Line

  • The 50 DMA is one of the most widely followed support levels on Wall Street.

  • When a stock loses both its 10 DMA and 50 DMA, technical risk increases substantially.

  • Final SELL SIGNALS are designed to move capital out of deteriorating charts and into stronger opportunities.

CLICK/TAP CHART TO ZOOM
Chart services courtesy of stockcharts.com. Annotations by James Taulman.

We are currently reporting on this stock as an active holding and continue to monitor the stock closely for any technical SELL SIGNALS.

The focus always remains on price/volume action around key support levels, including the 10 DMA, 50 DMA, and any nearby trendline or ROUND-$ support.

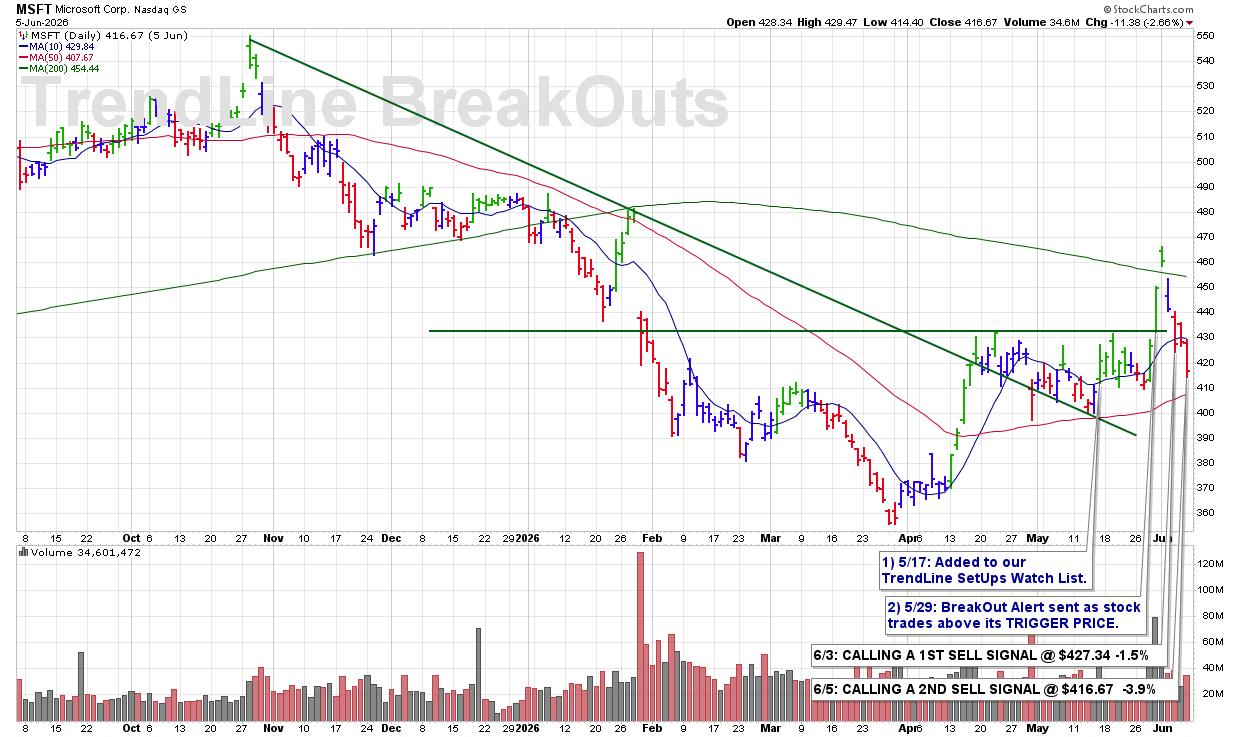
FRI 6/5: MSFT – CALLING A 2ND SELL SIGNAL @ $416.67 -3.9%

3:57 PM – Continued bearish action with another sharp sell-off and a close below support at ROUND-$420. The stock continues to deteriorate technically, warranting a 2ND SELL SIGNAL.

ULTRA Trader’s Tip: Support Breaks Often Come in Stages

  • Initial weakness often begins with a break of the 10 DMA.

  • Subsequent breaks of key price levels confirm the deterioration.

  • When support levels fail one after another, the probability of further downside increases.

CLICK/TAP CHART TO ZOOM
Chart services courtesy of stockcharts.com. Annotations by James Taulman.

We are currently reporting on this stock as an active holding and continue to monitor the stock closely for any technical SELL SIGNALS.

The focus always remains on price/volume action around key support levels, including the 10 DMA, 50 DMA, and any nearby trendline or ROUND-$ support.

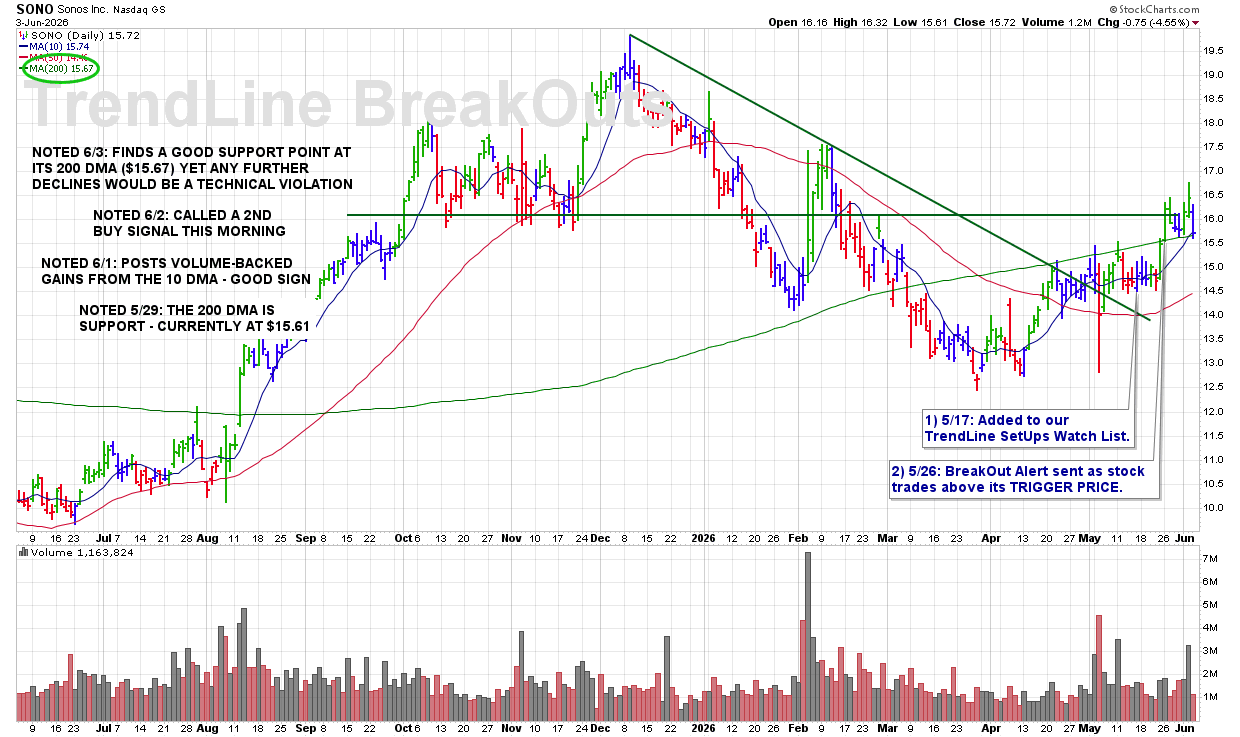
WED 6/3: SONO – Finds a Good Support Point at Its 200 DMA ($15.67) Yet Any Further Declines Would Be a Technical Violation

Latest Chart Update: SONO

9:10 PM – We are currently reporting on this stock as an active holding and continue to monitor the stock closely for any technical SELL SIGNALS.

The focus always remains on price/volume action around key support levels, including the 10 DMA, 50 DMA, and any nearby trendline or ROUND-$ support.

CLICK/TAP CHART TO ZOOM
Chart services courtesy of stockcharts.com. Annotations by James Taulman.

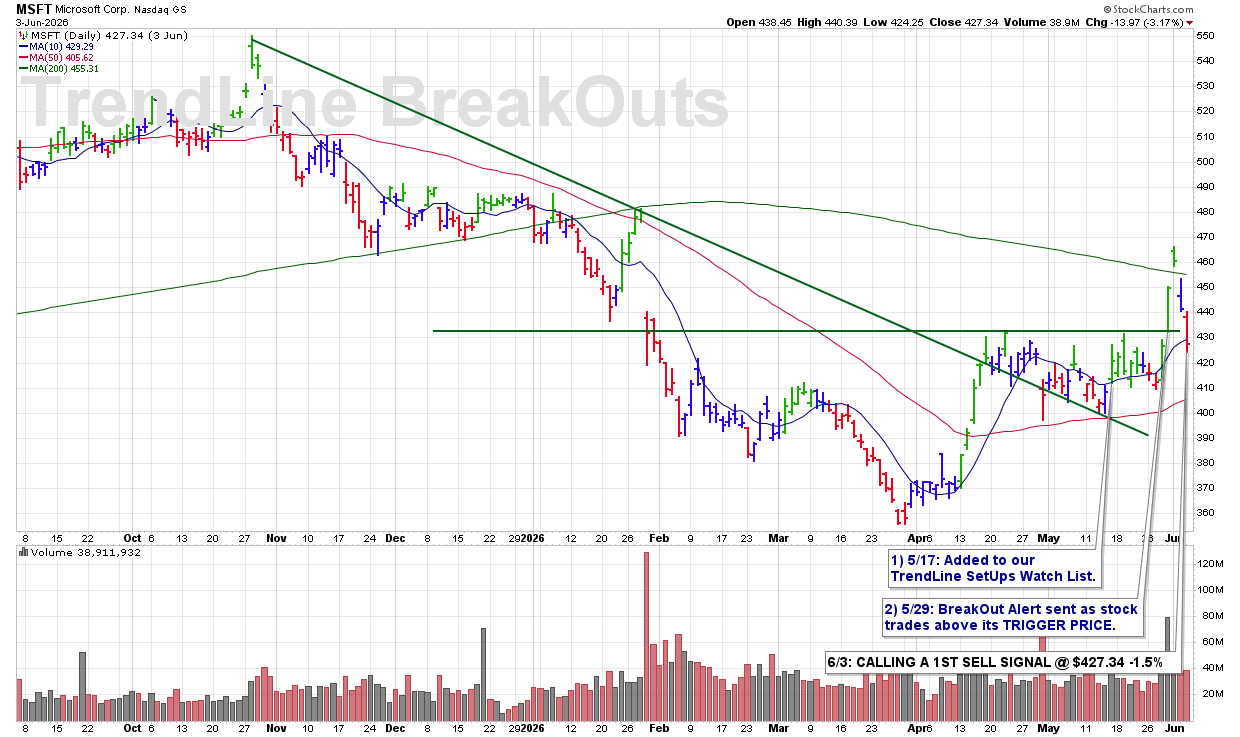
WED 6/3: MSFT – CALLING A 1ST SELL SIGNAL @ $427.34 -1.5%

3:55 PM – After a sharp sell-off yesterday, the stock is closing below its 10 DMA this afternoon. That is a technical violation and triggers a 1ST SELL SIGNAL under our rules.

ULTRA Trader’s Tip: The First Break Often Matters Most

  • Leading stocks often find support at the 10 DMA during healthy uptrends.

  • A decisive break below that level can signal a shift in short-term momentum.

  • Taking action on the first violation helps prevent a small problem from becoming a larger one.

CLICK/TAP CHART TO ZOOM
Chart services courtesy of stockcharts.com. Annotations by James Taulman.

We are currently reporting on this stock as an active holding and continue to monitor the stock closely for any technical SELL SIGNALS.

The focus always remains on price/volume action around key support levels, including the 10 DMA, 50 DMA, and any nearby trendline or ROUND-$ support.

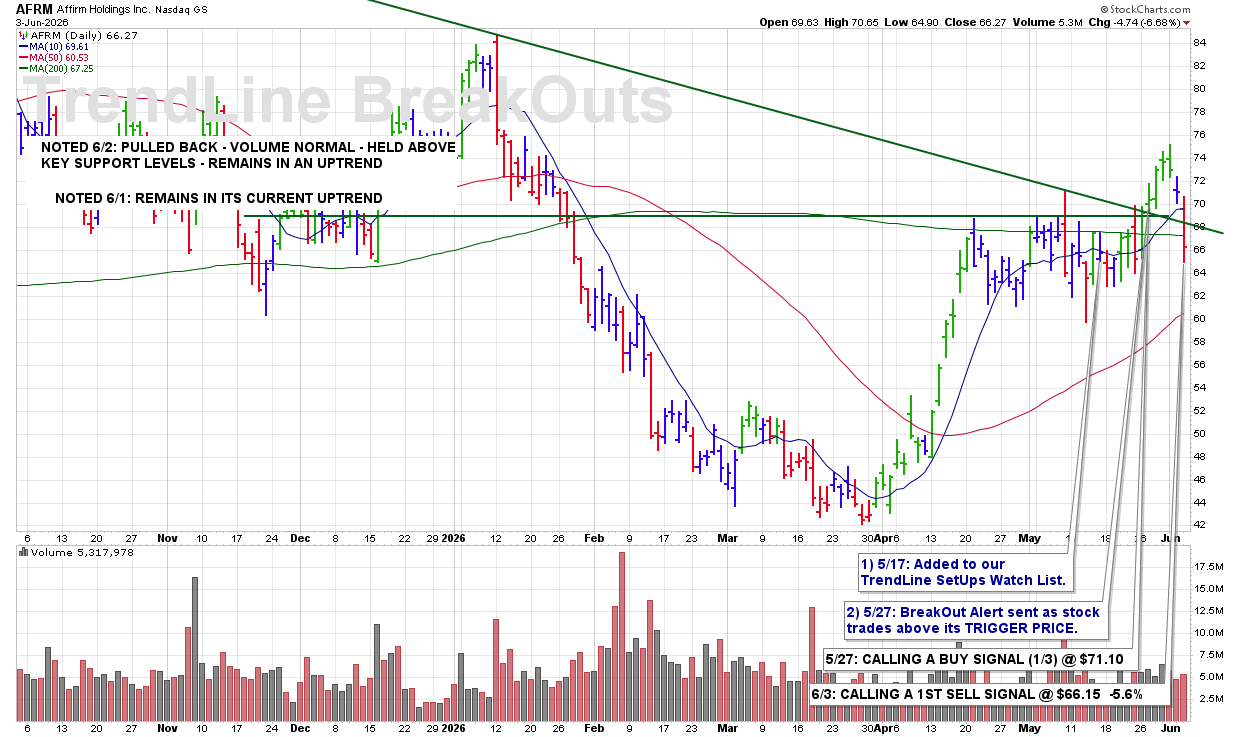
WED 6/3: AFRM – CALLING A 1ST SELL SIGNAL @ $66.15 -5.6%

2:24 PM – The stock sliced through its 10 DMA and also fell below its 200 DMA. Those are significant technical violations and trigger a 1ST SELL SIGNAL under our rules.

ULTRA Trader’s Tip: Multiple Violations Deserve Attention

  • A break below the 10 DMA signals weakening short-term momentum.

  • A loss of the 200 DMA raises concerns about the longer-term trend.

  • When multiple support levels fail simultaneously, reducing risk becomes the prudent course of action.

CLICK/TAP CHART TO ZOOM
Chart services courtesy of stockcharts.com. Annotations by James Taulman.

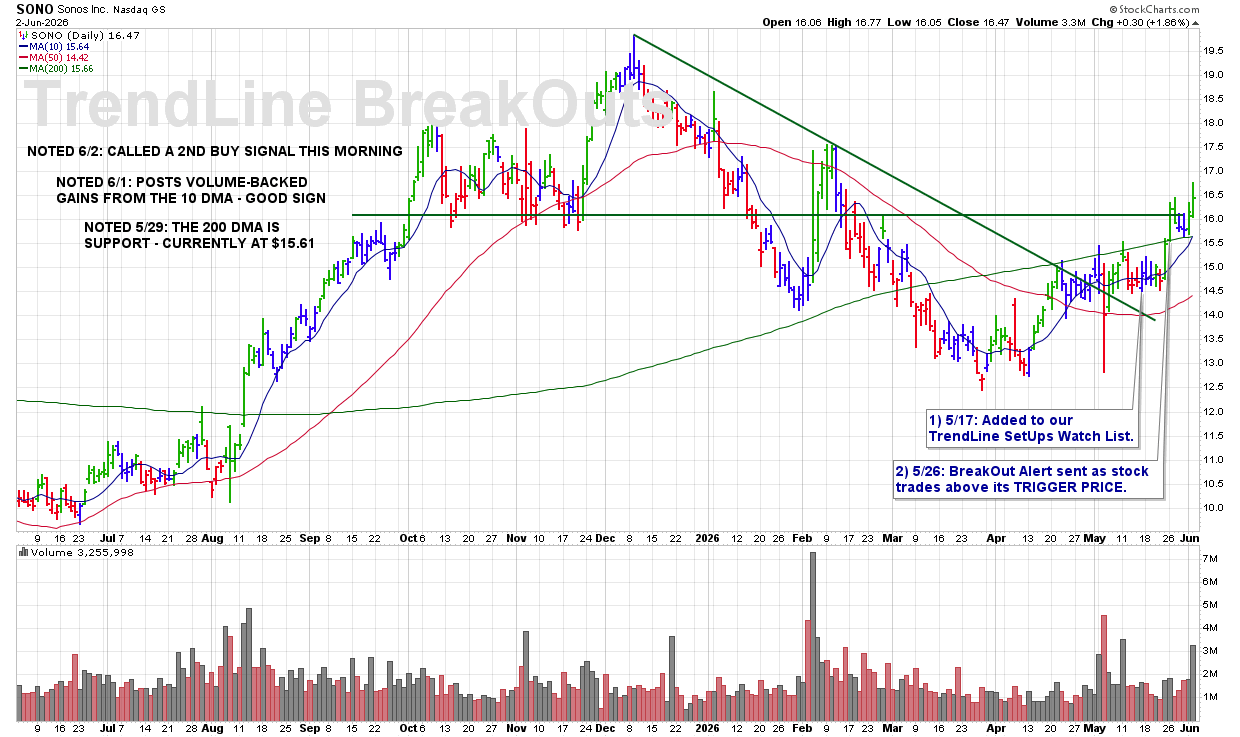
TUE 6/2: SONO – Called a 2nd Buy Signal This Morning

Latest Chart Update: SONO

10:35 PM – We are currently reporting on this stock as an active holding and continue to monitor the stock closely for any technical SELL SIGNALS.

The focus always remains on price/volume action around key support levels, including the 10 DMA, 50 DMA, and any nearby trendline or ROUND-$ support.

CLICK/TAP CHART TO ZOOM
Chart services courtesy of stockcharts.com. Annotations by James Taulman.

TUE 6/2: AFRM – Pulled Back – Volume Normal – Held Above Key Support Levels – Remains in an Uptrend

Latest Chart Update: AFRM

10:00 PM – We are currently reporting on this stock as an active holding and continue to monitor the stock closely for any technical SELL SIGNALS.

The focus always remains on price/volume action around key support levels, including the 10 DMA, 50 DMA, and any nearby trendline or ROUND-$ support.

CLICK/TAP CHART TO ZOOM
Chart services courtesy of stockcharts.com. Annotations by James Taulman.

MON 6/1: AFRM – Remains in Its Current Uptrend

Latest Chart Update: AFRM

9:30 PM – We are currently reporting on this stock as an active holding and continue to monitor the stock closely for any technical SELL SIGNALS.

The focus always remains on price/volume action around key support levels, including the 10 DMA, 50 DMA, and any nearby trendline or ROUND-$ support.

CLICK/TAP CHART TO ZOOM
Chart services courtesy of stockcharts.com. Annotations by James Taulman.

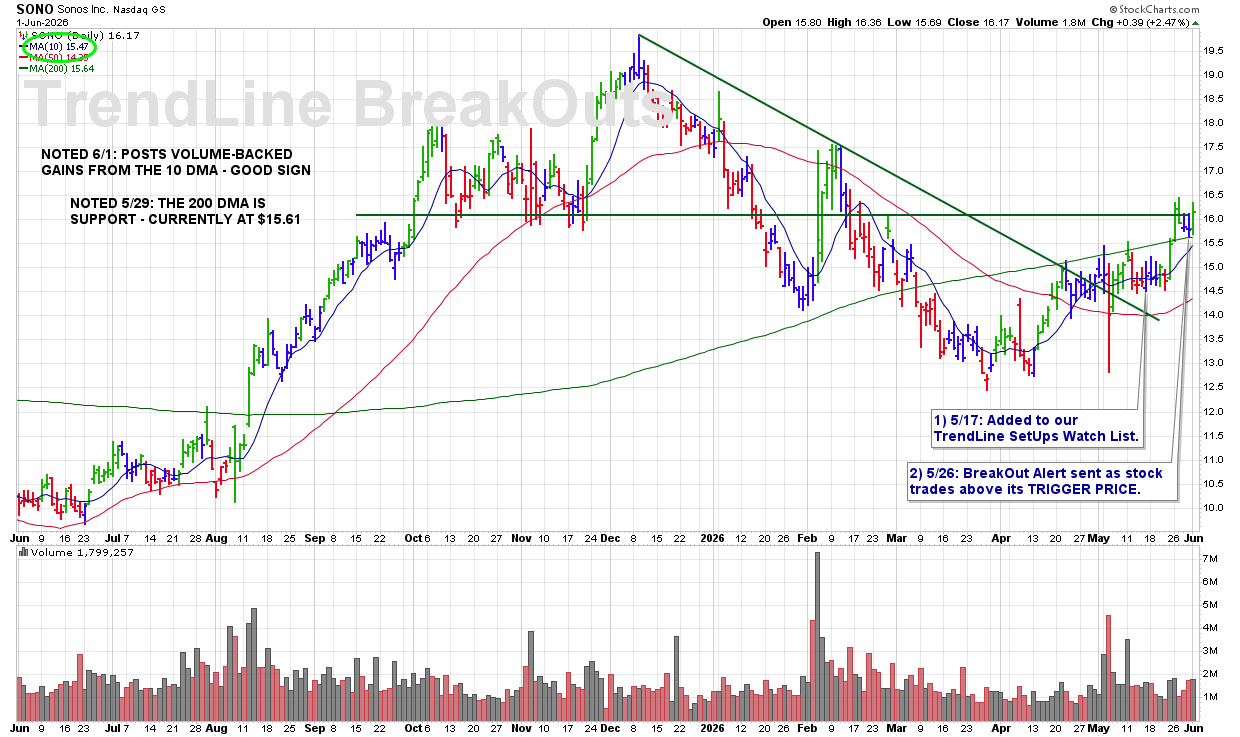
MON 6/1: SONO – Posts Volume-Backed Gains From the 10 DMA – Good Sign

Latest Chart Update: SONO

9:20 PM – We are currently reporting on this stock as an active holding and continue to monitor the stock closely for any technical SELL SIGNALS.

The focus always remains on price/volume action around key support levels, including the 10 DMA, 50 DMA, and any nearby trendline or ROUND-$ support.

CLICK/TAP CHART TO ZOOM
Chart services courtesy of stockcharts.com. Annotations by James Taulman.

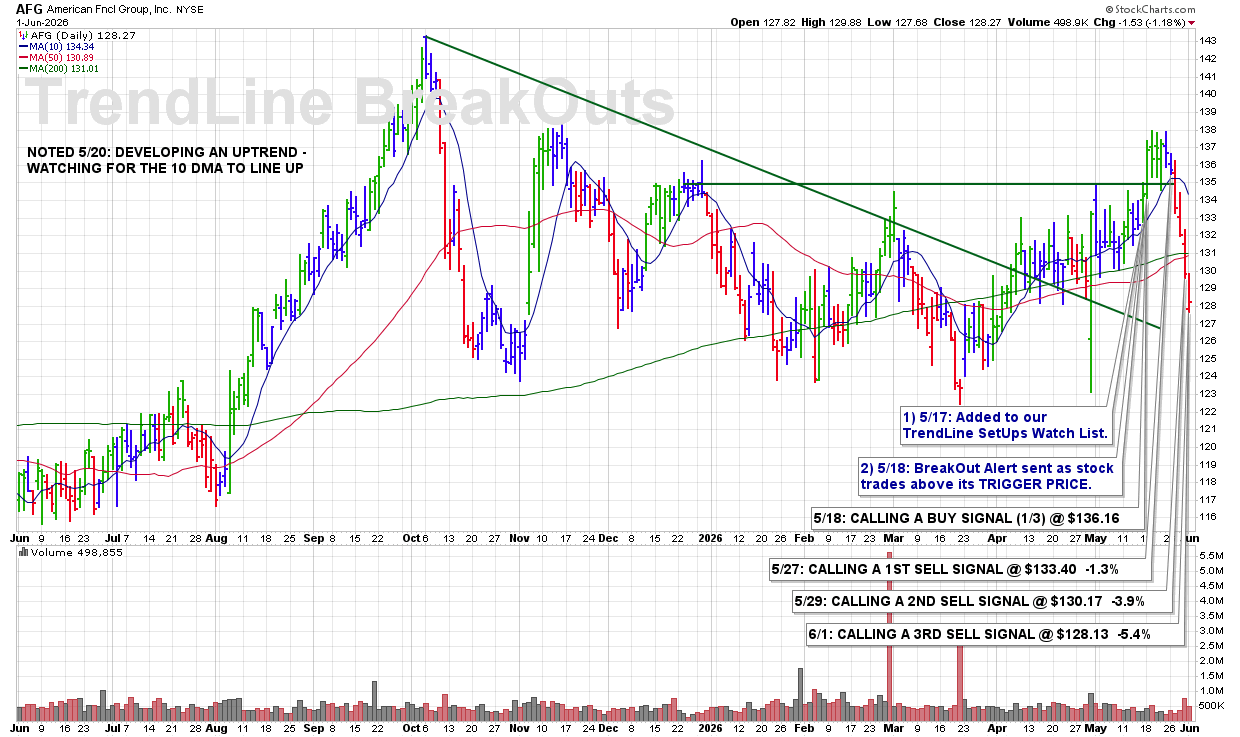
MON 6/1: AFG – CALLING A 3RD SELL SIGNAL @ $128.13 -5.4%

3:36 PM – The stock has lost another key support level with the break below ROUND-$130. That additional technical violation confirms continued deterioration and triggers a 3RD and FINAL SELL SIGNAL.

ULTRA Trader’s Tip: Support Levels Tell the Story

  • Each broken support level increases the odds of further downside.

  • Round-number levels often act as important psychological support zones.

  • Final exits help protect capital when a stock continues violating key technical levels.

CLICK/TAP CHART TO ZOOM
Chart services courtesy of stockcharts.com. Annotations by James Taulman.

FRI 5/29: AFG – CALLING A 2ND SELL SIGNAL @ $130.17 -3.9%

3:01 PM – The stock is breaking below its 50 DMA. That is a clear technical violation and triggers a 2ND SELL SIGNAL under our rules.

ULTRA Trader’s Tip: The 50 DMA Is a Key Line

  • The 50 DMA often serves as an important level of institutional support.

  • Breaks below this line signal weakening intermediate-term momentum.

  • Respecting major technical violations helps keep losses small and manageable.

CLICK/TAP CHART TO ZOOM
Chart services courtesy of stockcharts.com. Annotations by James Taulman.

WED 5/27: AFRM – CALLING A BUY SIGNAL (1/3) @ $71.10

9:49 AM – This stock has been on our TrendLine WatchList and is now breaking out and triggering our BUY SIGNAL as shares trade above the noted TRIGGER PRICE of $70.10. That breakout action confirms improving momentum and institutional interest.

ULTRA Trader’s Tip: Watch Lists Prepare You for the Move

  • Strong watch lists help identify setups before the breakout occurs.

  • Trigger prices create clear, rule-based entry points.

  • Breakouts above resistance often signal the beginning of a new advance.

CLICK/TAP CHART TO ZOOM
Chart services courtesy of stockcharts.com. Annotations by James Taulman.

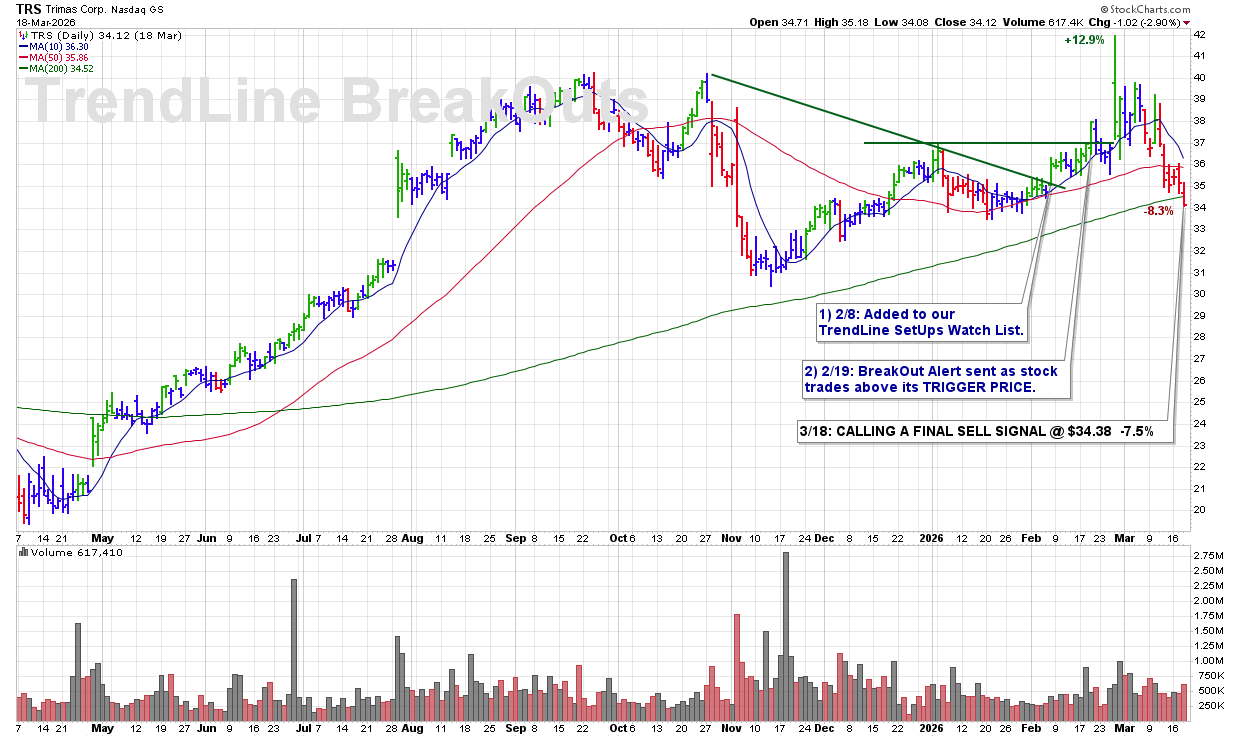
WED 3/18: TRS – CALLING A FINAL SELL SIGNAL @ $34.38 -7.5%

3:42 PM – Calling a FINAL SELL SIGNAL as we head into today’s close with shares breaking and closing below the 200 DMA on a +32% increase in volume. That combination confirms a decisive technical breakdown and signals institutional selling pressure.

ULTRA Trader’s Tip: Respect the 200 DMA Breakdown

  • The 200 DMA defines the long-term trend — breaks below it are significant.

  • Increased volume during the decline confirms real selling, not noise.

  • When long-term support fails, capital preservation takes priority.

CLICK/TAP CHART TO ZOOM
Chart services courtesy of stockcharts.com. Annotations by James Taulman.

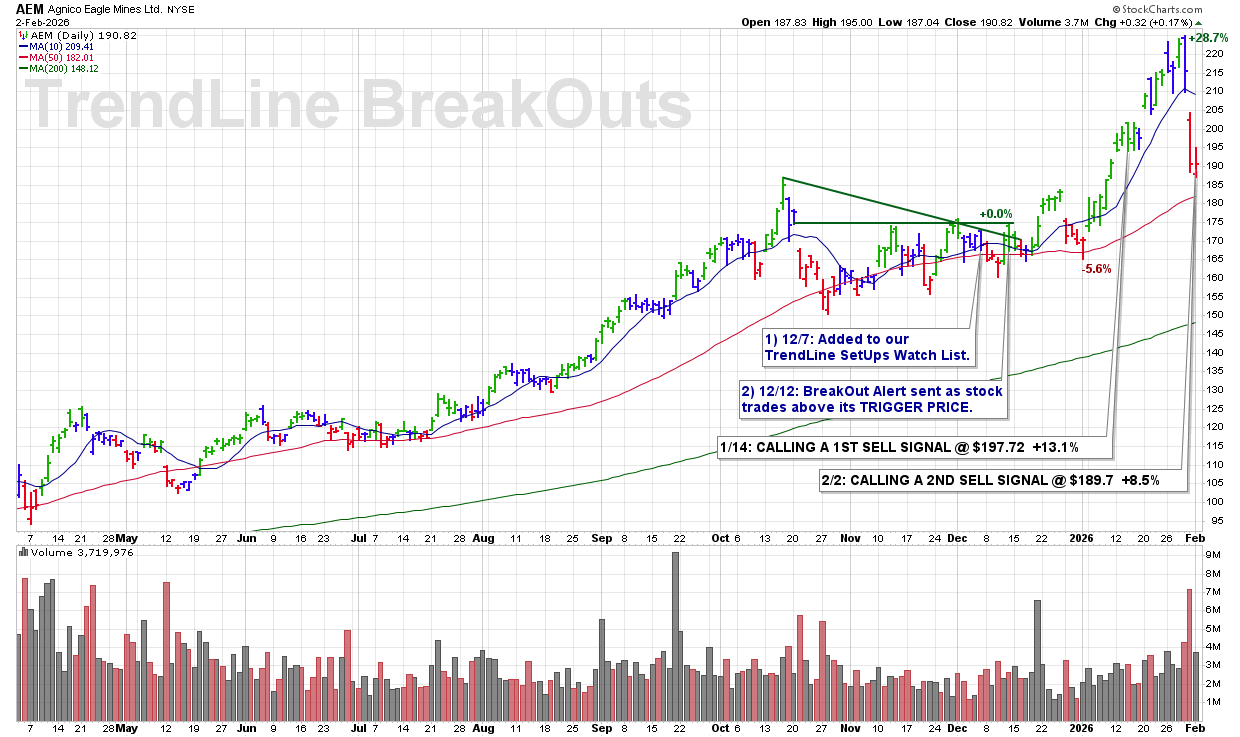
WED 2/4: AEM – CALLING A FINAL SELL SIGNAL @ $197.25 +12.9%

3:52 PM – Today’s rebound stalled at the ROUND-$200 level as the 10 DMA continues to roll over, signaling waning short-term momentum. In a broader tough market environment, I’m calling a FINAL SELL SIGNAL here and booking a solid winner.

SELL SIGNALS:
1/14 (1/3) @ $197.72 +13.1%
2/2 (1/3) @ $189.70 +8.5%
2/4 (1/3) @ $197.25 +12.9% FINAL

OVERALL P/L: +11.5%

ULTRA Trader’s Tip: Resistance Can Pause/End Gains

  • Round-number levels are clear technical levels of support/resistance.

  • A rolling-over 10 DMA confirms momentum is losing support.

  • Locking in gains when strength stalls keeps profits realized.

CLICK/TAP CHART TO ZOOM
Chart services courtesy of stockcharts.com. Annotations by James Taulman.

MON 2/2: AEM – CALLING A 2ND PROFIT TAKING SELL SIGNAL @ $189.7 +8.5%

3:55 PM – Shares are not making a quick recovery from Friday’s sharp sell-off, indicating continued short-term weakness. Calling a 2ND profit-taking SELL SIGNAL here and trimming further portfolio exposure.

SELL SIGNALS:
1/14 (1/3) @ $197.72 +13.1%
2/2 (1/3) @ $189.70 +8.5%

OVERALL P/L (ON SOLD SHARES): +10.8%

ULTRA Trader’s Tip: Weak Recoveries Deserve Respect

  • Strong stocks bounce quickly after sharp sell-offs.

  • When recovery stalls, momentum has shifted.

  • Taking profits as strength fades protects gains before pressure rebuilds.

CLICK/TAP CHART TO ZOOM
Chart services courtesy of stockcharts.com. Annotations by James Taulman.

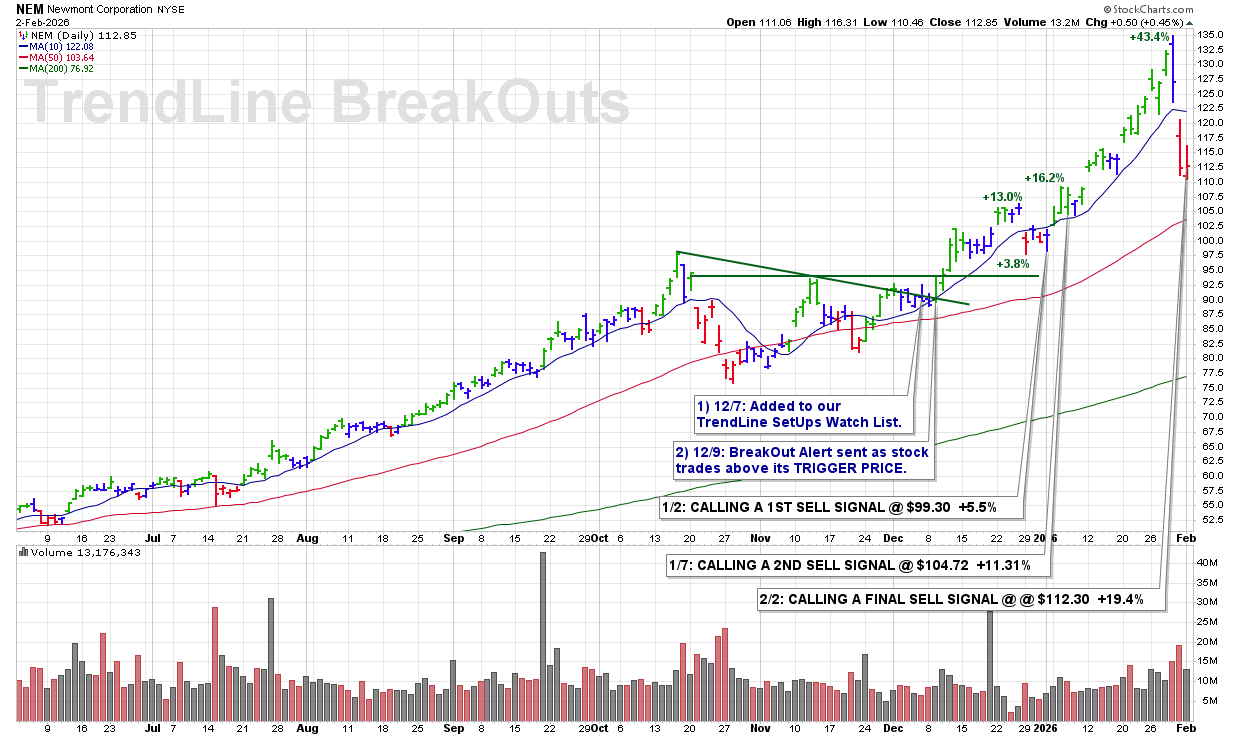
MON 2/2: NEM – CALLING A FINAL SELL SIGNAL @ $112.30 +19.4%

3:55 PM – Calling a FINAL SELL SIGNAL as shares have clearly lost 10 DMA support and are not recovering from Friday’s sharp sell-off, confirming a loss of short-term momentum. Closing out the call and locking in profits.

SELL SIGNALS:
1/2 (1/3) @ $99.30 +5.5%
1/7 (1/3) @ $104.72 +11.3%
2/2 (1/3) @ $112.30 +19.4% FINAL

OVERALL P/L: +12.1%

ULTRA Trader’s Tip: Failed Recoveries Are Tells

  • Strong stocks reclaim key averages quickly after sell-offs.

  • Failure to regain the 10 DMA signals momentum has shifted.

  • Taking profits as recovery stalls keeps gains realized, not exposed.

CLICK/TAP CHART TO ZOOM
Chart services courtesy of stockcharts.com. Annotations by James Taulman.

WED 1/7: NEM – CALLING A 2ND SELL SIGNAL @ $104.72 +11.3%

9:40 AM – Shares remain above their 10 DMA at $103.92, but with a strong move already in place, it makes sense to take additional profits here. Calling a 2ND SELL SIGNAL to further lock in gains while momentum is still favorable.

SELL SIGNALS:
1/2 (1/3) @ $99.30 +5.5%
1/7 (1/3) @ $104.72 +11.31%

OVERALL P/L: +8.4%

ULTRA Trader’s Tip: Profits Are Taken, Not Hoped For

  • You don’t need a breakdown to justify taking profits.

  • Selling strength above the 10 DMA is disciplined, not premature.

  • Scaling out into gains reduces emotional pressure and keeps capital working efficiently.

CLICK/TAP CHART TO ZOOM
Chart services courtesy of stockcharts.com. Annotations by James Taulman.

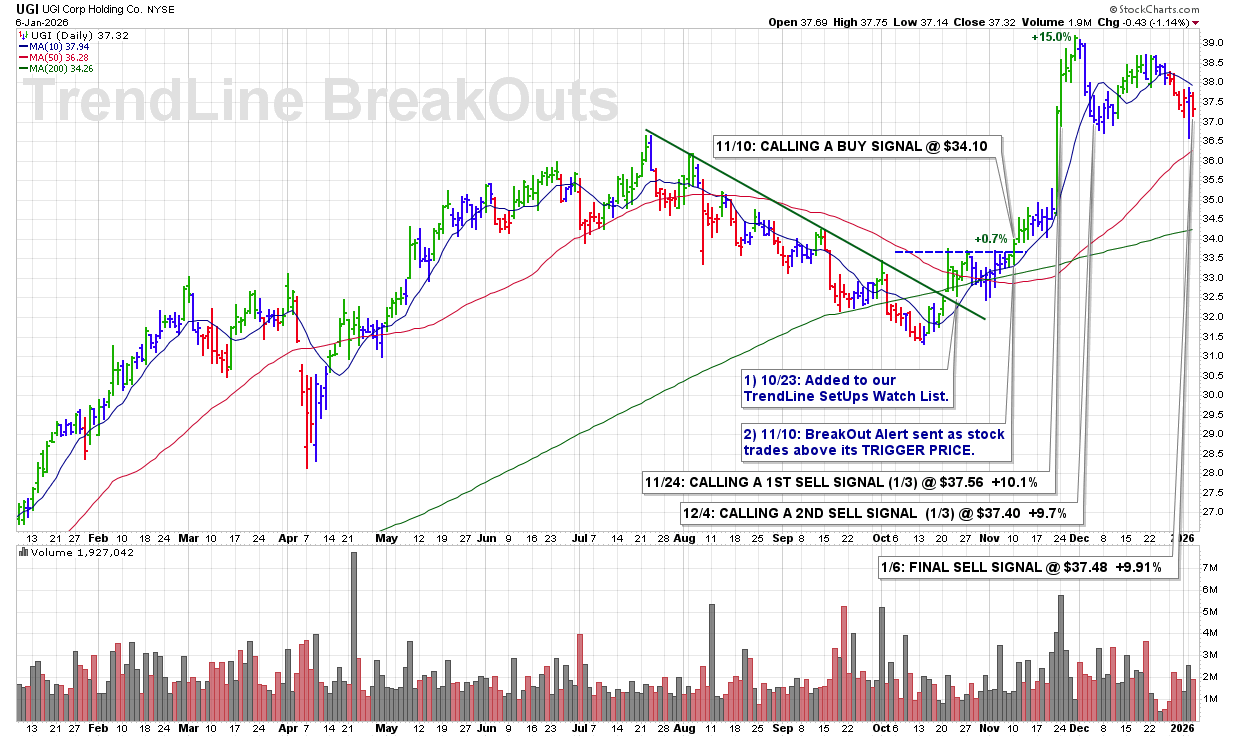
TUE 1/6: UGI – FINAL PROFIT TAKING SELL SIGNAL @ $37.48 +9.91%

9:57 AM – The 10 DMA is clearly acting as firm resistance and has begun to roll over. That confirms waning momentum and justifies calling a 3RD and FINAL PROFIT-TAKING SELL SIGNAL this morning, closing the position.

SELL SIGNALS:
11/24 (1/3) @ $37.56 +10.1%
12/4 (1/3) @ $37.40 +9.7%
1/6 (1/3) @ $37.48 +9.91%

OVERALL PROFIT: +9.9%

ULTRA Trader’s Tip: Resistance Ends Trades

  • When the 10 DMA flips from support to resistance, momentum has changed.

  • Multiple failures at a declining 10 DMA are a signal to finish the trade, not debate it.

  • Locking in gains on rule breaks preserves both capital and confidence.

CLICK/TAP CHART TO ZOOM
Chart services courtesy of stockcharts.com. Annotations by James Taulman.

FRI 1/2: NEM – CALLING A 1st SELL SIGNAL @ $99.30 +5.5%

12:02 PM – Calling a 1st profit-taking SELL SIGNAL this morning. After recently slipping below its 10 DMA, shares are now breaking below the next nearby level of support at the ROUND-$100 area. That combination signals waning momentum and justifies trimming exposure.

SELL SIGNALS:
1/2 (1/3) @ $99.30 +5.5%

ULTRA Trader’s Tip: Round Numbers Matter

  • ROUND-$ levels often act as psychological support and resistance zones.

  • When a stock breaks both the 10 DMA and a key round number, momentum typically deteriorates quickly.

  • Taking partial profits as rules break allows you to stay disciplined while protecting gains.

CLICK/TAP CHART TO ZOOM
Chart services courtesy of stockcharts.com. Annotations by James Taulman.

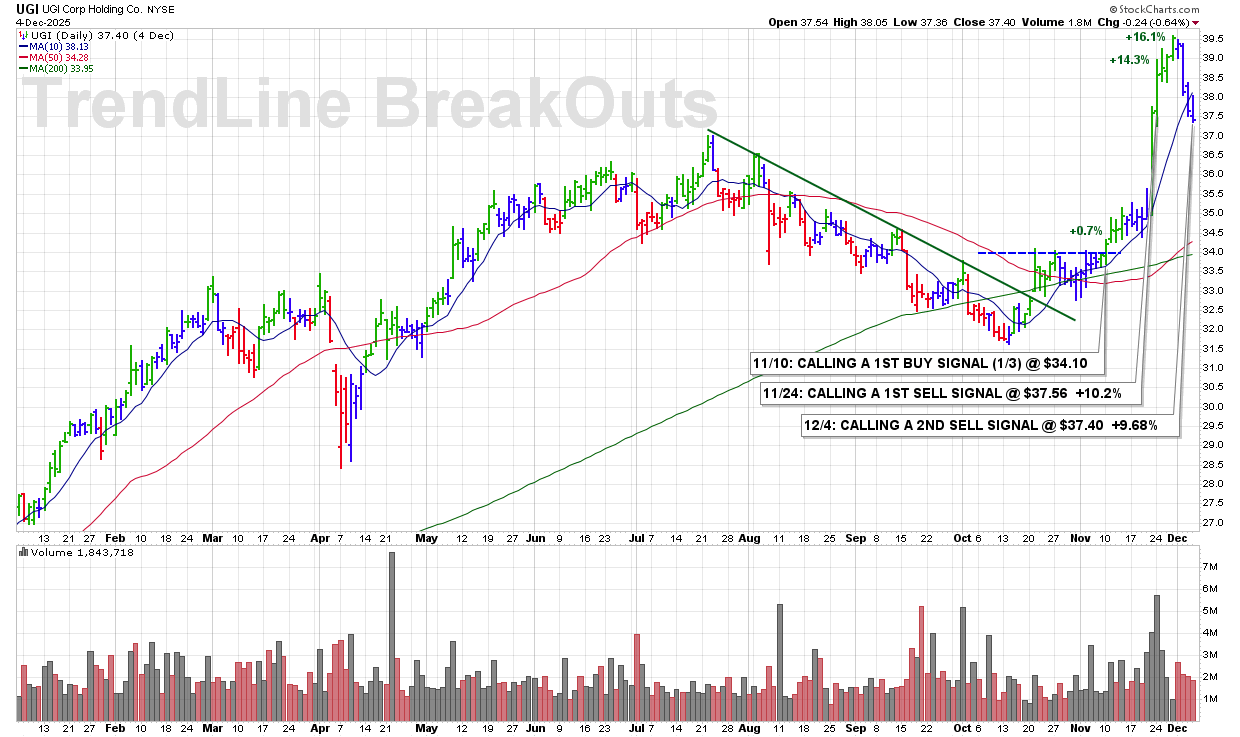
THU 12/4: UGI – CALLING A 2ND SELL SIGNAL @ $37.40 +9.7%

3:58 PM – Taking some more profits here as the stock breaks below its 10 DMA. Locking in gains while momentum shows early signs of weakening.

SELL SIGNALS:
11/24 (1/3) @ $37.56 +10.2%
12/4 (1/3) @ $37.40 +9.68%

ULTRA Trader’s Tip: Take Strength Before It Fades

  • A break below the 10 DMA is often the first indication momentum is shifting.

  • Taking profits into early weakness protects gains built on prior strength.

  • Reducing exposure keeps you disciplined and ready for cleaner opportunities.

CLICK/TAP CHART TO ZOOM
Chart services courtesy of stockcharts.com. Annotations by James Taulman.


James had served as Editor-in-Chief of the first independently licensed website to offer stock reports and services based on the CAN SLIM® investment system.

Since the late 1990s, he has been analyzing growth stocks and providing investor-focused research rooted in time-tested technical strategies. Over the years, James developed a strong ability to quickly and accurately identify high-ranked trading candidates using this proven approach.

He has worked with a wide range of investors — from professional money managers to individual traders — helping them apply this disciplined system in real-world markets.

James has delivered weekly market commentary as part of the “Your Money Matters” radio program, broadcast on both ABC and CBS radio networks, and for a time was a daily guest on the Investor’s Edge radio program.

Today, he is the developer and founder of U L T R A — a robust yet easy-to-use trading system built to identify and manage high-probability stock trades based on strict technical rules and real-time alerts.

MON 11/24: UGI – CALLING A 1ST SELL SIGNAL @ $37.56 +10.2%

10:03 AM – Calling a quick profit-taking SELL SIGNAL here as earnings volatility continues.

SELL SIGNAL:
11/24 @ $37.56 +10.2%

ULTRA Trader’s Tip: Take Profits Into Strength

  • Locking in gains when a stock extends quickly protects capital and confidence.

  • Strength during earnings volatility can fade fast — disciplined trims reduce risk.

  • Taking profits creates flexibility to rotate into stronger, higher-ranked opportunities.

CLICK/TAP CHART TO ZOOM
Chart services courtesy of stockcharts.com. Annotations by James Taulman.


James had served as Editor-in-Chief of the first independently licensed website to offer stock reports and services based on the CAN SLIM® investment system.

Since the late 1990s, he has been analyzing growth stocks and providing investor-focused research rooted in time-tested technical strategies. Over the years, James developed a strong ability to quickly and accurately identify high-ranked trading candidates using this proven approach.

He has worked with a wide range of investors — from professional money managers to individual traders — helping them apply this disciplined system in real-world markets.

James has delivered weekly market commentary as part of the “Your Money Matters” radio program, broadcast on both ABC and CBS radio networks, and for a time was a daily guest on the Investor’s Edge radio program.

Today, he is the developer and founder of U L T R A — a robust yet easy-to-use trading system built to identify and manage high-probability stock trades based on strict technical rules and real-time alerts.