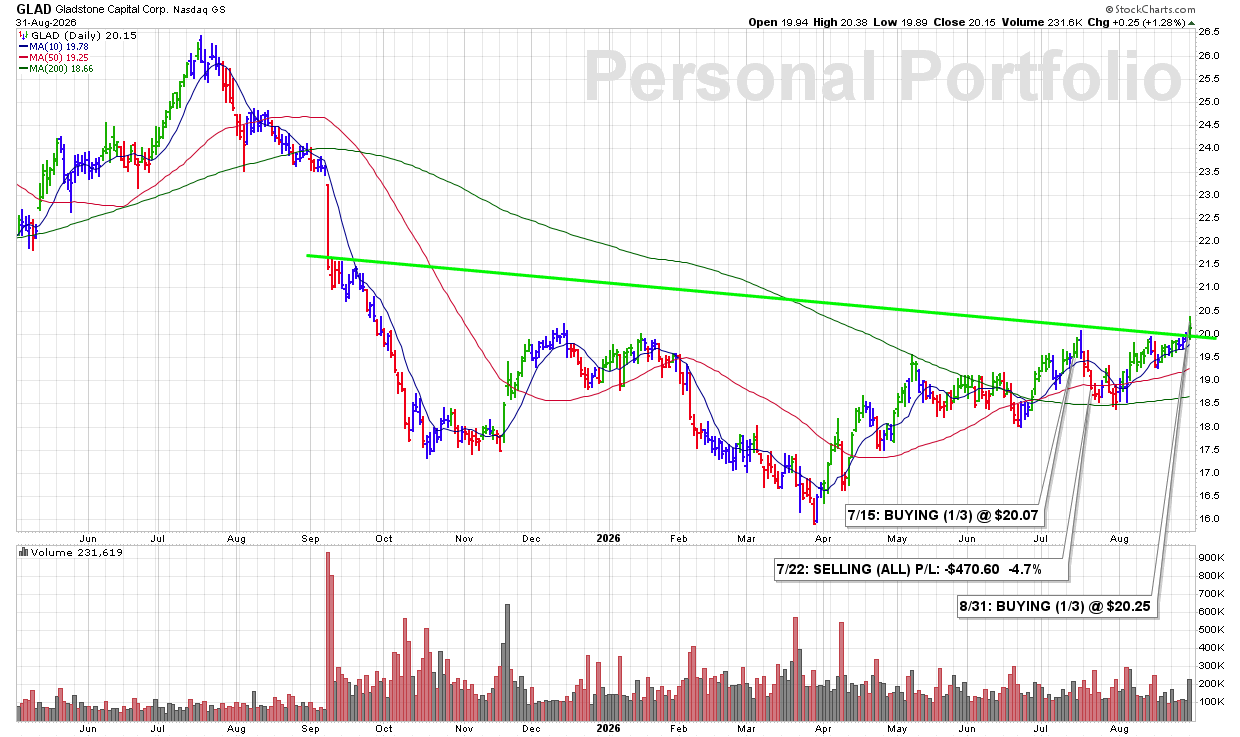
MON 8/31: GLAD – Just Starting to Break Out of a Downtrend as Volume Shows Some Conviction

3:38 PM – Starting a 1/3 position in this Finance-Investment Management company as shares begin to break out of their recent downtrend while volume runs 39% above average. The improving price action combined with increased volume gives me enough bullish technical evidence to initiate a starter position.
James’ Trader’s Tip: A Trend Change Needs Confirmation

  • Breaking out of a downtrend can signal an important change in the stock’s technical character.

  • Above-average volume strengthens the move by showing increased demand behind the breakout.

  • Starting with a 1/3 position lets us participate while requiring the stock to prove itself before committing additional capital.

CLICK/TAP CHART TO ZOOM
Chart services courtesy of stockcharts.com. Annotations by James Taulman.

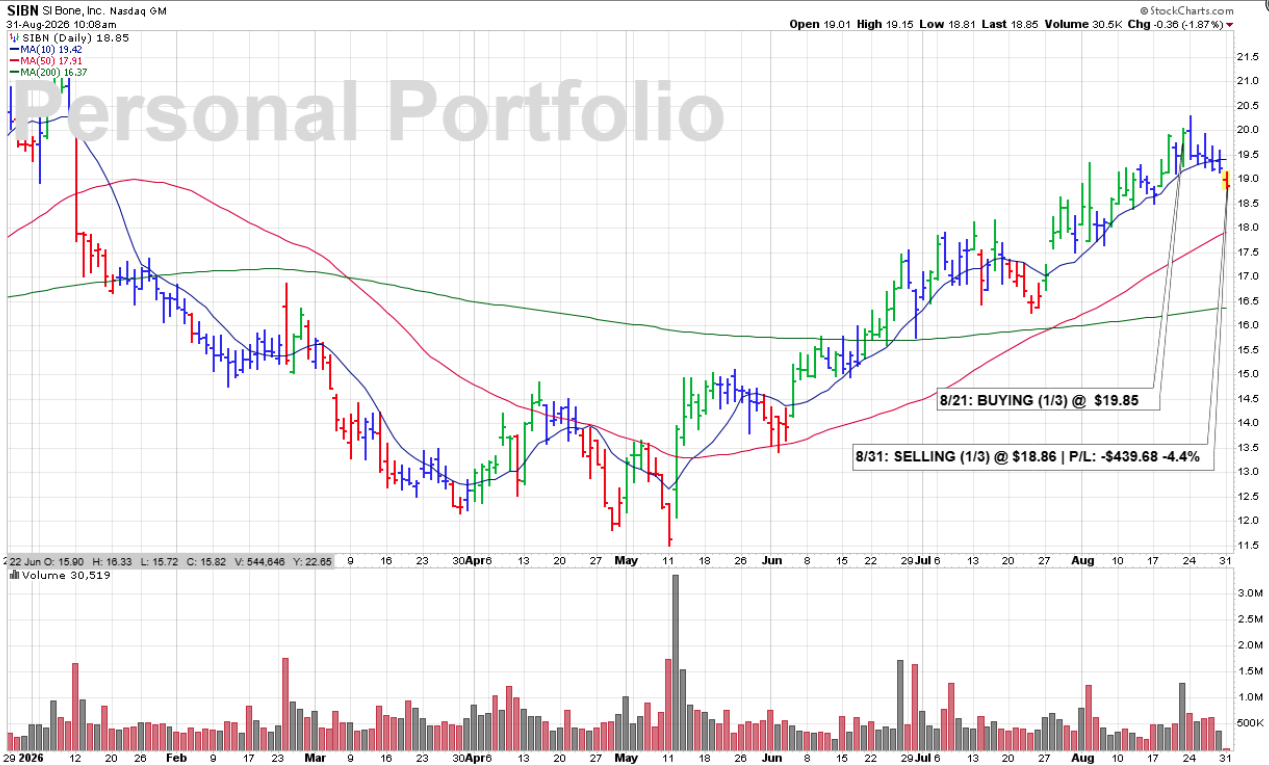
MON 8/31: SIBN – SELLING (ALL) @ $18.86 | P/L: -$439.68 -4.4%

10:01 AM – Selling the last of my SIBN position here this morning as shares have been forming a series of lower highs and have now clearly broken below their 10 DMA support. The developing downtrend combined with the loss of our key short-term support is enough bearish technical evidence for me to exit the position completely.

James’ Trader’s Tip: Lower Highs Warn of Deteriorating Strength

  • A series of lower highs can be an early indication that a stock is beginning to trend lower.

  • A subsequent break below the 10 DMA confirms that short-term support has weakened.

  • When multiple bearish signs begin stacking up, follow the technical evidence and protect capital.

CLICK/TAP CHART TO ZOOM
Chart services courtesy of stockcharts.com. Annotations by James Taulman.

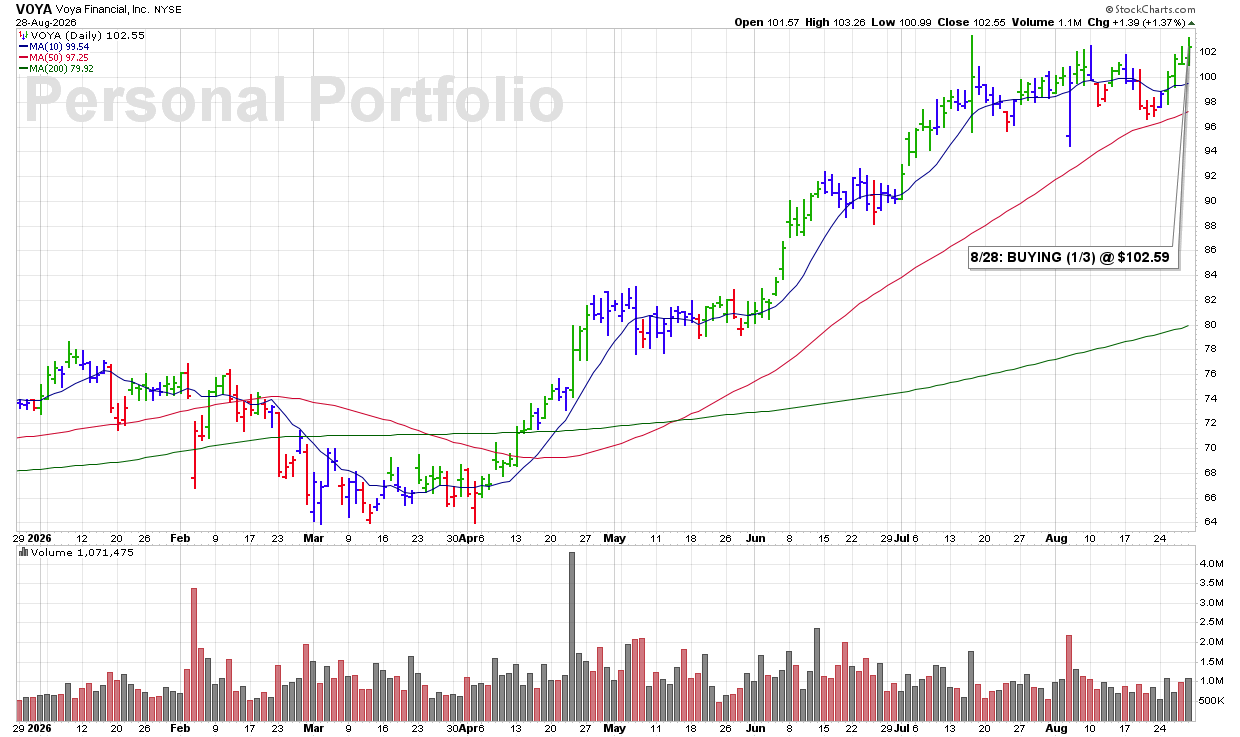
FRI 8/28: VOYA – BUYING (1/3) @ $102.59

3:40 PM – Picking up a 1/3 position in this Insurance leader as shares push toward new all-time highs while volume runs above average. The combination of strong price action near record highs and increased volume gives me enough bullish technical evidence to initiate a position.

James’ Trader’s Tip: New Highs Show Leadership

  • Stocks trading near all-time highs are demonstrating strong relative price action.

  • Increased volume adds confirmation that buyers are supporting the advance.

  • Starting with a 1/3 position allows us to participate while giving the stock room to further confirm its strength.

CLICK/TAP CHART TO ZOOM
Chart services courtesy of stockcharts.com. Annotations by James Taulman.

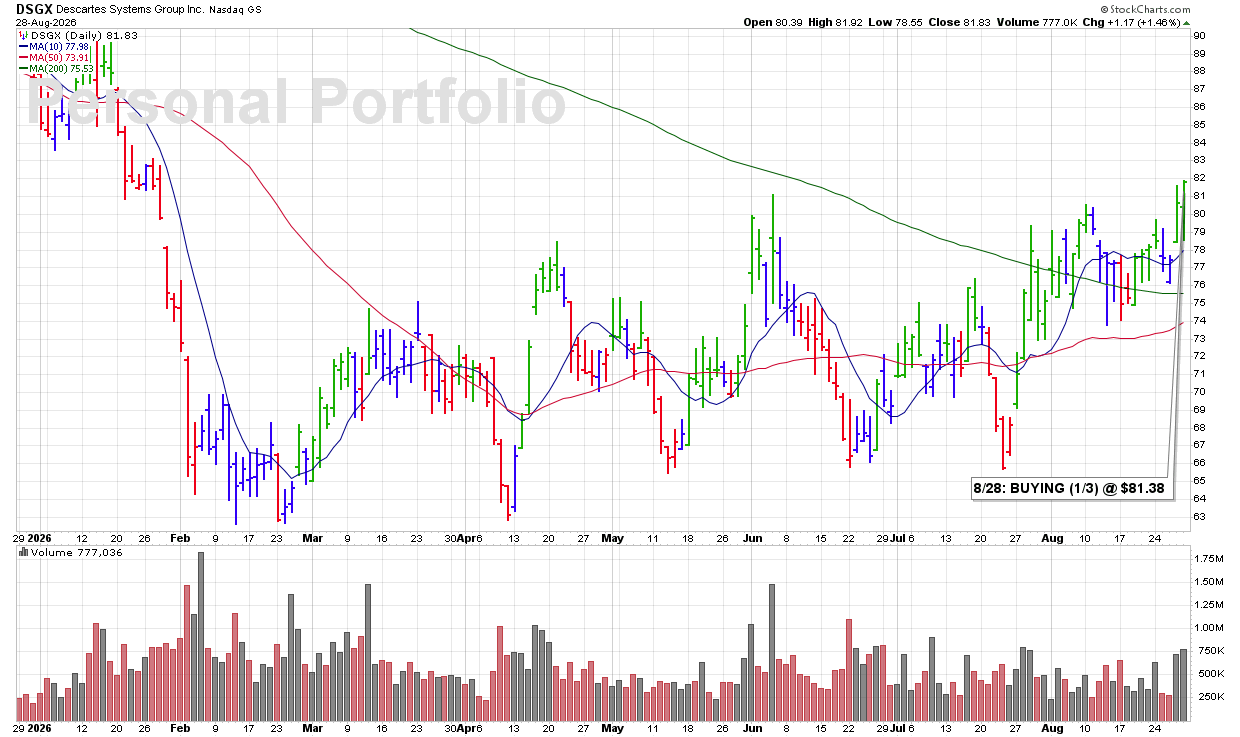
FRI 8/28: DSGX – BUYING (1/3) @ $81.38

3:40 PM – Starting a 1/3 position in this Computer Software-Specialty Enterprise company as shares shoot higher from near the 10 DMA and look to be closing at a new recent high above $81.00 with a solid increase in volume. The combination of support at the 10 DMA, a move to new recent highs, and increased volume gives me a technical BUY SIGNAL.

James’ Trader’s Tip: Strength Should Be Confirmed by Volume

  • An advance from near the 10 DMA shows that important short-term support is holding.

  • Moving into new recent highs demonstrates improving price strength.

  • Increased volume adds conviction by showing stronger demand behind the move.

CLICK/TAP CHART TO ZOOM
Chart services courtesy of stockcharts.com. Annotations by James Taulman.

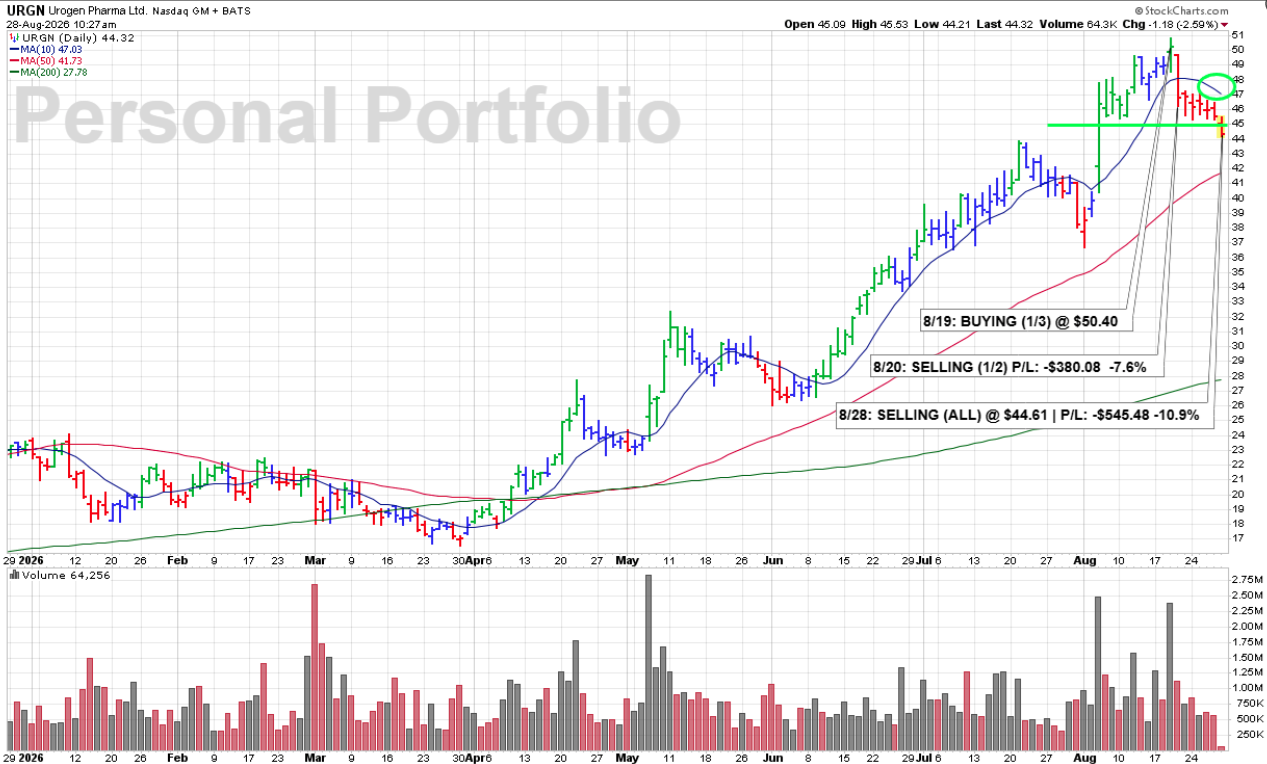
FRI 8/28: URGN – SELLING (ALL) @ $44.61 | P/L: -$545.48 -10.9%

9:44 AM – Selling the back half of my URGN position here this morning and exiting the stock completely. After first breaking below the 10 DMA on 8/20, which triggered our 1ST SELL SIGNAL, shares are now falling below the ROUND-$45 level while the 10 DMA continues to roll over. Those are additional bearish technical signs, and I’m not willing to ignore the continued deterioration.

James’ Trader’s Tip: Weakness Often Builds in Stages

  • The initial break below the 10 DMA was the first warning that short-term momentum had changed.

  • Losing the ROUND-$45 level adds another technical violation.

  • A rolling-over 10 DMA reinforces the bearish trend and supports getting completely out when weakness continues to build.

CLICK/TAP CHART TO ZOOM
Chart services courtesy of stockcharts.com. Annotations by James Taulman.

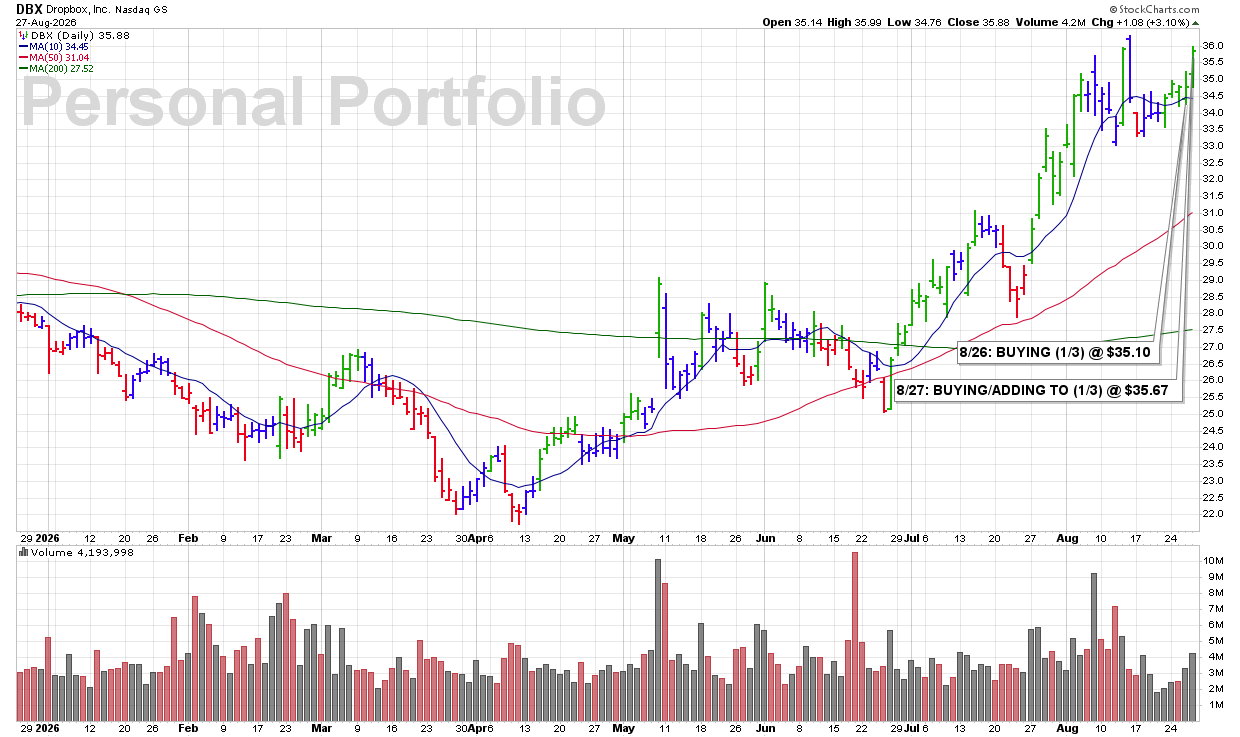
THU 8/27: DBX – BUYING/ADDING TO (1/3) @ $35.67

12:29 PM – Adding another 1/3 to my DBX position this afternoon as shares continue to show bullish technical action. The stock is pushing higher, although there is some near-term resistance at the ROUND-$36 level. A decisive move above $36 would provide additional bullish confirmation. This addition brings my total position to 2/3.

James’ Trader’s Tip: Add as the Stock Proves Itself

  • Scaling into a position allows the stock to demonstrate additional strength before committing more capital.

  • Nearby resistance gives us a clear technical level to monitor.

  • A strong break above the ROUND-$36 level would confirm that buyers are successfully overcoming that final small area of resistance.

CLICK/TAP CHART TO ZOOM
Chart services courtesy of stockcharts.com. Annotations by James Taulman.

WED 8/26: DBX – BUYING (1/3) @ $35.10

10:04 AM – Picking up a 1/3 position in this Computer Software-Database stock as shares trade higher from the 10 DMA while volume is currently running 38% above average. That combination of support at the 10 DMA, advancing price, and increased volume gives me a technical BUY SIGNAL.

James’ Trader’s Tip: Volume Helps Confirm Support

  • An advance from the 10 DMA shows that buyers are defending an important short-term support level.

  • Above-average volume adds conviction to the move by showing stronger-than-normal demand.

  • When price and volume improve together, the technical setup becomes more compelling.

CLICK/TAP CHART TO ZOOM
Chart services courtesy of stockcharts.com. Annotations by James Taulman.

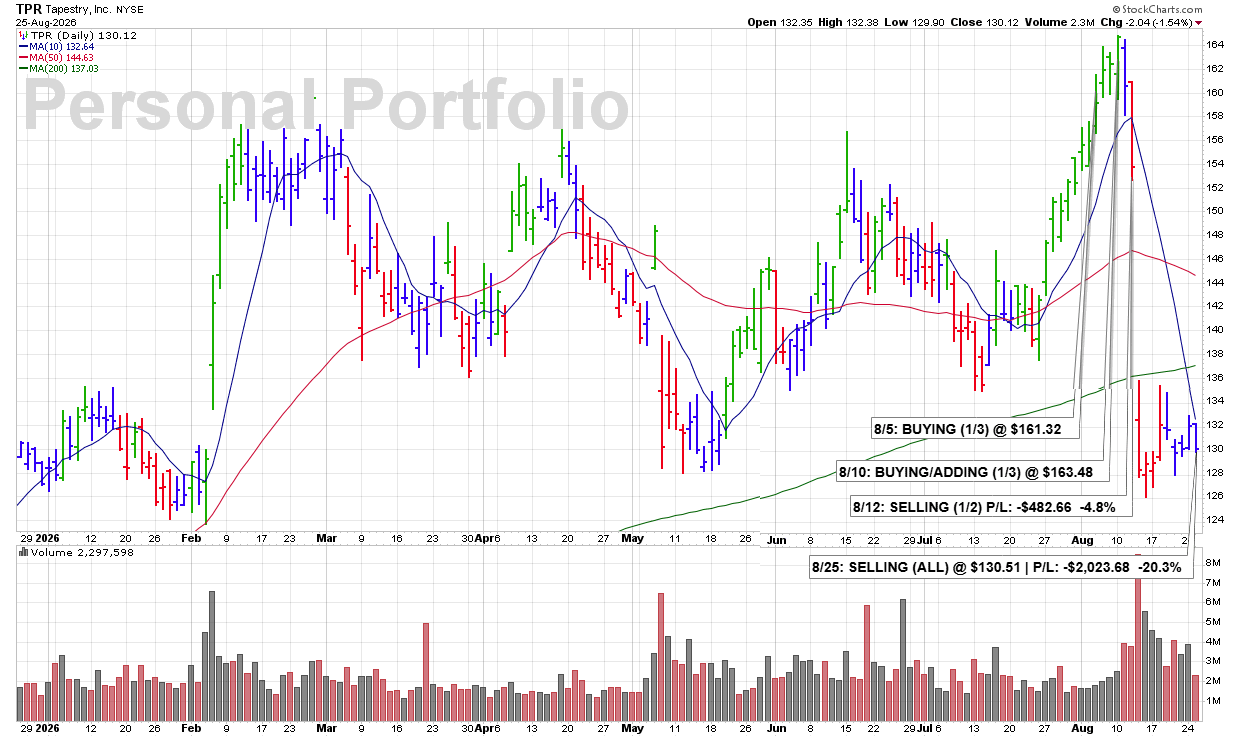
TUE 8/25: TPR – SELLING (ALL) @ $130.51 | P/L: -$2,023.68 -20.3%

3:34 PM – Selling all my TPR here after getting hit roughly 20% on earnings and seeing no meaningful recovery develop. Shares are currently being turned back from the 10 DMA, which is now the first level of resistance. Additional resistance sits just overhead at the 200 DMA near $132.64, followed by the ROUND-$140 level and then the 50 DMA near $144.63.

At this point, there is simply too much technical damage and too much overhead resistance. I would rather redeploy this capital into a fresh breakout or BUY SIGNAL showing substantially better technical conditions.

James’ Trader’s Tip: Capital Has an Opportunity Cost

  • A deeply damaged stock may require significant time just to work through multiple layers of overhead resistance.

  • Even if a recovery eventually develops, that capital may be tied up while stronger opportunities emerge elsewhere.

  • Sometimes the best decision is not waiting for a damaged position to recover—it is moving the money into a stock with a cleaner technical setup.

CLICK/TAP CHART TO ZOOM
Chart services courtesy of stockcharts.com. Annotations by James Taulman.

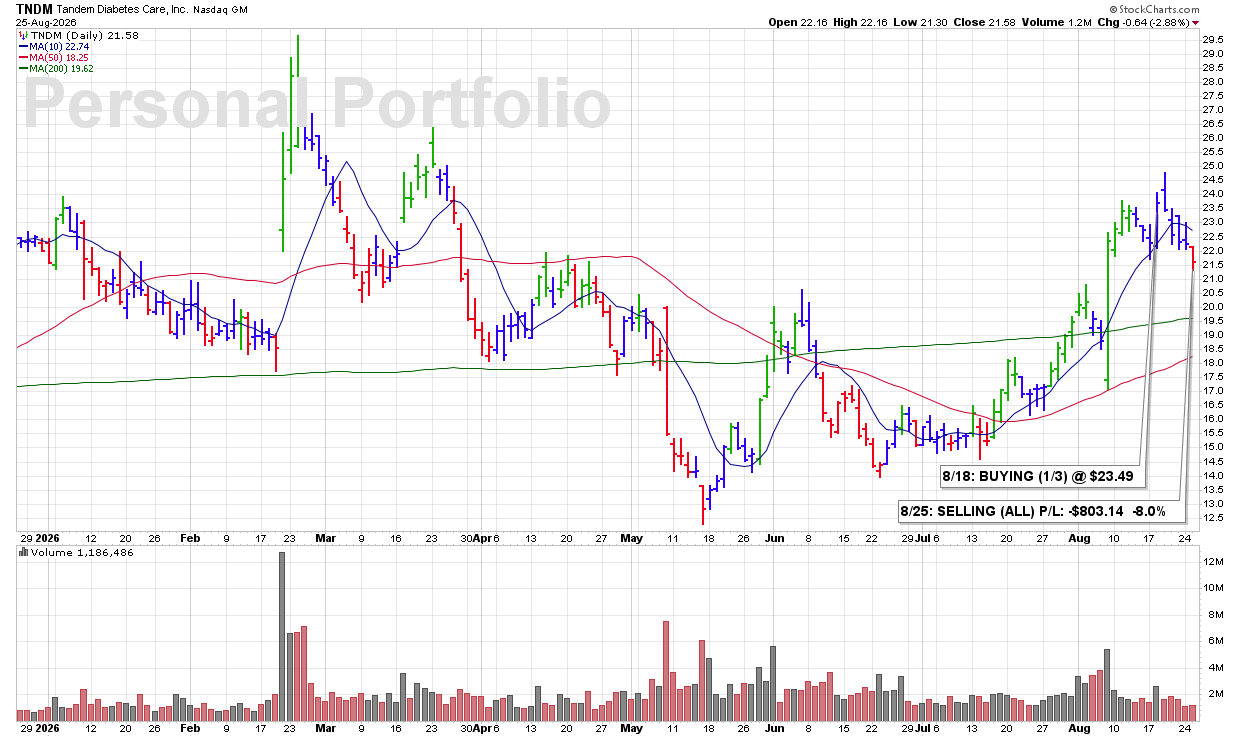
TUE 8/25: TNDM – SELLING (ALL) P/L: -$803.14 -8.0%

10:06 AM – Getting out of TNDM this morning as the technical picture continues to deteriorate. Shares have been (1) posting a series of lower highs, (2) making new recent lows, and (3) trading with the 10 DMA now clearly rolling over. At the same time, my loss has reached roughly 8%, which is about as far as I generally allow a position to move against me under my risk-management guidelines. I’m exiting here and protecting capital.

ULTRA Trader’s Tip: Respect Your Maximum Loss

  • Lower highs and new lows show that the stock is moving in the wrong direction.

  • A rolling-over 10 DMA confirms that short-term momentum is deteriorating.

  • Once a loss reaches your predetermined threshold, discipline matters more than hope—take the loss and move on.

CLICK/TAP CHART TO ZOOM
Chart services courtesy of stockcharts.com. Annotations by James Taulman.

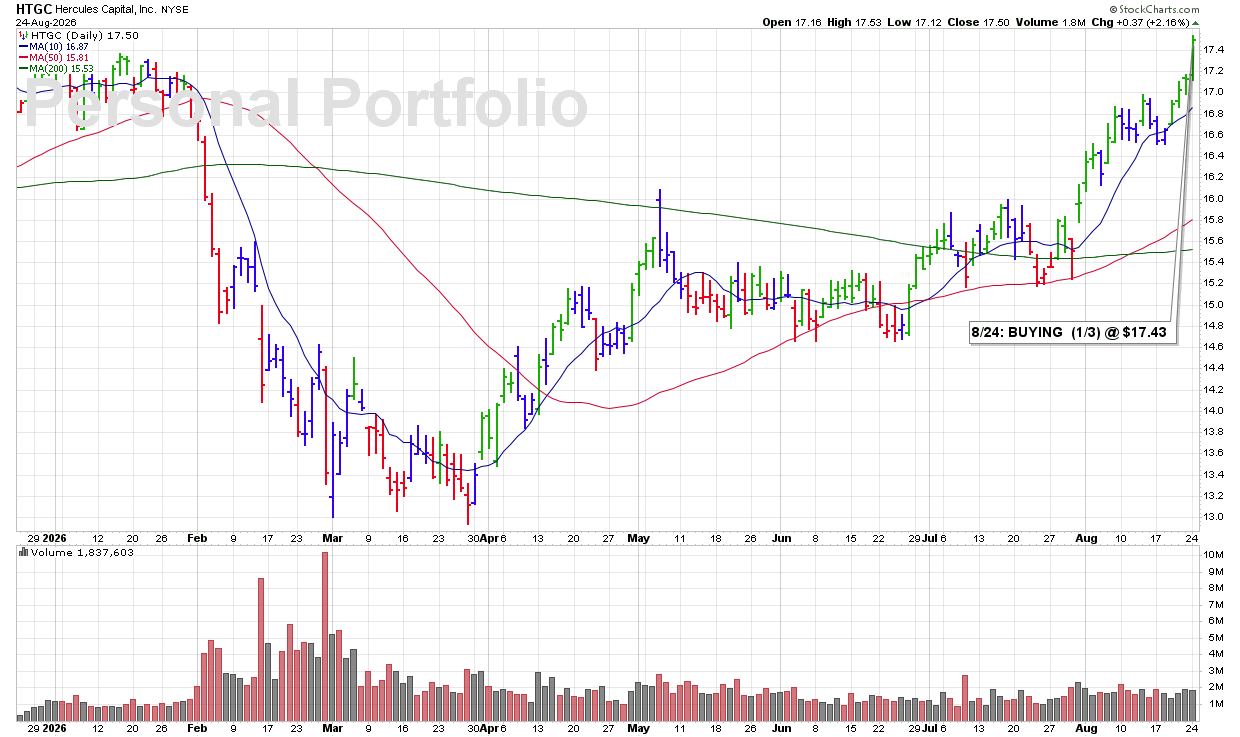
MON 8/24: HTGC – BUYING (1/3) @ $17.43

3:39 PM – Picking up a 1/3 position in this Finance-Investment Management company as shares trade higher from near the 10 DMA and break above previous highs near $17.35, while volume runs 21% above average. The combination of support at the 10 DMA, a move through previous resistance, and expanding volume represents the type of bullish technical action I look for in a BUY SIGNAL.

James’ Trader’s Tip: Look for Confirmation From Multiple Signals

  • Advancing from the 10 DMA shows that short-term support is holding.

  • Breaking above previous highs confirms that resistance is being cleared.

  • Above-average volume adds conviction to the move and strengthens the bullish technical evidence.

CLICK/TAP CHART TO ZOOM
Chart services courtesy of stockcharts.com. Annotations by James Taulman.

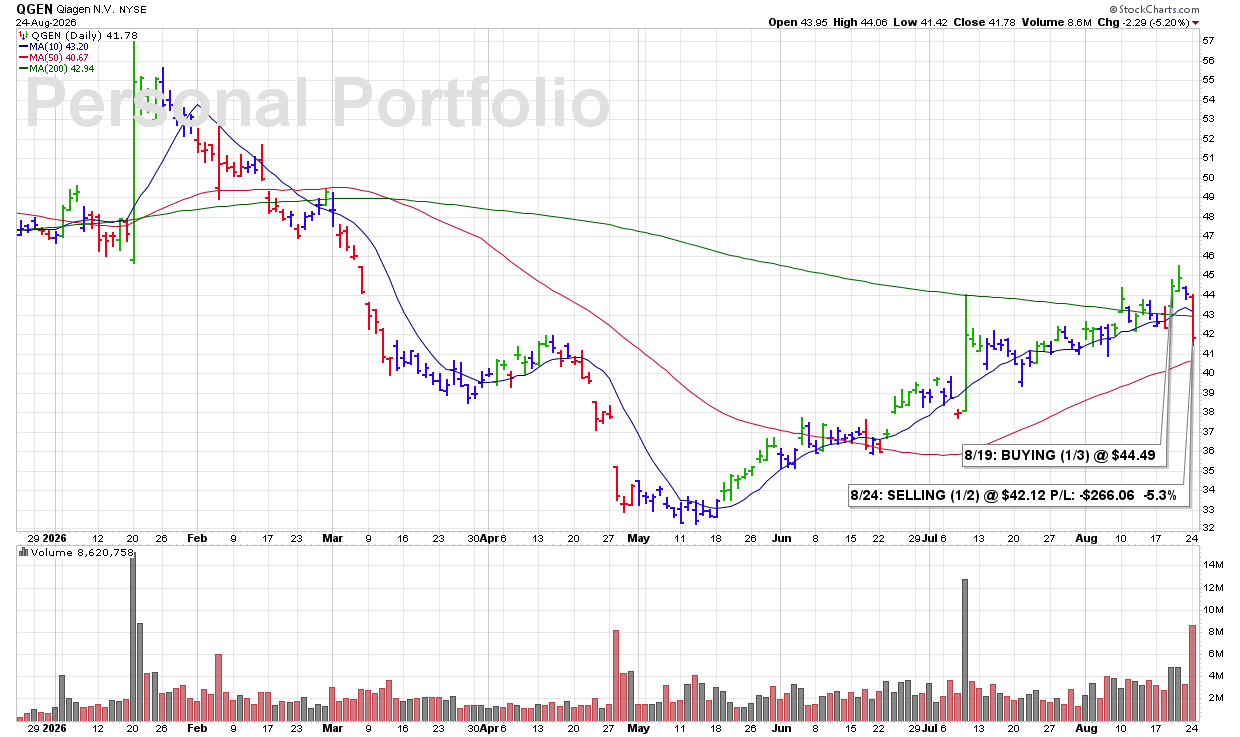
MON 8/24: QGEN – SELLING (1/2) @ $42.12 P/L: -$266.06 -5.3%

3:27 PM – Selling half my QGEN position here as shares break below the 10 DMA while volume runs 177% above average. That combination of a key support violation and extremely heavy selling volume represents bearish technical action I cannot ignore, so I’m reducing the position here.

James’ Trader’s Tip: Heavy Volume Makes Weakness More Meaningful

  • A break below the 10 DMA is already a technical warning.

  • When that break occurs on dramatically increased volume, it suggests much stronger selling pressure.

  • Reducing exposure quickly when price and volume both turn bearish helps keep risk under control.

CLICK/TAP CHART TO ZOOM
Chart services courtesy of stockcharts.com. Annotations by James Taulman.

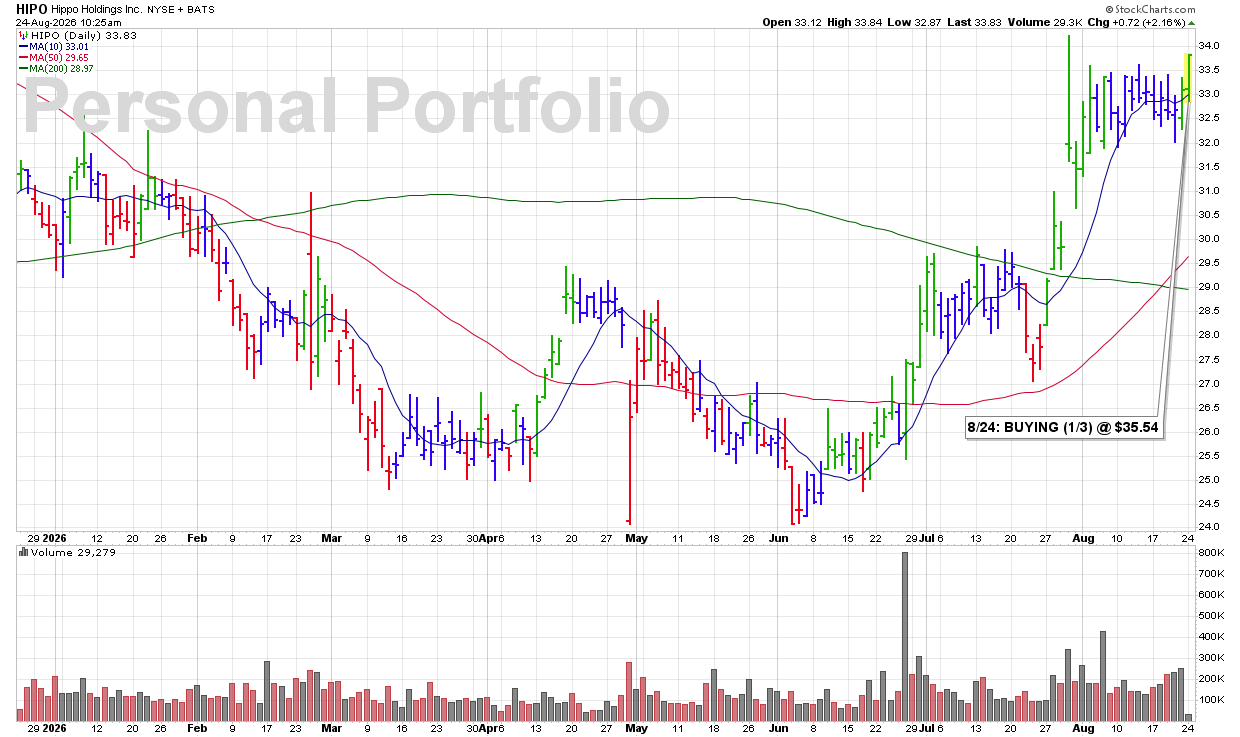
MON 8/24: HIPO – BUYING (1/3) @ $35.54

10:15 AM – Starting a 1/3 position in this insurance stock as shares trade higher from the 10 DMA, break above recent highs near $33.00, and do so with volume currently running 143% above average. That combination of support, breakout strength, and sharply expanding volume gives us a strong technical BUY SIGNAL.

James’ Trader’s Tip: Breakouts Are Stronger When Volume Confirms

  • Advancing from the 10 DMA shows that short-term support is holding.

  • Clearing recent highs confirms that resistance is being overcome.

  • When the breakout comes with a 143% increase in volume, the move carries significantly more technical conviction.

CLICK/TAP CHART TO ZOOM
Chart services courtesy of stockcharts.com. Annotations by James Taulman.

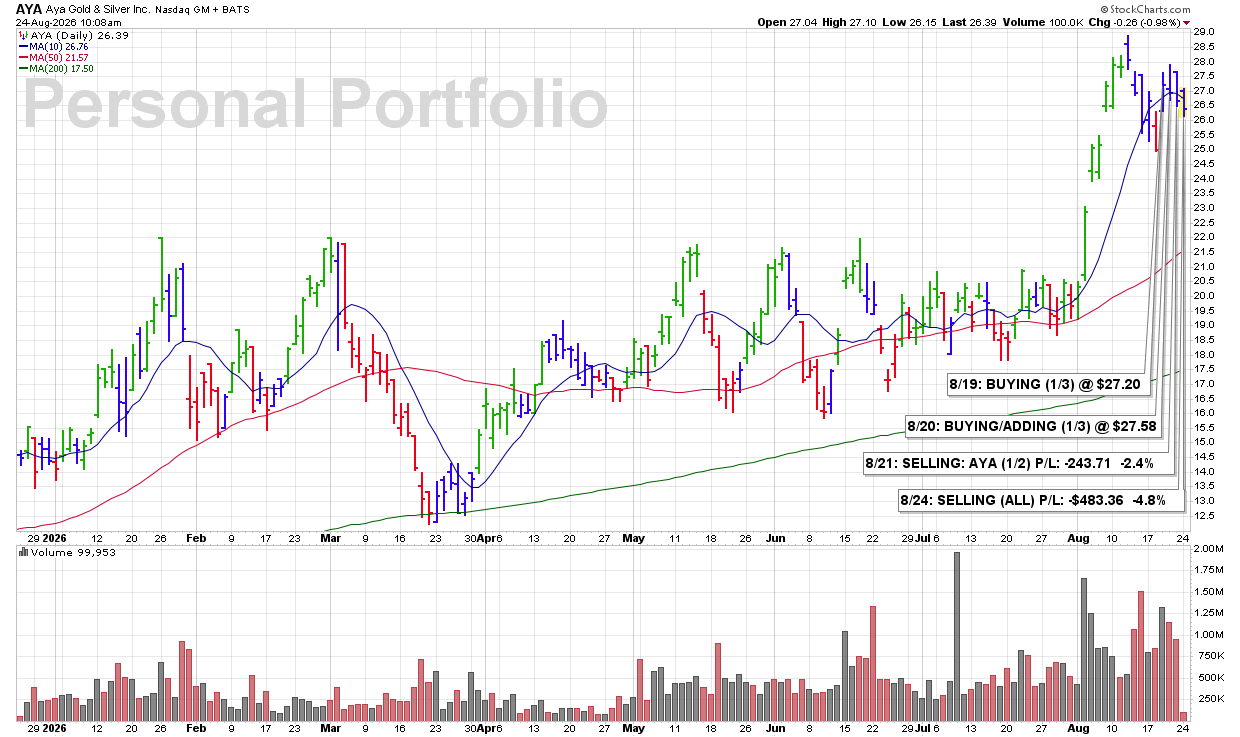
MON 8/24: AYA – SELLING (ALL) P/L: -$483.36 -4.8%

10:03 AM – Selling my remaining 1/2 position in AYA as the stock continues to exhibit bearish technical action. Today’s move is essentially another turnback from the 10 DMA, with shares printing new recent lows while trading lower on increased volume. With multiple signs of weakness continuing to stack up, I’m fully exiting the position here.

James’ Trader’s Tip: Ongoing Weakness Is a Sell Signal

  • Repeated rejection at the 10 DMA shows that former support has become resistance.

  • New recent lows confirm that downside pressure remains in control.

  • When bearish price action continues on increasing volume, the technical evidence is telling you to reduce exposure.

CLICK/TAP CHART TO ZOOM
Chart services courtesy of stockcharts.com. Annotations by James Taulman.

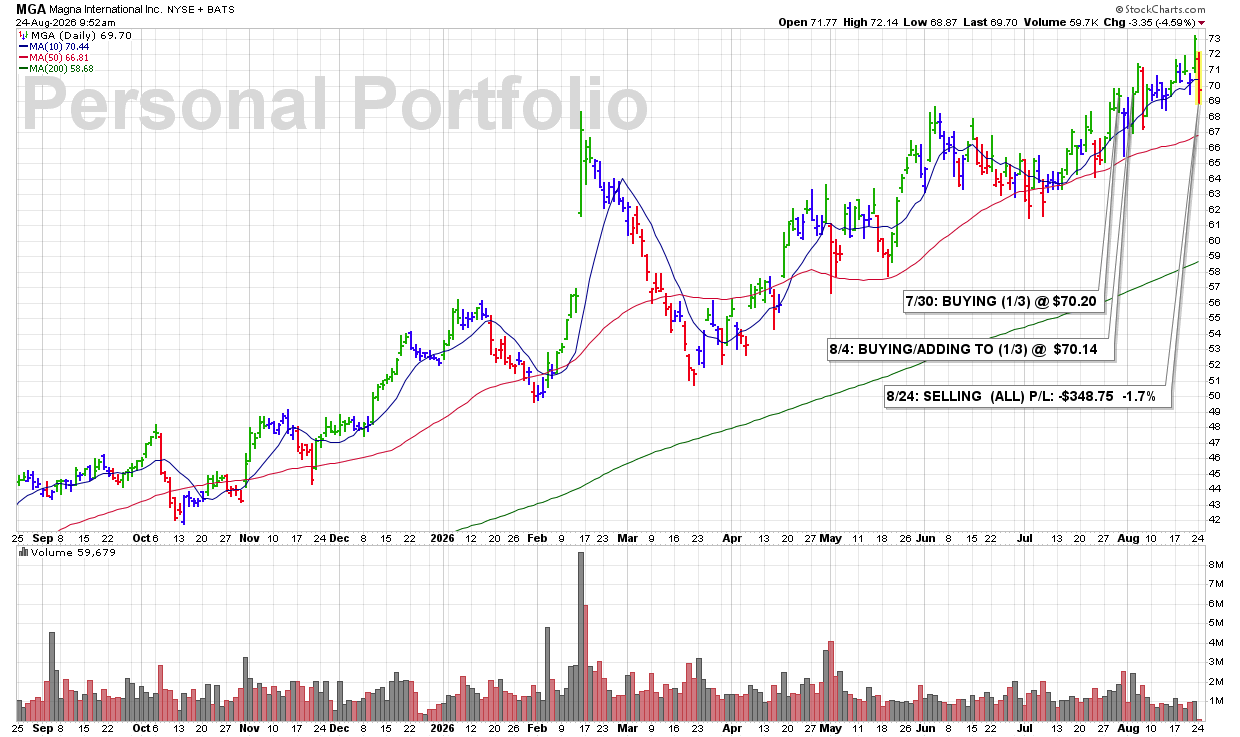
MON 8/24: MGA – SELLING (ALL) P/L: -$348.75 -1.7%

9:41 AM – Selling all my MGA shares quickly this morning as the stock sells off sharply on a huge increase in volume and breaks below the ROUND-$70 support level. The combination of heavy selling pressure, a key support violation, and expanding volume is enough technical deterioration for me to exit the position and move on.

James’ Trader’s Tip: Sharp Selling on Heavy Volume Demands Action

  • A break below a key support level is already a technical warning.

  • When that break comes with a major increase in volume, the signal becomes much more meaningful.

  • Heavy-volume weakness should be respected quickly before a manageable loss has the chance to become something larger.

CLICK/TAP CHART TO ZOOM
Chart services courtesy of stockcharts.com. Annotations by James Taulman.

FRI 8/21: GPN – SELLING (ALL) P/L: +$840.87 +16.6%

3:55 PM – Selling the remainder of my GPN position as we head into the close. Shares are trading higher this afternoon, but volume is running below average, which takes some conviction out of the move. With a solid +16.6% gain still intact, I’m locking in the rest of the profit and moving on.

James’ Trader’s Tip: Price Strength Is Better When Volume Confirms It

  • A stock can move higher on light volume, but the move carries less technical conviction.

  • When volume fails to confirm a price advance, it can be a good opportunity to protect profits.

  • Strong gains are worth protecting—especially when the technical evidence begins to lose some strength.

CLICK/TAP CHART TO ZOOM
Chart services courtesy of stockcharts.com. Annotations by James Taulman.

FRI 8/21: SIBN – BUYING (1/3) @ $19.85

3:43 PM – Starting a 1/3 position in this Medical-Systems company as shares blast higher from the 10 DMA to new recent highs while volume runs 127% above the normal daily rate. That combination of price strength and sharply expanding volume gives us a strong technical BUY SIGNAL. A close above the ROUND-$20 level would add even more bullish technical significance to the move.

James’ Trader’s Tip: Strong Volume Adds Conviction

  • Advancing from the 10 DMA shows that key short-term support is holding.

  • New recent highs confirm improving price strength.

  • When volume expands by more than 100%, the move deserves attention because it signals unusually strong demand.

CLICK/TAP CHART TO ZOOM
Chart services courtesy of stockcharts.com. Annotations by James Taulman.

FRI 8/21: AYA – SELLING (1/2) P/L: -$243.71 -2.4%

3:38 PM – Selling half of my AYA position here before the close as shares fall below the 10 DMA on a 38% increase in volume. That combination of a key support violation and heavier selling volume is bearish technical action I do not want to ignore, so I’m reducing exposure here.

James’ Trader’s Tip: Reduce Risk When Price and Volume Turn Bearish

  • A break below the 10 DMA is an important technical warning.

  • Increased volume on the decline gives the weakness more significance.

  • Selling part of the position allows you to reduce risk while still leaving room for the stock to recover.

CLICK/TAP CHART TO ZOOM
Chart services courtesy of stockcharts.com. Annotations by James Taulman.

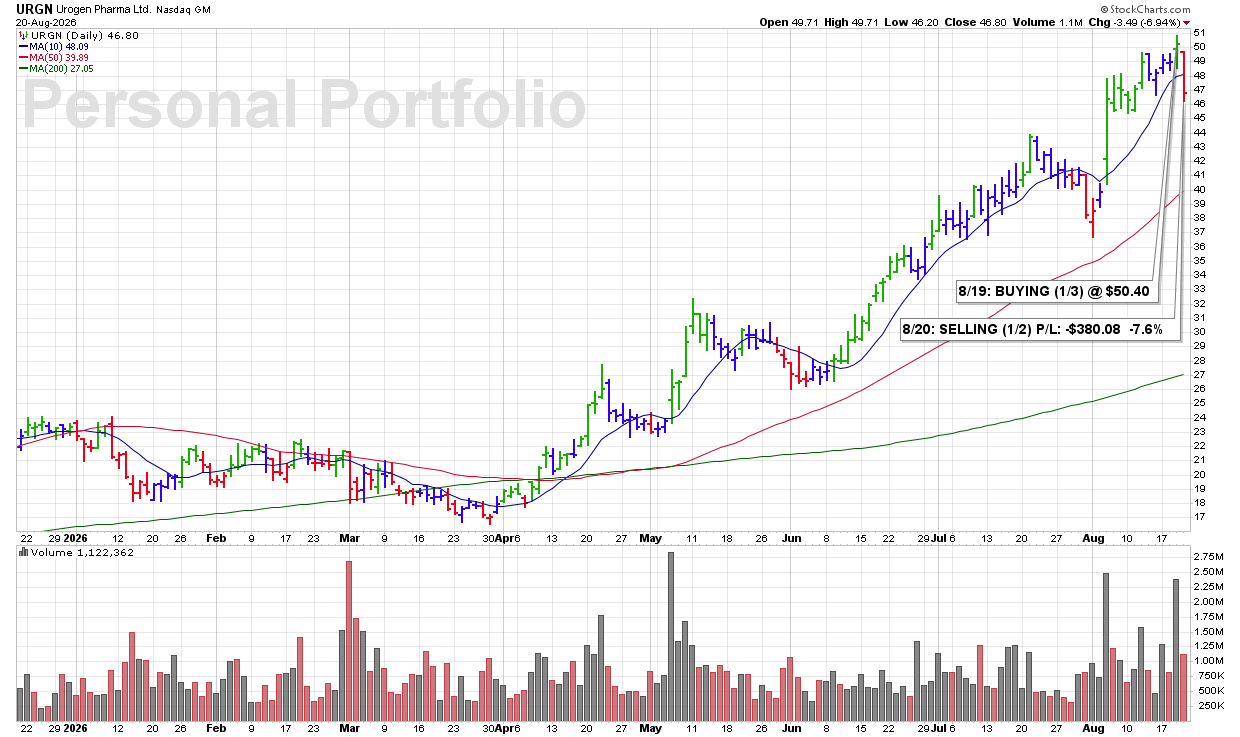
THU 8/20: URGN – SELLING (1/2) P/L: -$380.08 -7.6%

3:44 PM – Selling half of my URGN position here as shares have clearly broken below their 10 DMA support. That is a technical violation and a SELL SIGNAL under our rules. I’m reducing the position here rather than ignoring the weakness.

James’ Trader’s Tip: Respect the Technical Violation

  • A clear break below the 10 DMA tells us that important short-term support has failed.

  • Once a stock violates a key technical level, the rules—not hope—should determine our response.

  • Selling part of the position immediately reduces risk while giving the remaining shares an opportunity to recover.

CLICK/TAP CHART TO ZOOM
Chart services courtesy of stockcharts.com. Annotations by James Taulman.

THU 8/20: ECPG – SELLING (1/2) P/L: -$249.34 -4.9%

3:44 PM – Selling half of my ECPG position here as shares gap lower and break below the 10 DMA. That loss of our key short-term support is a clear technical violation and a SELL SIGNAL under our rules.

James’ Trader’s Tip: Respect the 10 DMA

  • The 10 DMA is our primary technical indicator for identifying changes in short-term price strength.

  • A decisive break below the line signals that the stock’s technical condition is weakening.

  • Scaling out allows us to reduce risk immediately while leaving part of the position in place if the stock recovers.

CLICK/TAP CHART TO ZOOM
Chart services courtesy of stockcharts.com. Annotations by James Taulman.

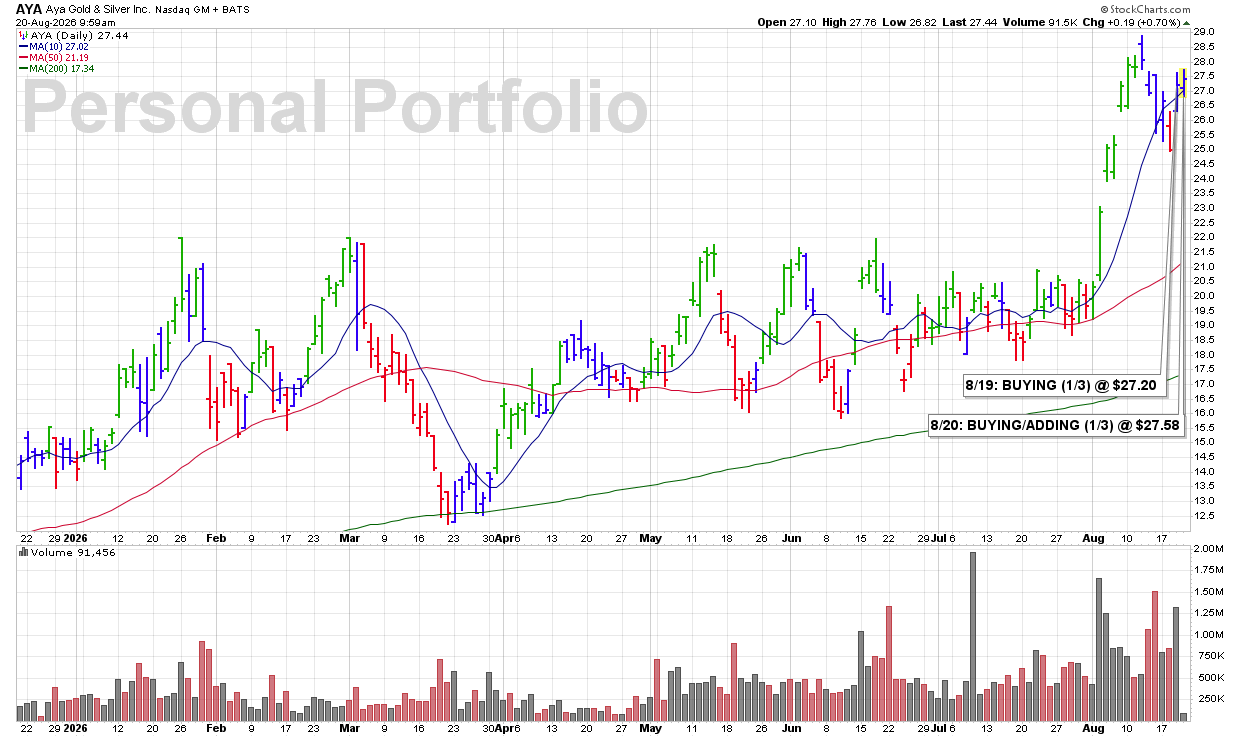
THU 8/20: AYA – BUYING/ADDING (1/3) @ $27.58

9:40 AM – Adding another 1/3 to my position in this gold-related stock this morning as shares advance from near the 10 DMA. The stock is continuing to show bullish support at this key technical level, giving me enough confirmation to increase my position to 2/3.

James’ Trader’s Tip: Add When the Stock Confirms Your Trade

  • Starting with 1/3 keeps initial risk controlled.

  • When the stock continues to respect the 10 DMA and advances, it provides additional technical confirmation.

  • Scaling into strength allows the stock to earn additional capital rather than committing a full position all at once.

CLICK/TAP CHART TO ZOOM
Chart services courtesy of stockcharts.com. Annotations by James Taulman.

WED 8/19: AYA – BUYING (1/3) @ $27.20

3:57 PM – Picking up a 1/3 position in this gold-mining stock as gold-related names show noticeable strength this afternoon, and I’m looking to participate in that move. AYA shares are advancing from the 10 DMA on a 76% increase in volume. That combination of support at the 10 DMA, rising price, and sharply expanding volume is one of my standard technical BUY SIGNALS.

James’ Trader’s Tip: Follow the Price-and-Volume Evidence

  • An advance from the 10 DMA shows that an important technical support level is holding.

  • A 76% increase in volume adds significant confirmation that demand is strengthening.

  • When price and volume align this clearly, pay attention—the stock is telling you something.

CLICK/TAP CHART TO ZOOM
Chart services courtesy of stockcharts.com. Annotations by James Taulman.

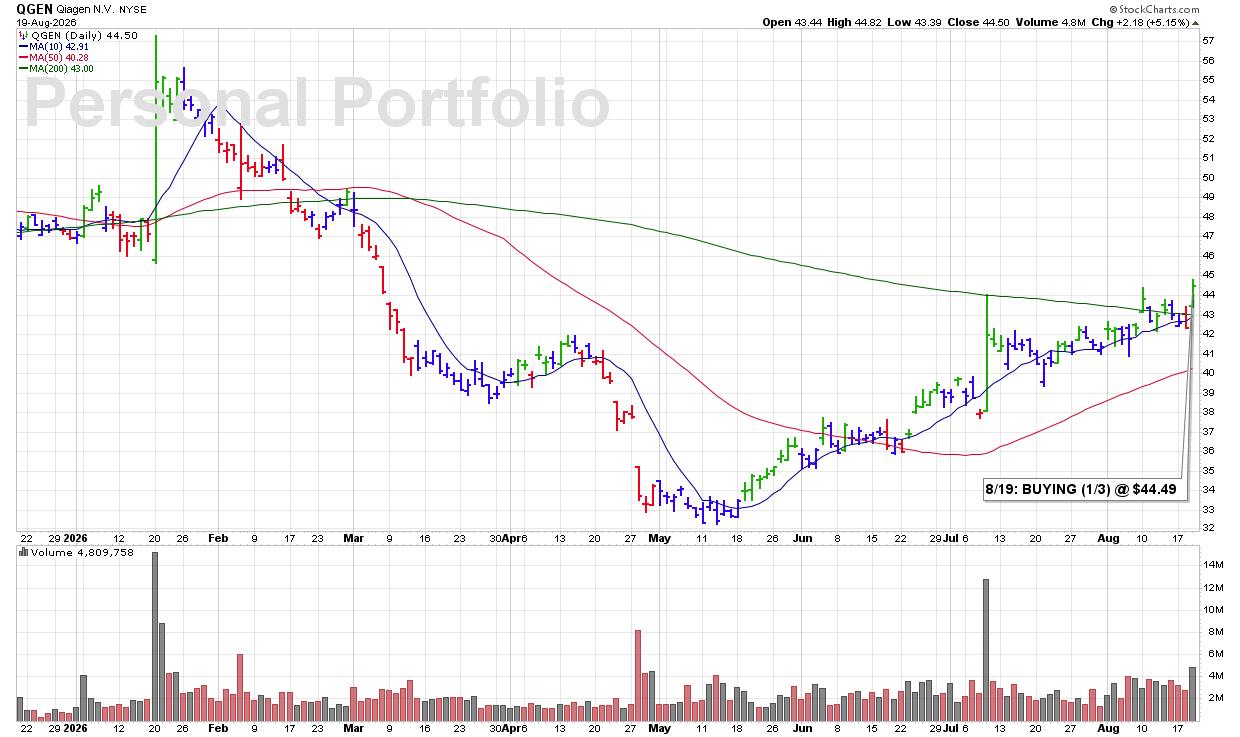
WED 8/19: QGEN – BUYING (1/3) @ $44.49

3:55 PM – Starting a 1/3 position in this Medical-Products leader as shares advance from near the 10 DMA on an 80% increase in volume. The stock is also breaking above some recent previous highs, adding further bullish technical confirmation. A decisive move above the ROUND-$45 level would be even more constructive.

James’ Trader’s Tip: Look for Multiple Signs of Strength

  • Advancing from the 10 DMA provides the initial bullish technical signal.

  • Sharply increased volume confirms stronger buying demand behind the move.

  • Breaking above previous highs adds another layer of confirmation and increases the probability that a new advance may be developing.

CLICK/TAP CHART TO ZOOM
Chart services courtesy of stockcharts.com. Annotations by James Taulman.

WED 8/19: URGN – BUYING (1/3) @ $50.40

3:44 PM – Initiating a 1/3 position in this Biotech stock near the close as shares display several bullish technical characteristics: (1) trading higher from near the 10 DMA, (2) breaking out above the ROUND-$50 level, and (3) trading on a massive 200% increase in volume. I cannot ignore this combination of bullish price-and-volume action, so I’m taking an initial position here.

James’ Trader’s Tip: When the Evidence Stacks Up, Pay Attention

  • Advancing from the 10 DMA provides an initial sign of technical strength.

  • Breaking through a key resistance level adds further confirmation.

  • When those signals are accompanied by a massive increase in volume, the stock is clearly demanding attention.

CLICK/TAP CHART TO ZOOM
Chart services courtesy of stockcharts.com. Annotations by James Taulman.

TUE 8/18: TNDM – BUYING (1/3) @ $23.49

3:31 PM – Picking up a 1/3 position in this Medical-Products company as shares advance from the 10 DMA on a 24% increase in daily volume. The stock also appears capable of closing above the previous high near $23.80, which would provide another bullish technical confirmation.

There has not been much to choose from recently as both the market and individual stocks have remained relatively quiet during this mid-summer stretch following the peak of earnings season. TNDM stands out as one of the more promising opportunities currently showing the type of price-and-volume action that could produce some upside potential.

James’ Trader’s Tip: Selectivity Matters in Quiet Markets

  • When fewer stocks are producing quality technical signals, there is no reason to force trades.

  • Focus on the names that continue to show clear support, improving volume, and bullish price action.

  • Quiet markets reward patience—and make the strongest individual opportunities stand out even more.

CLICK/TAP CHART TO ZOOM
Chart services courtesy of stockcharts.com. Annotations by James Taulman.

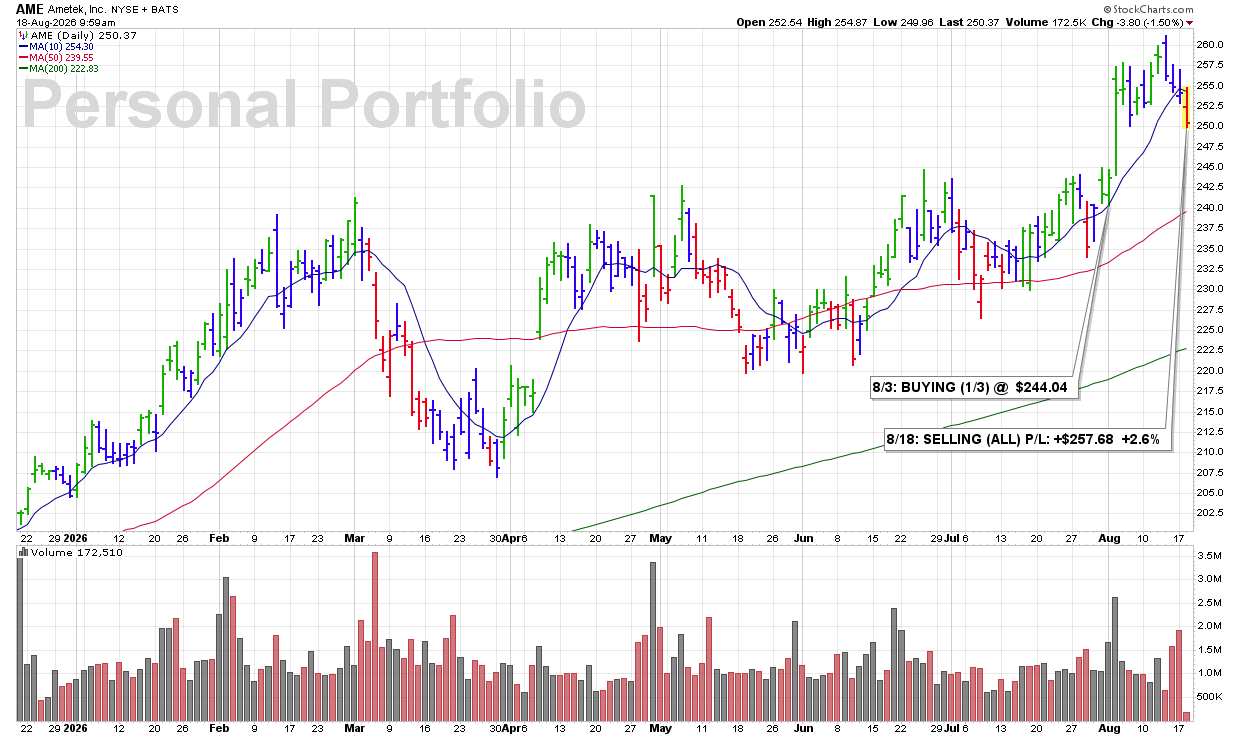
TUE 8/18: AME – SELLING (ALL) P/L: +$257.68 +2.6%

9:56 AM – Selling all my AME shares this morning as the stock is clearly breaking below the 10 DMA. That loss of short-term support is a technical violation, and with a modest profit still intact, I’m locking in the gain and moving on.

James’ Trader’s Tip: Protect Even Small Profits

  • A profit does not have to be large to be worth protecting.

  • When a stock breaks a key support level like the 10 DMA, the technical picture has changed.

  • Taking a small gain and freeing up capital is better than allowing a winning trade to turn into a loss.

CLICK/TAP CHART TO ZOOM
Chart services courtesy of stockcharts.com. Annotations by James Taulman.

TUE 8/18: NDSN – SELLING (ALL) P/L: -$76.33 -0.76%

9:56 AM – Selling all of my NDSN here this morning as shares have been developing a series of lower highs and are now clearly breaking below the 10 DMA. With bearish technical action continuing to build, I’m taking this very small loss and moving on rather than waiting for possible additional deterioration.

James’ Trader’s Tip: Small Losses Are Part of the System

  • Not every BUY SIGNAL will develop into a winning trade.

  • When the technical evidence changes, there is no reason to stay committed to the original decision.

  • Taking a small loss quickly keeps capital available for the next opportunity and prevents an insignificant loss from becoming significant.

CLICK/TAP CHART TO ZOOM
Chart services courtesy of stockcharts.com. Annotations by James Taulman.

FRI 8/14: ECPG – BUYING (1/3) @ $102.93

10:04 AM – Starting a 1/3 position in this Financial Services-Specialty stock this morning as shares trade higher above the ROUND-$100 level on an increase in volume. This is the type of bullish price-and-volume action I cannot ignore. Let the stock tell you what to do—and then have the discipline to listen.

James’ Trader’s Tip: Let the Stock Make the Decision

  • A move above a key round-number level can signal that resistance is being cleared.

  • Increasing volume adds confirmation that stronger buying demand is supporting the advance.

  • The goal is not to predict what a stock should do. Watch the price and volume action, then respond to what it is actually doing.

CLICK/TAP CHART TO ZOOM
Chart services courtesy of stockcharts.com. Annotations by James Taulman.

THU 8/13: GPN – SELLING (1/2) P/L: +$879.92 +17.5%

3:29 PM – Selling half my GPN position here as shares have made a solid price advance, but volume is running only around the daily average. At the same time, price has become extended from the 10 DMA, currently at $87.52. I’m locking in some decent +17.5% profits here while continuing to hold the remaining half of my position.

James’ Trader’s Tip: Take Some Profits Into Strength

  • A strong price advance can provide an opportunity to lock in gains before any technical weakness develops.

  • When price becomes extended from the 10 DMA, the probability of a normal pullback toward that line increases.

  • Selling part of a winning position allows you to bank profits while maintaining exposure if the stock continues higher.

CLICK/TAP CHART TO ZOOM
Chart services courtesy of stockcharts.com. Annotations by James Taulman.

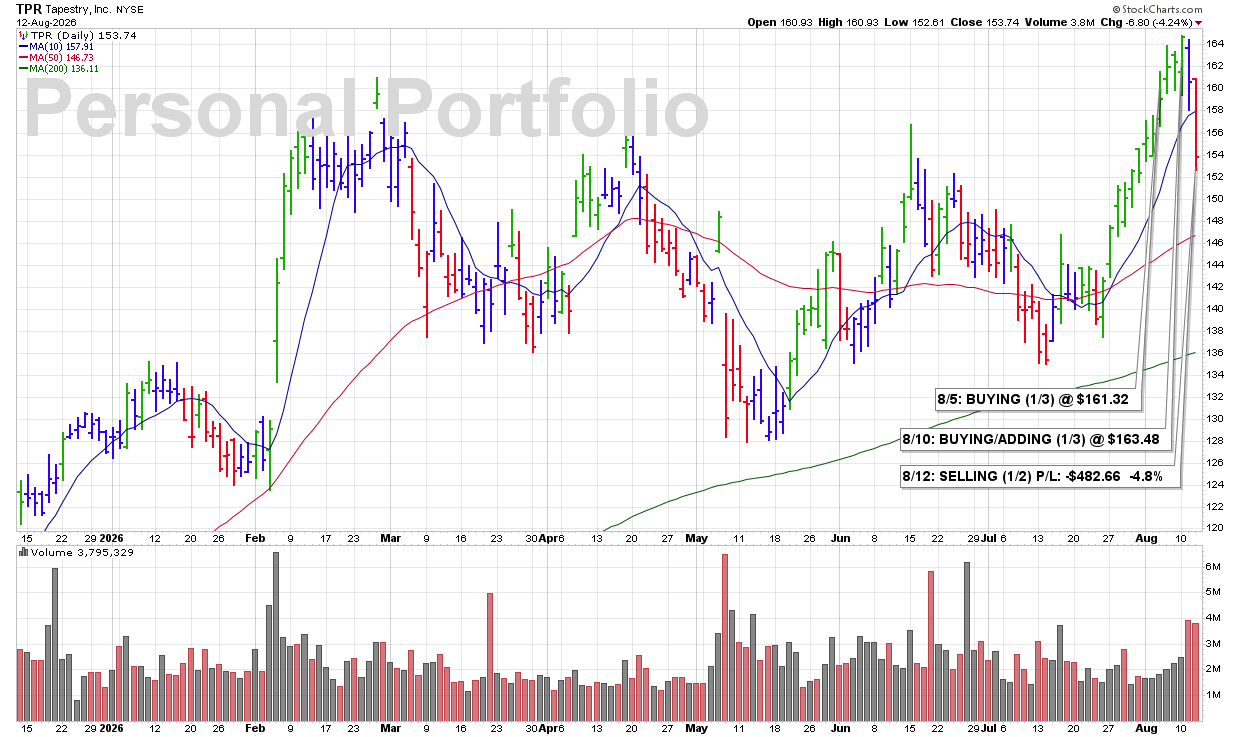
WED 8/12: TPR – SELLING (1/2) P/L: -$482.66 -4.8%

3:46 PM – Selling half of my 2/3 position here as shares break below the 10 DMA. The exception here is that the company is scheduled to report earnings tomorrow morning, so today’s weakness may at least partially be influenced by the upcoming announcement. I’m reducing my risk ahead of the report, but after having some recent success with earnings plays, I’m willing to accept the added risk and hold the remaining 1/3 position through tomorrow morning’s announcement.

James’ Trader’s Tip: Reduce Risk Without Eliminating Opportunity

  • A break below the 10 DMA is a technical violation and should not simply be ignored because earnings are approaching.

  • Earnings can produce significant gaps in either direction, making position size especially important.

  • Selling half allows you to reduce exposure while maintaining a smaller position if you deliberately choose to accept the overnight earnings risk.

CLICK/TAP CHART TO ZOOM
Chart services courtesy of stockcharts.com. Annotations by James Taulman.

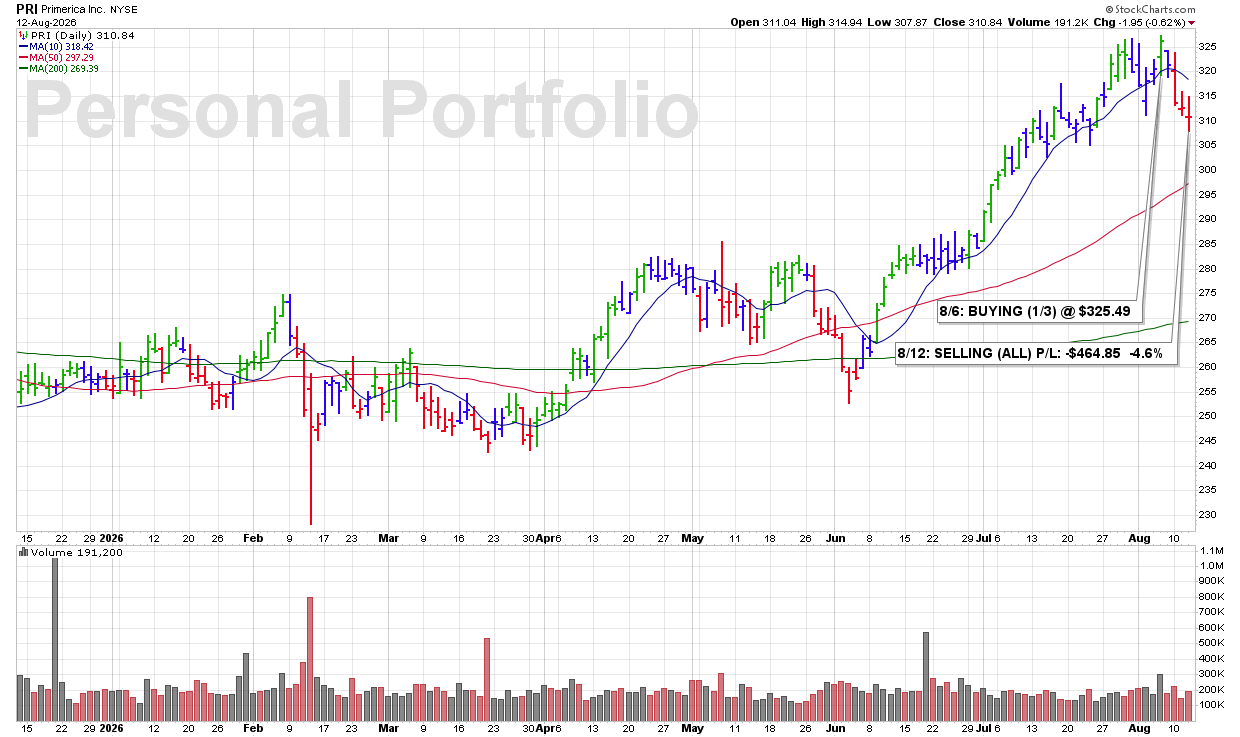
WED 8/12: PRI – SELLING (ALL) P/L: -$464.85 -4.6%

3:34 PM – Selling all my PRI shares as we head into today’s close. After Monday’s break below the 10 DMA, the stock has continued to exhibit bearish technical action, and the loss is now approaching my acceptable threshold. Rather than allow additional weakness to develop, I’m exiting the position and protecting capital.

James’ Trader’s Tip: Know Your Loss Threshold

  • A technical violation such as a break below the 10 DMA is an early warning that momentum may be deteriorating.

  • When weakness continues and the loss begins approaching your predetermined limit, discipline becomes more important than hope.

  • Taking a manageable loss protects both capital and flexibility for the next stronger opportunity.

CLICK/TAP CHART TO ZOOM
Chart services courtesy of stockcharts.com. Annotations by James Taulman.

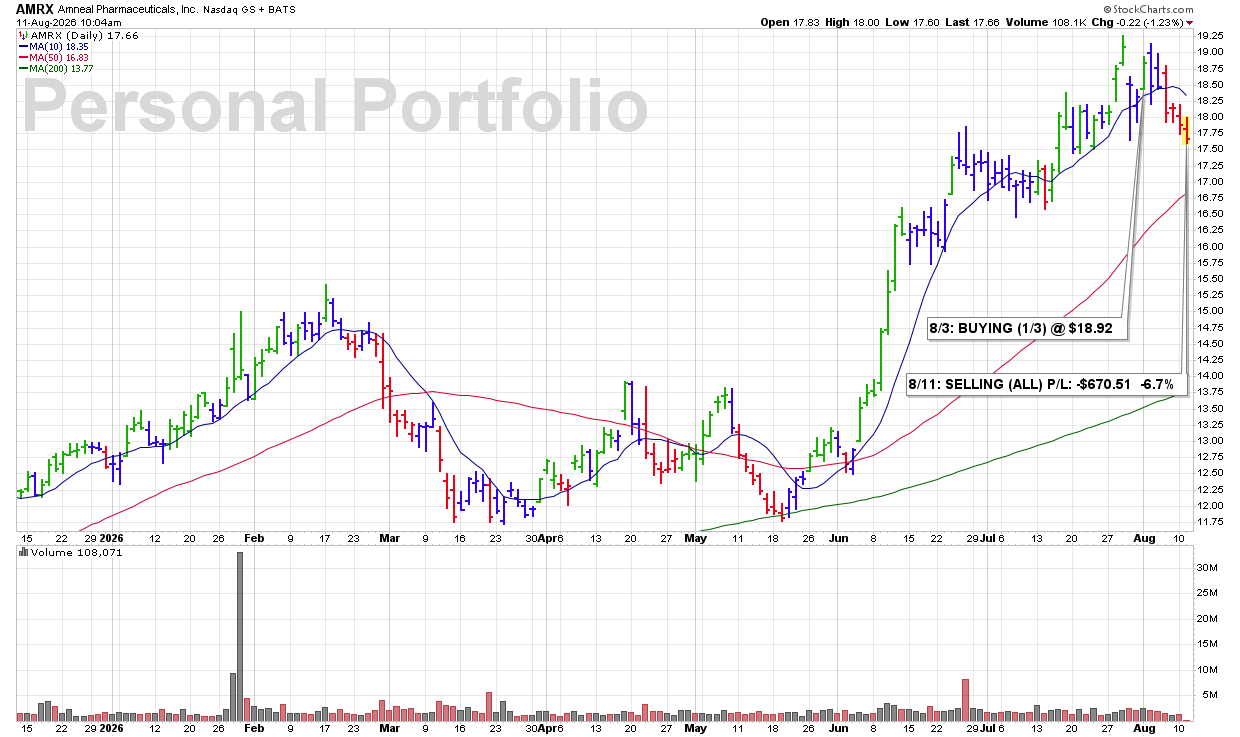
TUE 8/11: AMRX – SELLING (ALL) P/L: -$670.51 -6.7%

9:58 AM – Selling all my AMRX shares this morning, and here’s why. The stock recently broke below its 10 DMA, which was the first technical violation. It then fell below our noted ROUND-$18 support, and shares are continuing lower this morning while the 10 DMA is now clearly rolling over. With multiple signs of technical deterioration stacking up, I’m exiting the position and moving on.

James’ Trader’s Tip: Ongoing Technical Weakness Is a Signal

  • A break below the 10 DMA is often the first warning that momentum is deteriorating.

  • Losing additional support levels confirms that the weakness is continuing—not improving.

  • When the 10 DMA begins rolling over while price continues lower, the stock is telling you the technical trend is weakening. Listen to it.

CLICK/TAP CHART TO ZOOM
Chart services courtesy of stockcharts.com. Annotations by James Taulman.

MON 8/10: TPR – BUYING/ADDING (1/3) @ $163.48

3:35 PM – Adding a second 1/3 position to TPR as we head into today’s close, bringing my total position to 2/3. Shares are showing renewed bullish action with volume-backed gains from the ROUND-$160 support level, and the stock appears set to close near the session high—possibly at a new all-time high close.

James’ Trader’s Tip: Add When Strength Is Confirmed

  • A successful bounce from a key support level shows that buyers are stepping back in.

  • Volume-backed gains add conviction to the move and help confirm the technical strength.

  • Scaling from 1/3 to 2/3 allows us to increase exposure only after the stock begins proving the original trade correct.

CLICK/TAP CHART TO ZOOM
Chart services courtesy of stockcharts.com. Annotations by James Taulman.

MON 8/10: MCK – BUYING (1/3) @ $892.55

9:58 AM – Initiating a 1/3 position in this Medical-Distribution leader as shares trade higher from the 10 DMA on what is currently running at approximately twice normal daily trading volume. The combination of support at the 10 DMA, advancing price, and sharply increased volume represents the type of bullish technical action I consider a BUY SIGNAL.

James’ Trader’s Tip: Volume Adds Conviction to a Move

  • A stock advancing from the 10 DMA shows that this key technical level is acting as support.

  • When that move occurs on sharply increased volume, it signals stronger-than-normal buying demand.

  • Price strength combined with expanding volume provides greater confirmation than price movement alone.

CLICK/TAP CHART TO ZOOM
Chart services courtesy of stockcharts.com. Annotations by James Taulman.

THU 8/6: PRI – BUYING (1/3) @ $325.49

3:47 PM – Starting a 1/3 position in this insurance leader as we head into today’s close. Shares found support at the 10 DMA, are trading higher, and appear set to close at a new all-time high while volume runs 52% above average. That combination of strong price action, support at the 10 DMA, and expanding volume gives me a technical BUY SIGNAL.

James’ Trader’s Tip: New Highs Should Be Supported by Volume

  • A move to new highs confirms that the stock is demonstrating superior relative strength.

  • Above-average volume adds conviction by showing increased demand behind the advance.

  • When a stock rebounds from the 10 DMA and pushes into new highs on expanding volume, the technical evidence is distinctly bullish.

CLICK/TAP CHART TO ZOOM
Chart services courtesy of stockcharts.com. Annotations by James Taulman.

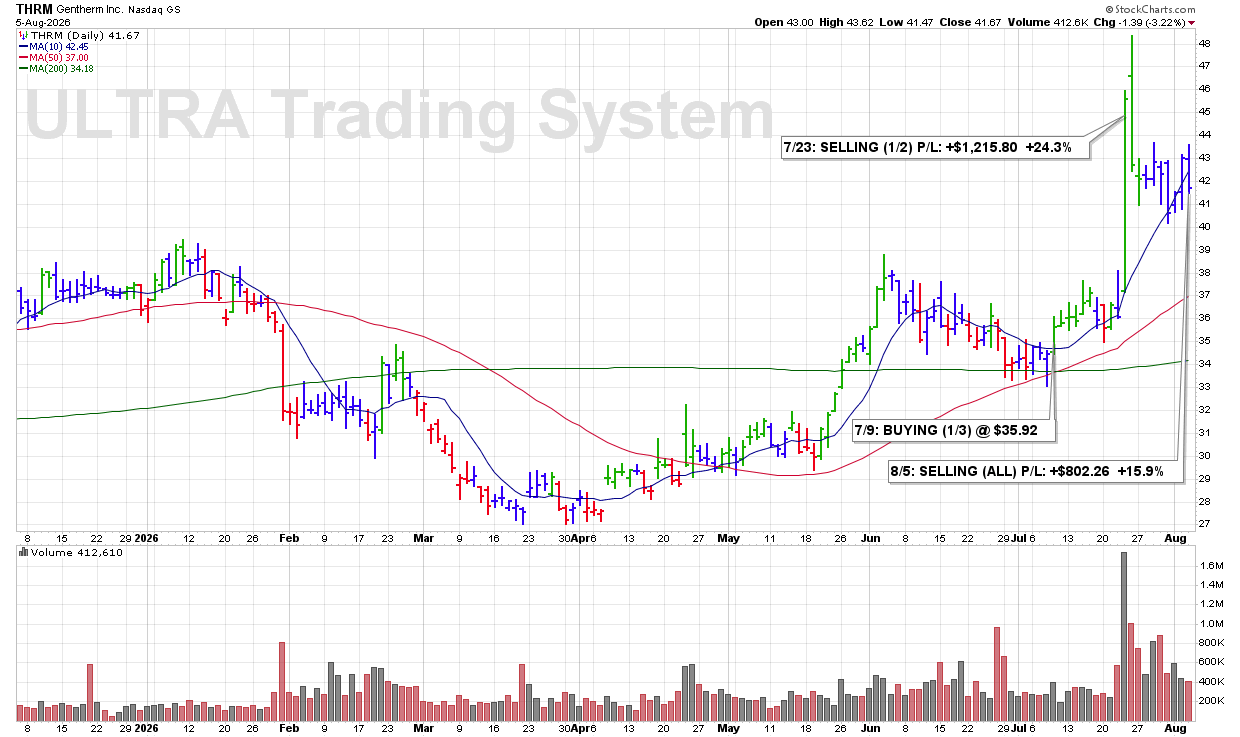
WED 8/5: THRM — Selling All for a Solid Profit +16%

3:44 PM – Selling all of my THRM position here and locking in a solid +15.9% profit. The trade worked well, and I’m taking the gain and moving the capital on to the next opportunity.

James’ Trader’s Tip: Take the Profit When the Trade Has Worked

  • Not every exit needs to come after a major technical breakdown.

  • A strong gain gives you the flexibility to lock in profits and redeploy capital elsewhere.

  • Protecting realized gains is just as important as finding the next BUY SIGNAL

CLICK/TAP CHART TO ZOOM
Chart services courtesy of stockcharts.com. Annotations by James Taulman.

WED 8/5: TPR – BUYING (1/3) @ $161.32

10:14 AM – Starting a 1/3 position in this Apparel-Clothing & Shoes leader from our Traditional BreakOuts Watch List as shares trade to new highs this morning on what, at the time of purchase, is above-average volume. The combination of a breakout to new highs and expanding volume gives us a technical BUY SIGNAL.

James’ Trader’s Tip: Buy Strength, Then Let It Prove Itself

  • New highs show that the stock has cleared prior price resistance.

  • Above-average volume adds confirmation that meaningful demand is supporting the breakout.

  • Starting with a 1/3 position allows the stock to prove the move before additional capital is committed.

CLICK/TAP CHART TO ZOOM
Chart services courtesy of stockcharts.com. Annotations by James Taulman.

TUE 8/4: ITGR – SELLING (ALL) P/L: +$2,383.43 +23.9%

1:48 PM – Selling all my ITGR shares here after learning the company is being acquired for approximately $127.00 per share. With the stock now trading around the announced buyout value, I’m locking in this strong +23.9% gain and moving on.

James’ Trader’s Tip: Take the Win When the Catalyst Changes

  • A buyout can quickly change the technical setup and limit the stock’s remaining upside.

  • Once the primary move has been captured, there is little reason to keep capital tied up waiting for a small additional gain.

  • Locking in a strong profit and redeploying that capital into a fresh opportunity keeps the portfolio working.

CLICK/TAP CHART TO ZOOM
Chart services courtesy of stockcharts.com. Annotations by James Taulman.

TUE 8/4: CBZ – SELLING (ALL) P/L: +$2,524.08 +24.4%

1:48 PM – Selling all my CBZ shares after the stock recently gapped sharply higher on buyout news. I’m taking these windfall profits here, locking in a strong +24% gain, and moving on to the next opportunity.

James’ Trader’s Tip: Take the Windfall and Move On

  • Buyout news can create an immediate jump in price and dramatically change the original technical setup.

  • When a stock delivers a sudden outsized gain, there is nothing wrong with taking the profit rather than waiting for incremental upside.

  • Bank the win, free up the capital, and look for the next strong setup.

CLICK/TAP CHART TO ZOOM
Chart services courtesy of stockcharts.com. Annotations by James Taulman.

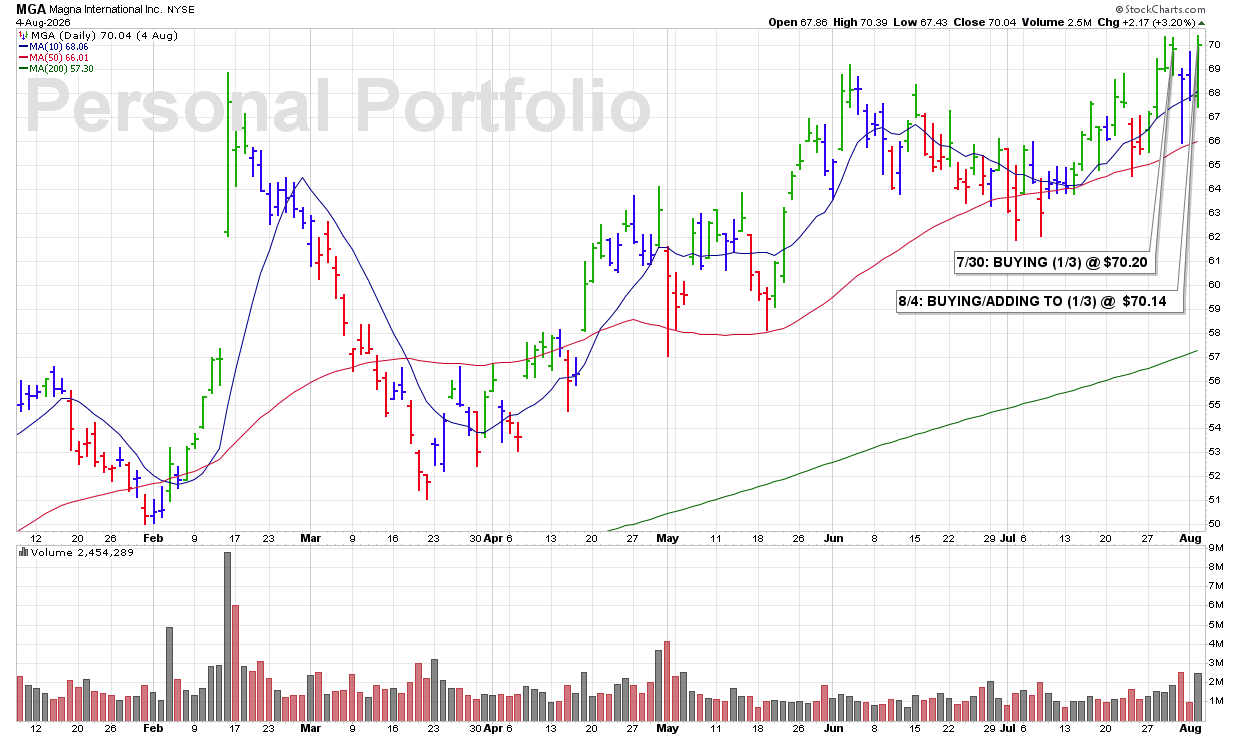
TUE 8/4: MGA – BUYING/ADDING TO (1/3) @ $70.14

1:48 PM – Adding another 1/3 position to MGA this afternoon as shares trade higher from the 10 DMA and begin breaking above the ROUND-$70 level while volume runs well above average. The combination of support at the 10 DMA, a move through round-number resistance, and strong volume gives me enough bullish confirmation to increase the position.

James Trader’s Tip: Add When Strength Confirms the Setup

  • An advance from the 10 DMA shows that technical support is holding.

  • Breaking above a key round-number level adds another layer of bullish confirmation.

  • Above-average volume strengthens the move and helps justify adding to an existing position.

CLICK/TAP CHART TO ZOOM
Chart services courtesy of stockcharts.com. Annotations by James Taulman.

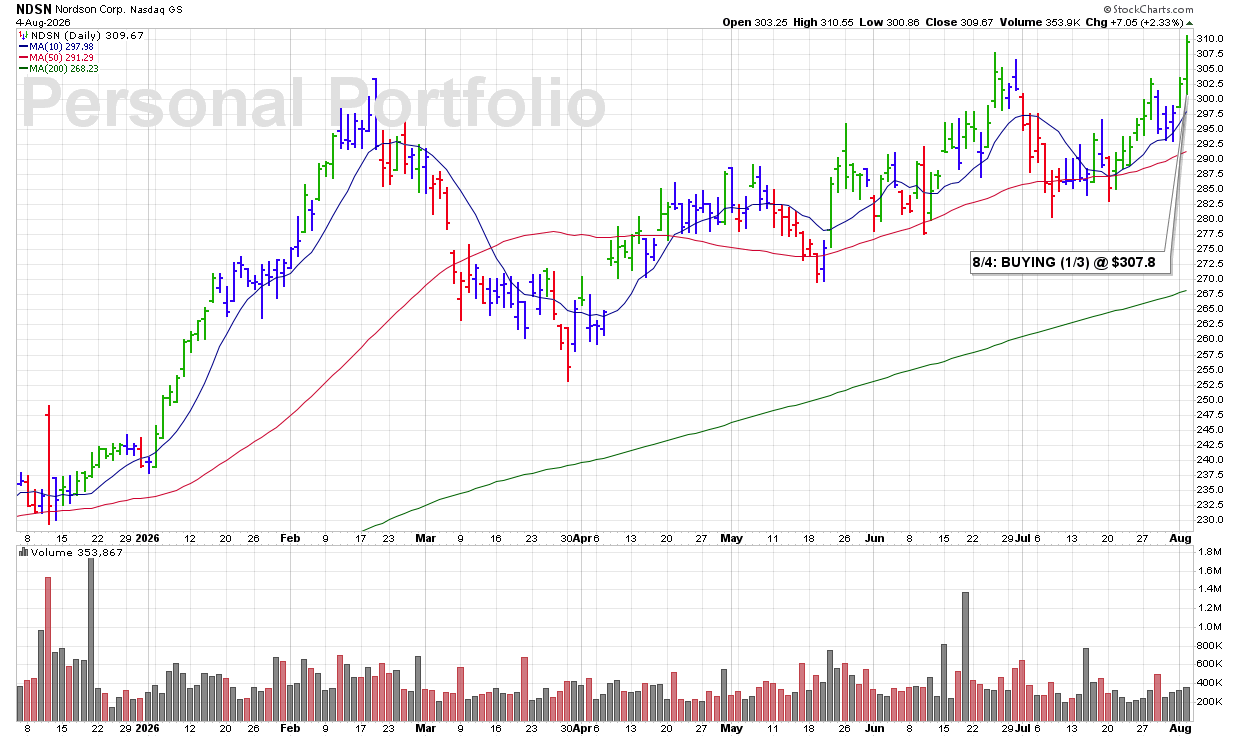
TUE 8/4: NDSN – BUYING (1/3) @ $307.84

12:16 PM – Adding a 1/3 position in this Machinery-General Industrial leader around midday as shares blast to new all-time highs on above-average volume. The combination of a breakout to new highs and expanding volume represents the type of bullish technical action that qualifies as a BUY SIGNAL under the ULTRA Trading System.

James’ Trader’s Tip: Buy the Leaders—Not the Laggards

  • Industry leaders making new highs are often attracting institutional buying.

  • Breakouts accompanied by above-average volume have a greater probability of continuing.

  • Focusing on market leaders with strong price and volume action can significantly improve the quality of your trade selections.

CLICK/TAP CHART TO ZOOM
Chart services courtesy of stockcharts.com. Annotations by James Taulman.

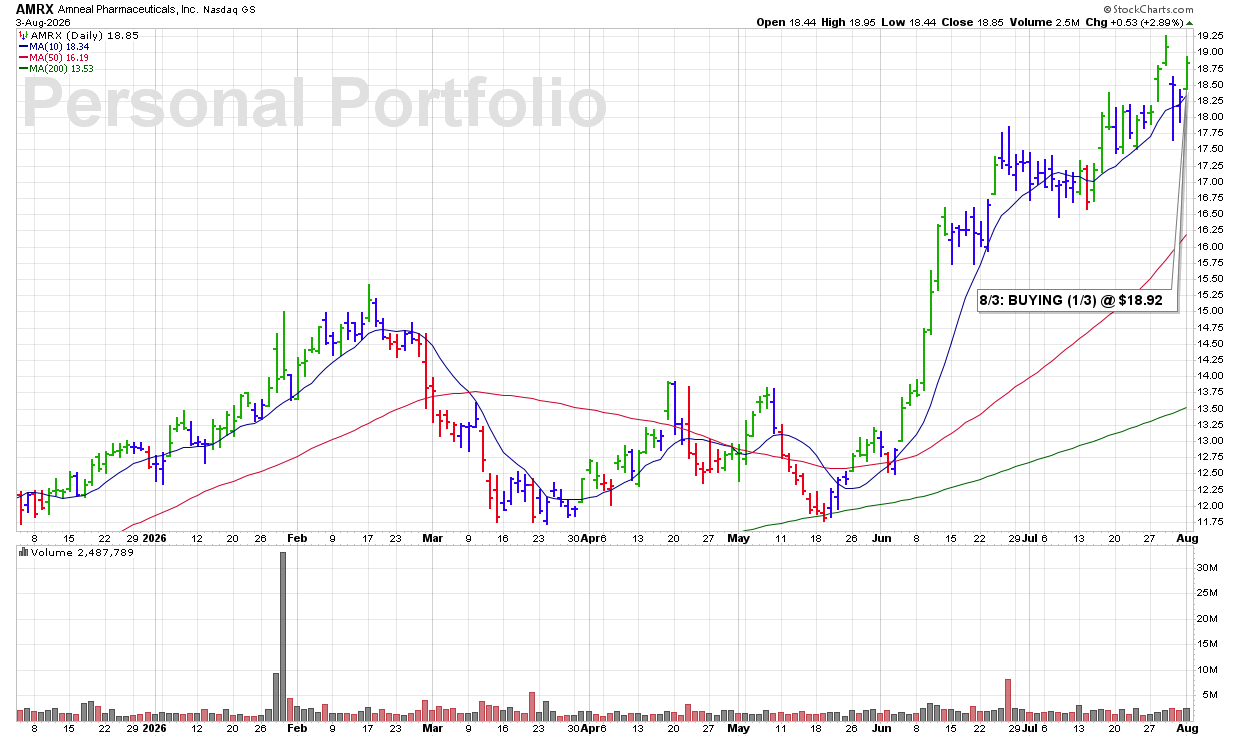
MON 8/3: AMRX – BUYING (1/3) @ $18.92

3:58 PM – Picking up a 1/3 starter position in this Medical-Pharmaceuticals leader as shares find support at the 10 DMA and trade higher into the close. The stock appears set to finish near the session highs while volume is running 22% above average. I consider this combination of price and volume action to be a technical BUY SIGNAL.

James’ Trader’s Tip: Strong Closes Add Conviction

  • Stocks that rebound from the 10 DMA and close near their session highs are often showing renewed buying interest.

  • Above-average volume increases confidence that institutional investors are supporting the move.

  • Starting with a 1/3 position allows you to participate while waiting for additional confirmation before committing more capital.

CLICK/TAP CHART TO ZOOM
Chart services courtesy of stockcharts.com. Annotations by James Taulman.

MON 8/3: AME – BUYING (1/3) @ $244.04

3:58 PM – Starting a 1/3 position in AME ahead of its earnings report. Earnings trades carry significant risk because stocks can gap sharply in either direction after the results are released. However, I have had success with several recent earnings plays, and with my personal trading account at all-time highs—up +42% YTD and 63% YoY—I am willing to assume that calculated risk with a smaller starter position.

James’ Trader’s Tip: Size Positions According to the Risk

  • Earnings announcements can produce sudden and unpredictable price gaps.

  • Beginning with a 1/3 position limits exposure while still providing meaningful upside participation.

  • Higher-risk trades should always be matched with smaller, more controlled position sizes.

CLICK/TAP CHART TO ZOOM
Chart services courtesy of stockcharts.com. Annotations by James Taulman.

MON 8/3: FTS – SELLING (1/2) P/L: -$395.96 -3.7%

3:44 PM – Selling all of my FTS position this afternoon as we head into the close. After recently losing support at the 10 DMA, shares are now clearly breaking below the 50 DMA while the 10 DMA is rolling over. With multiple signs of technical deterioration stacking up, I’m closing out the position and protecting capital.

James’ Trader’s Tip: Technical Weakness Often Builds in Stages

  • Losing the 10 DMA is often the first warning that short-term momentum is weakening.

  • A subsequent break below the 50 DMA confirms more serious technical deterioration.

  • When weakness continues to build and key moving averages begin rolling over, respect the message and reduce exposure.

CLICK/TAP CHART TO ZOOM
Chart services courtesy of stockcharts.com. Annotations by James Taulman.

WED 7/29: BBSI – BUYING (2/3) @ $41.67

10:33 AM – Buying back into BBSI this morning and adding an additional 1/3 position, bringing my total purchase to 2/3. Shares are moving higher on increased volume, signaling renewed buying demand. Although I cautiously sold the entire position yesterday, I cannot ignore this morning’s bullish price-and-volume action and the fresh BUY SIGNAL it has produced.

James’ Trader’s Tip: Trade the Action—Not Your Previous Decision

  • Selling a stock does not prevent you from buying it back when the technical picture improves.

  • Rising price accompanied by increasing volume can signal renewed institutional demand.

  • Disciplined traders remain flexible and respond to current evidence rather than defending yesterday’s decision.

CLICK/TAP CHART TO ZOOM
Chart services courtesy of stockcharts.com. Annotations by James Taulman.

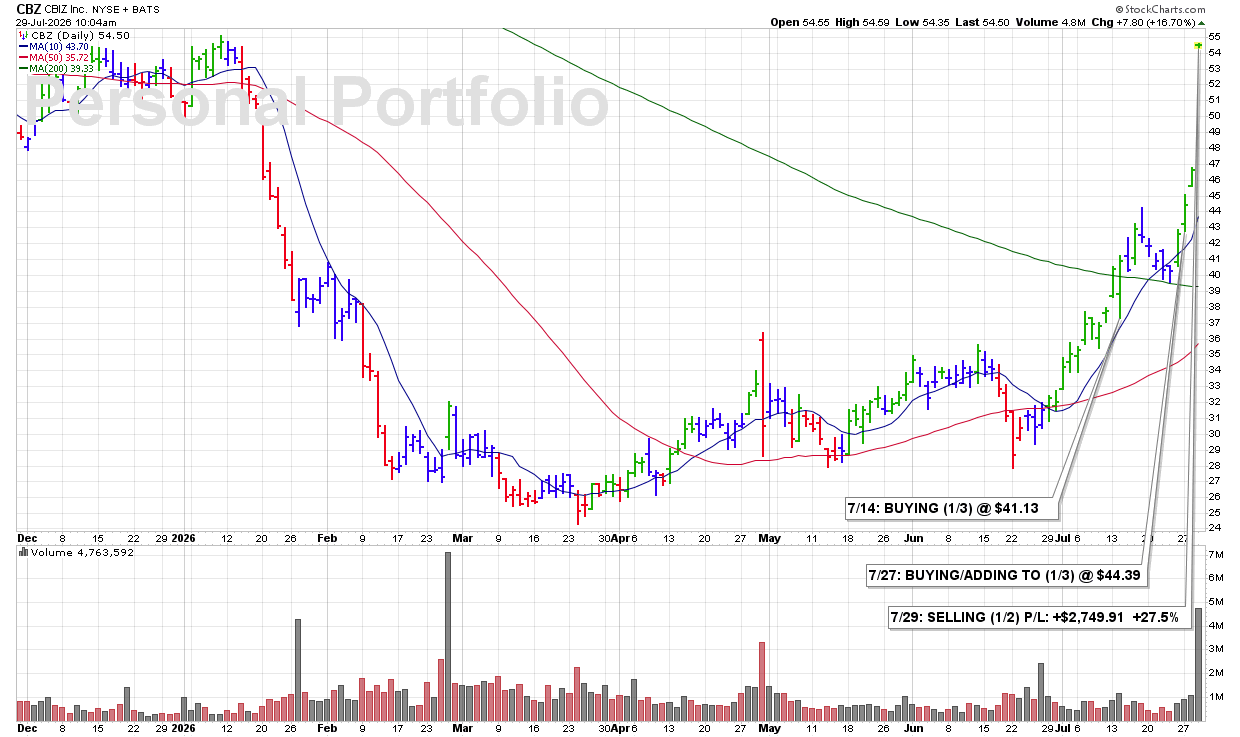
WED 7/29: CBZ – SELLING (1/2) P/L: +$2,749.91 +27.5%

9:55 AM – Selling half of my 2/3 position in CBZ this morning after the stock gapped sharply higher following earnings. While the reaction is certainly bullish, post-earnings trading can be highly volatile. I’m taking advantage of the strength to lock in a substantial profit while allowing the remaining shares to participate if the gains continue.

James’ Trader’s Tip: Let Earnings Work for You

  • Large post-earnings gaps often create increased volatility in both directions.

  • Selling a partial position into strength allows you to realize gains while maintaining upside exposure.

  • Scaling out in stages helps reduce emotional decision-making and keeps you aligned with your trading plan.

CLICK/TAP CHART TO ZOOM
Chart services courtesy of stockcharts.com. Annotations by James Taulman.

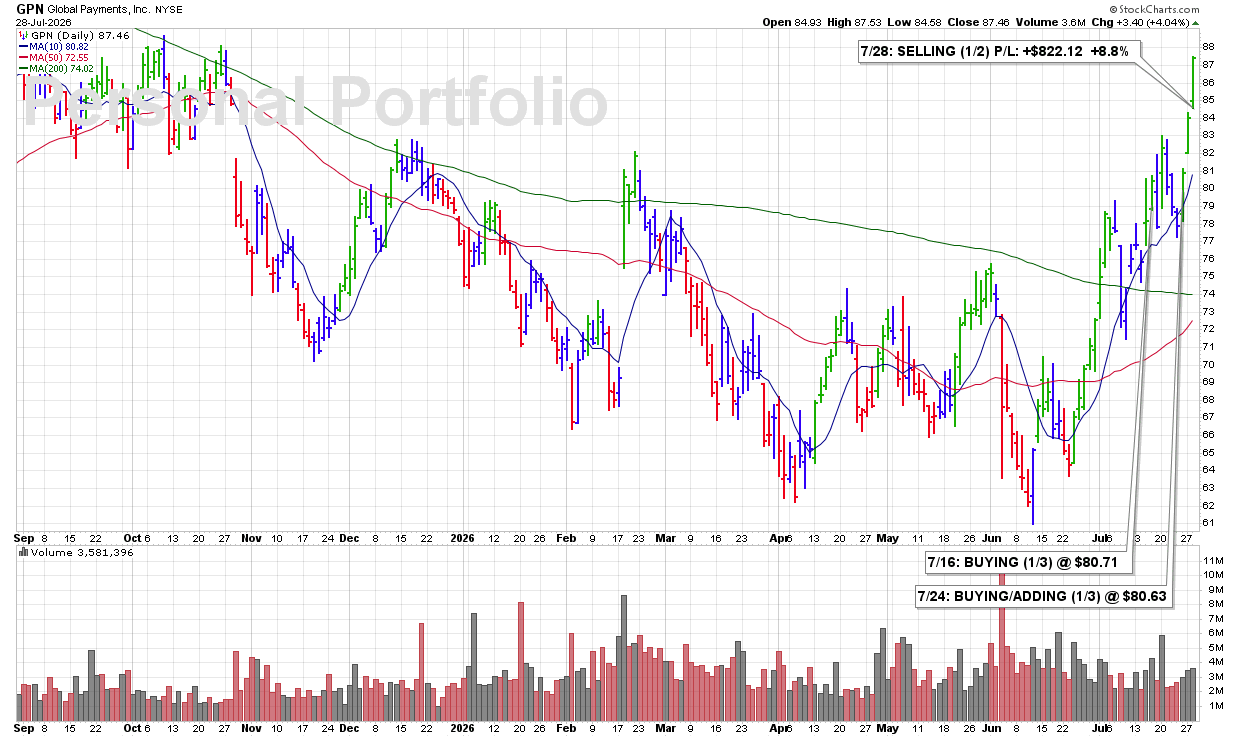
TUE 7/28: GPN – SELLING (1/2) P/L: +$822.12 +8.8%

3:43 PM – Selling half my GPN position here and locking in a solid gain. I have been in a selling mode today because I currently own too many stocks and may be carrying too much exposure in an increasingly shaky market. With my personal trading account at all-time highs—up 20% YTD and 60% YoY—my priority is protecting those gains and reducing unnecessary risk.

James’ Trader’s Tip: Reduce Exposure From a Position of Strength

  • Trimming a profitable position allows you to lock in gains while maintaining some exposure if the stock continues higher.

  • When portfolio exposure becomes excessive, reducing positions can lower both market risk and margin pressure.

  • Protecting an account at all-time highs requires discipline—not complacency.

CLICK/TAP CHART TO ZOOM
Chart services courtesy of stockcharts.com. Annotations by James Taulman.

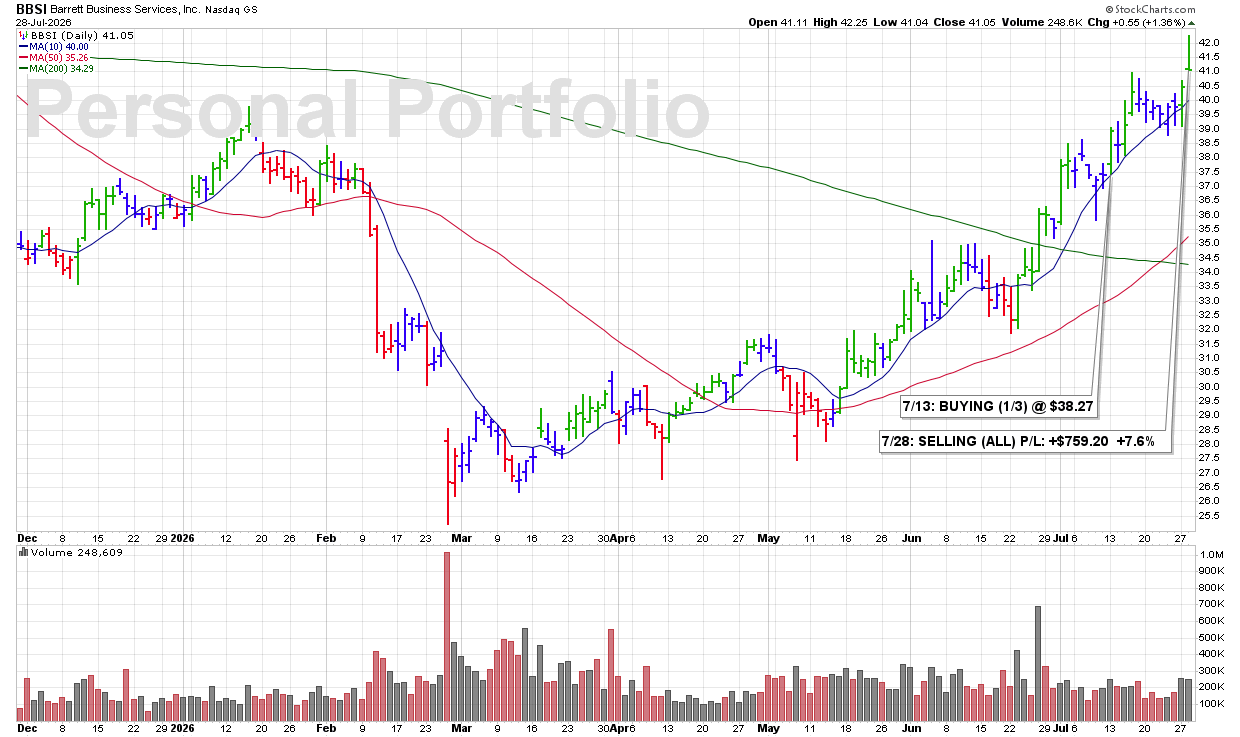
TUE 7/28: BBSI – SELLING (ALL) P/L: +$759.20 +7.6%

3:34 PM – Selling all my BBSI shares this afternoon as the stock reverses from its intraday highs and begins to weaken into the close. I’m taking the opportunity to lock in a solid profit while also reducing my overall margin and market exposure. My account is at all-time highs, and I want to keep it that way.

James’ Trader’s Tip: Protect Profits Before They Evaporate

• Stocks reversing from their intraday highs can signal that buying momentum is fading.

• Taking a respectable profit is often better than hoping for a little more and risking much less.

• Consistent trading is built on protecting gains just as diligently as limiting losses.

CLICK/TAP CHART TO ZOOM
Chart services courtesy of stockcharts.com. Annotations by James Taulman.

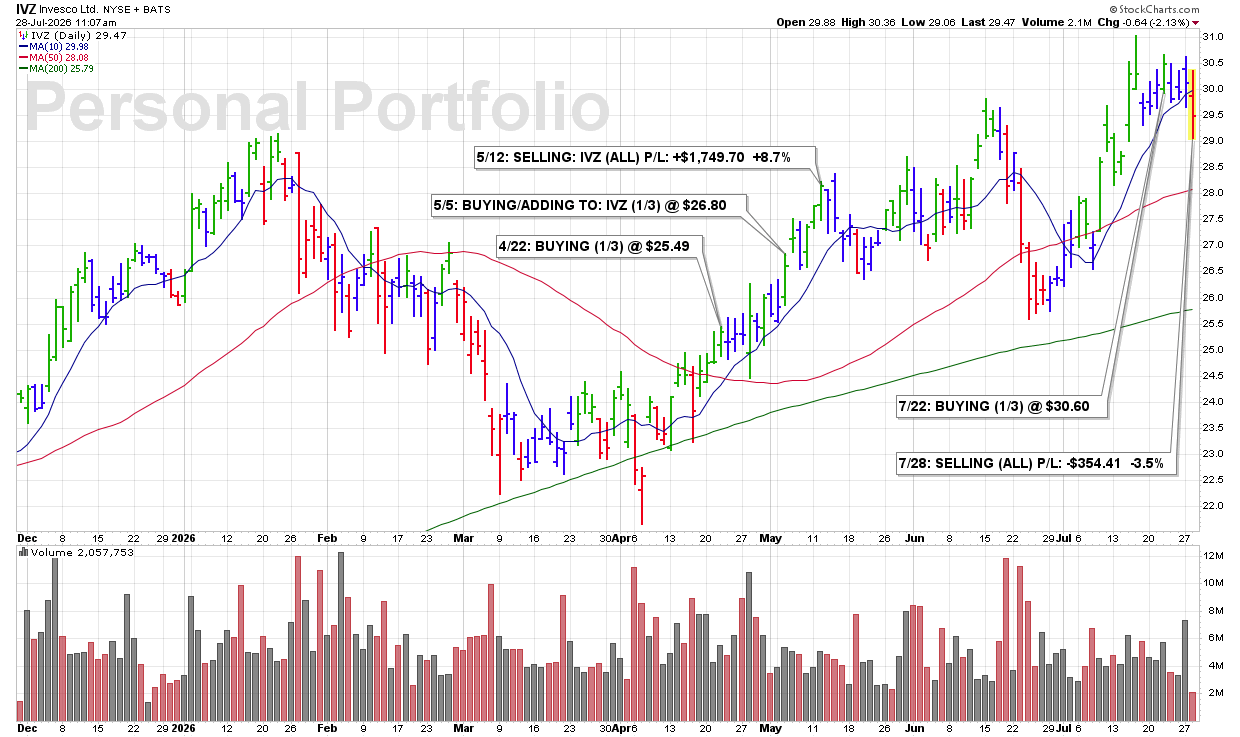
TUE 7/28: IVZ – SELLING (ALL) P/L: -$354.41 -3.5%

7/28 TUE: IVZ – SELLING (ALL) P/L: -$354.41 -3.5%

11:02 AM – Selling all my IVZ shares this morning. The stock has become volatile following earnings, which is both expected and fairly normal. However, I’m simply not willing to assume any additional risk here. My personal trading account is currently sitting at all-time highs, and my priority is protecting those gains rather than hoping for a post-earnings recovery.

James’ Trader’s Tip: There Is Nothing Wrong With Reducing Risk

• Earnings often create unpredictable price swings, regardless of a company’s long-term outlook.

• Protecting capital is just as important as generating returns.

• Sometimes the best decision is to step aside and preserve portfolio strength for the next high-probability opportunity.

CLICK/TAP CHART TO ZOOM
Chart services courtesy of stockcharts.com. Annotations by James Taulman.

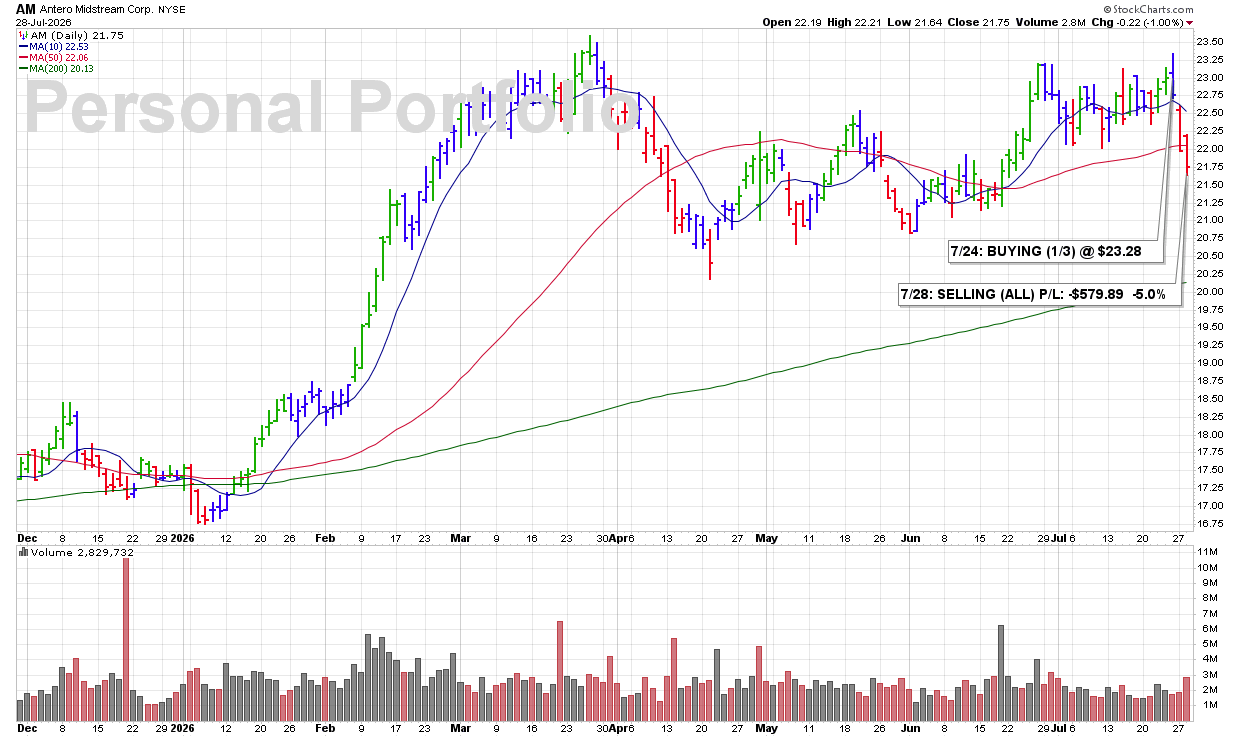
TUE 7/28: AM – SELLING (ALL) P/L: -$579.89 -5.0%

9:40 AM – Selling all my AM shares this morning as the stock continues lower after slipping below the 50 DMA yesterday. That break represents clear technical weakness. I am also freeing up needed capital to add another 1/3 position to FTS, which appears headed toward new highs on above-average volume.

James’ Trader’s Tip: Move Capital Toward Strength

  • A break below the 50 DMA is a meaningful technical violation that should not be ignored.

  • Holding a weakening stock can prevent capital from being deployed into a stronger opportunity.

  • Portfolio management is not only about what you sell—it is also about where that capital can work more effectively.

CLICK/TAP CHART TO ZOOM
Chart services courtesy of stockcharts.com. Annotations by James Taulman.

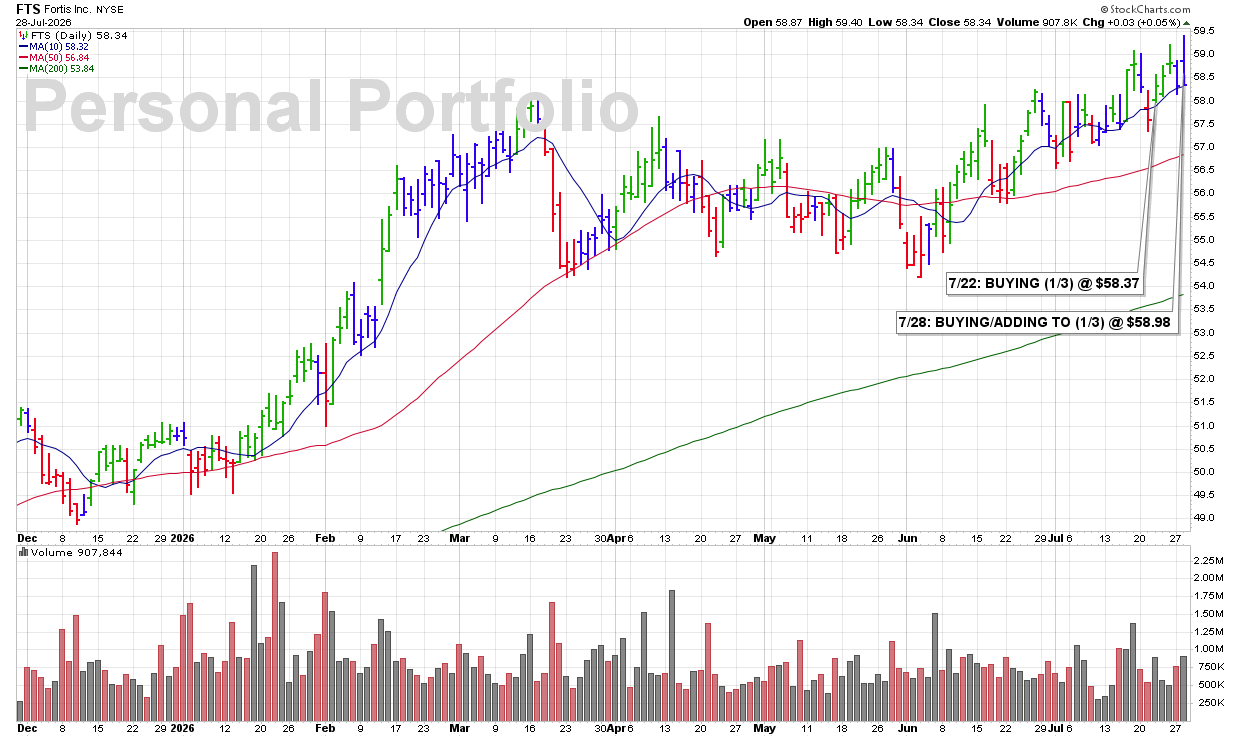
TUE 7/28: FTS – BUYING/ADDING TO (1/3) @ $58.98

9:40 AM – Adding another 1/3 position to FTS as shares advance from the 10 DMA to new highs on more than double their average volume. This powerful combination of price and volume confirms continued institutional demand and technical strength.

James’ Trader’s Tip: Exceptional Volume Strengthens the Signal

  • Volume running at more than twice the daily average signals unusually strong buying demand.

  • New highs reached on heavy volume carry greater technical significance than advances on light trade.

  • Adding in thirds allows us to increase exposure as the stock continues to confirm its strength.

CLICK/TAP CHART TO ZOOM
Chart services courtesy of stockcharts.com. Annotations by James Taulman.

MON 7/27: CBZ – BUYING/ADDING TO (1/3) @ $44.39

11:14 AM – Adding another 1/3 position to CBZ, bringing the total position to 2/3. Shares are advancing from near the 10 DMA to new recent highs on above-average volume, confirming continued technical strength.

James’ Trader’s Tip: Let Strength Earn a Larger Position

  • Add to a position only after the stock continues to act correctly and confirms the original trade.

  • New recent highs on above-average volume show that buying demand remains strong.

  • Scaling from 1/3 to 2/3 allows us to increase exposure while still managing risk.

CLICK/TAP CHART TO ZOOM
Chart services courtesy of stockcharts.com. Annotations by James Taulman.

MON 7/27: ITGR – BUYING (1/3) @ $100.52

10:21 AM – Starting a 1/3 position in this Medical Products leader from our TrendLine BreakOuts portfolio as shares break decisively above the ROUND-$100 level on a sharp increase in volume. This combination of price and volume gives us a strong technical BUY SIGNAL.

James’ Trader’s Tip: Volume Should Confirm the Breakout

  • A breakout carries more weight when accompanied by a noticeable increase in volume.

  • Higher volume suggests institutional buyers may be participating in the move.

  • When price and volume align, the odds of a successful breakout generally improve.

CLICK/TAP CHART TO ZOOM
Chart services courtesy of stockcharts.com. Annotations by James Taulman.

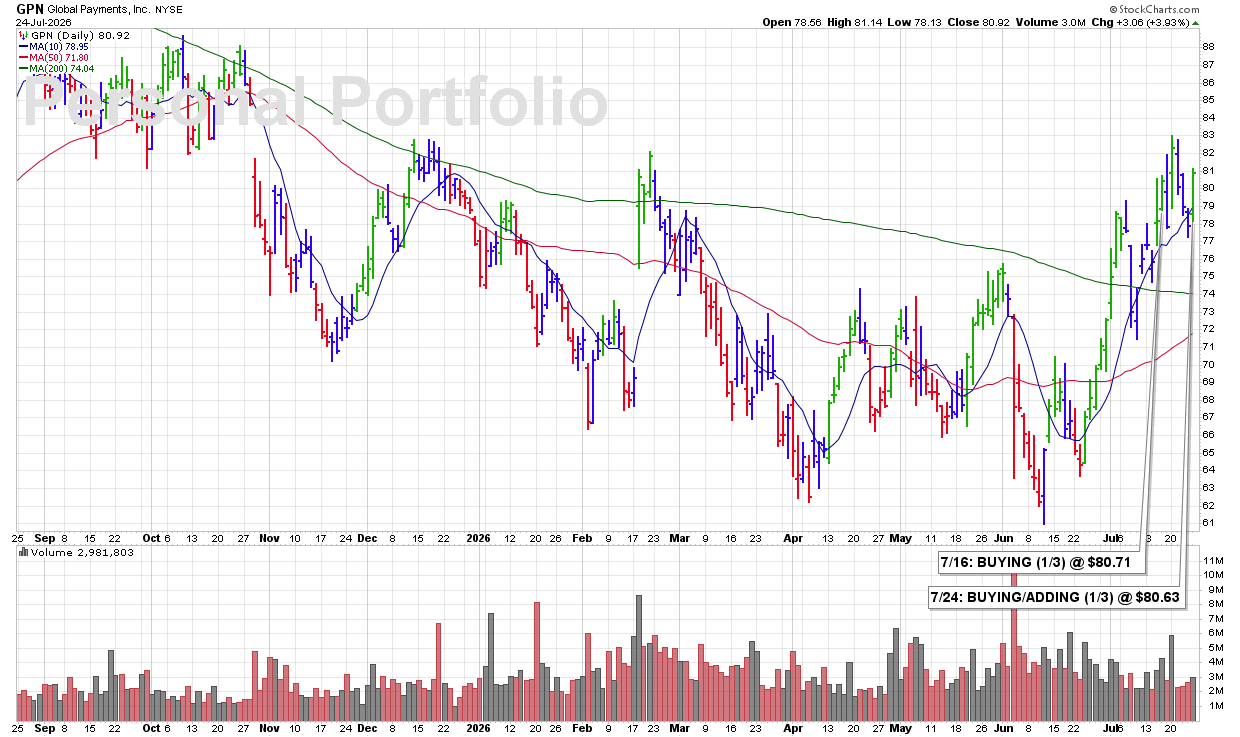
FRI 7/24: GPN – BUYING/ADDING (1/3) @ $80.63

11:25 AM – Adding another 1/3 position to GPN as shares advance from the 10 DMA, confirming renewed technical strength at this key support level.

James’ Trader’s Tip: Add Only When the Stock Confirms the Trade

  • Additional shares should be purchased because the stock is acting correctly—not simply because you already own it.

  • An advance from the 10 DMA can provide confirmation that buyers continue to support the move.

  • Scaling in by thirds allows the stock to earn a larger position through continued technical strength.

CLICK/TAP CHART TO ZOOM
Chart services courtesy of stockcharts.com. Annotations by James Taulman.

FRI 7/24: AM – BUYING (1/3) @ $23.28

9:44 AM – I’m picking up a 1/3 position in this natural gas transmission, water supply, and treatment services stock from our Swing Trades Portfolio a little early this morning. Shares are breaking above several recent highs with what was an increase in volume.

ULTRA Trader’s Tip: Start Small When Buying Early

  • Entering before a breakout is fully confirmed carries additional risk.

  • Beginning with a 1/3 position provides exposure while limiting risk if the move fails.

  • Additional shares can be added later if the stock continues to confirm the BUY SIGNAL.

CLICK/TAP CHART TO ZOOM
Chart services courtesy of stockcharts.com. Annotations by James Taulman.

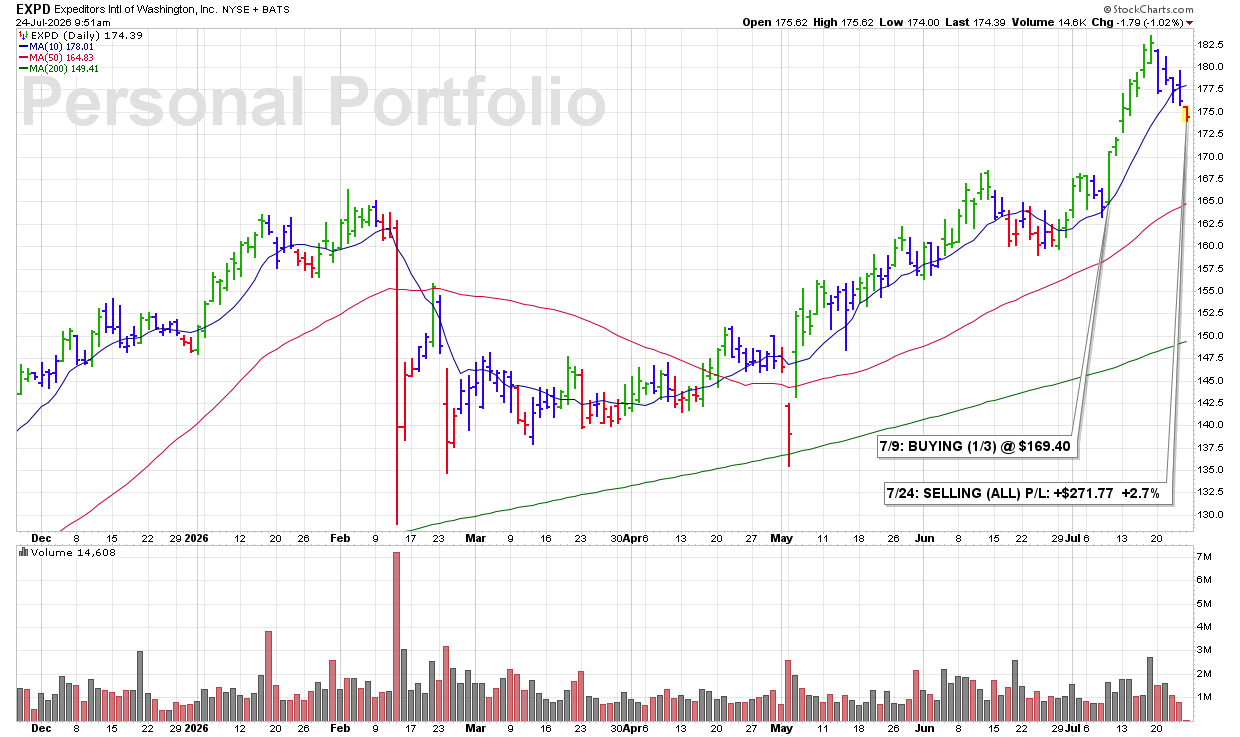
FRI 7/24: EXPD – SELLING (ALL) P/L: +$271.77 +2.7%

9:38 AM – Selling my entire EXPD position early this morning. I typically avoid making trades before 10:00 AM, allowing the market time to settle after the opening volatility. However, within the ULTRA Personal Portfolio, I will occasionally act ahead of an official SELL SIGNAL when I believe the technical evidence warrants it. In this case, the stock is beginning to carve out a bearish pattern characterized by (1) a series of lower highs, (2) a break below the 10 DMA, and (3) the 10 DMA beginning to roll over. Rather than wait for additional technical deterioration, I’m taking a small profit and moving on to stronger opportunities.

James’ Trader’s Tip: Anticipating Technical Weakness

  • While the ULTRA system is rules-based, experience can sometimes identify a weakening pattern before an official SELL SIGNAL is triggered.

  • A series of lower highs combined with a declining 10 DMA often signals that momentum is fading.

  • Preserving capital and reallocating it into stronger opportunities is often more productive than waiting for additional technical damage to occur.

CLICK/TAP CHART TO ZOOM
Chart services courtesy of stockcharts.com. Annotations by James Taulman.

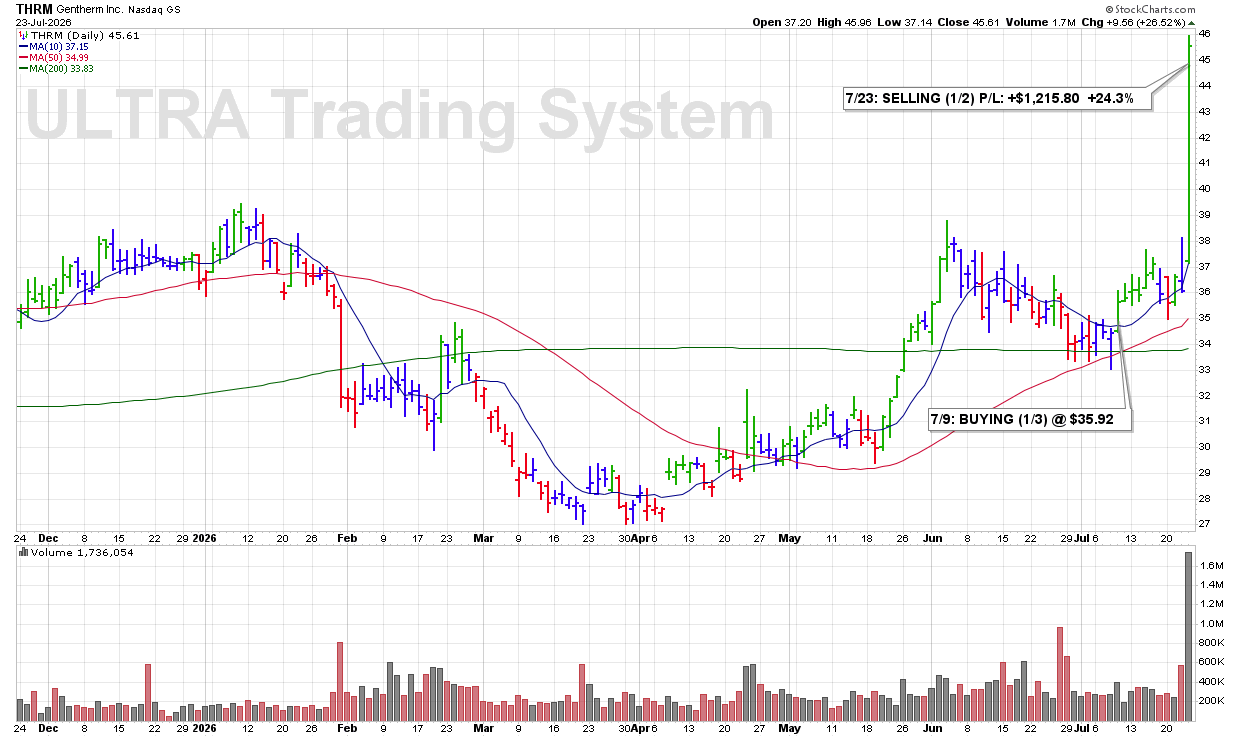
THU 7/23: THRM – SELLING (1/2) P/L: +$1,215.80 +24.3%

3:36 PM – Selling half of my THRM position here into the close. I’m locking in a portion of these quick gains as my personal trading account reaches a new all-time high. The remaining position allows me to continue participating should the stock’s uptrend persist.

ULTRA Trader’s Tip: There’s Nothing Wrong With Taking Profits

  • Strong gains can disappear quickly if they aren’t protected.

  • Selling a portion of a winning position locks in profits while allowing the remaining shares to continue working for you.

  • Partial profit-taking is a disciplined way to manage both risk and portfolio growth.

CLICK/TAP CHART TO ZOOM
Chart services courtesy of stockcharts.com. Annotations by James Taulman.

WED 7/22: FTS – BUYING (1/3) @ $58.37

3:50 PM – Picking up a 1/3 position in this utility stock as shares advance from the 10 DMA on a 21% increase in volume. The combination of improving price action and expanding volume gives us a technical BUY SIGNAL, so I’m starting with my usual 1/3 position.

James’ Trader’s Tip: Buy Stocks Showing Institutional Demand

  • Price advances accompanied by increasing volume often indicate institutional buying.

  • Stocks moving higher from the 10 DMA frequently signal that buyers are stepping back in.

  • Strong price action supported by expanding volume provides a higher-probability technical entry.

CLICK/TAP CHART TO ZOOM
Chart services courtesy of stockcharts.com. Annotations by James Taulman.

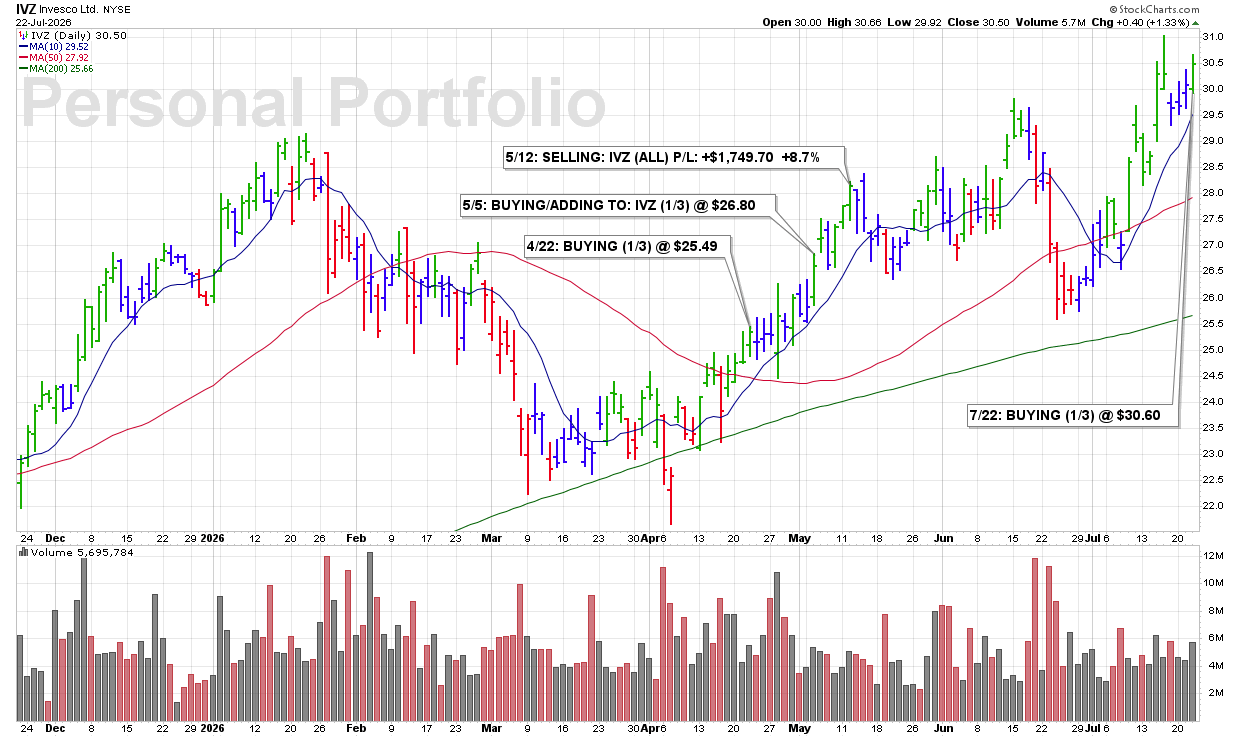
WED 7/22: IVZ – BUYING (1/3) @ $30.60

3:50 PM – Starting a 1/3 position in this Finance-Investment Management leader—a stock I have followed and reported on many times throughout my career. Shares are closing decisively above the ROUND-$30 level this afternoon while volume remains above average, giving us a technical BUY SIGNAL.

James’ Trader’s Tip: Strong Closes Help Confirm Breakouts

  • A stock that finishes the session firmly above resistance is showing that buyers maintained control into the close.

  • Above-average volume adds credibility by indicating stronger participation behind the move.

  • The best breakouts do not merely cross resistance—they close above it with conviction.

CLICK/TAP CHART TO ZOOM
Chart services courtesy of stockcharts.com. Annotations by James Taulman.

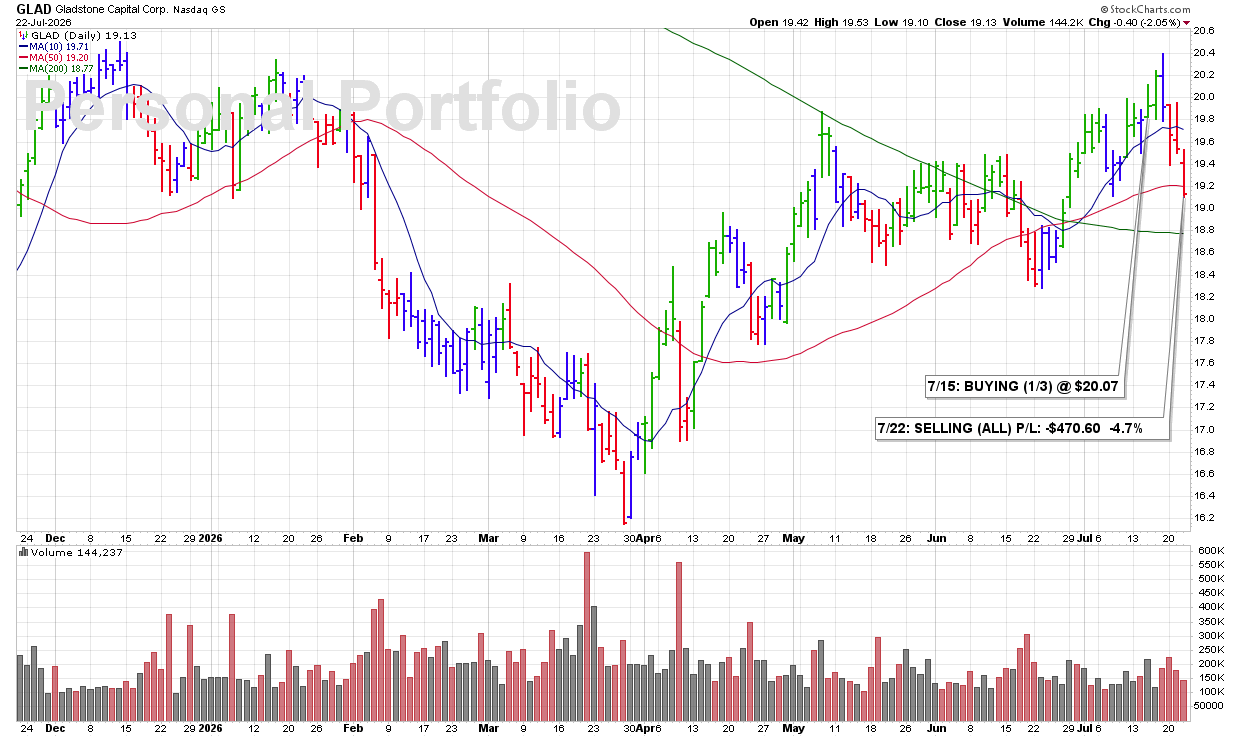
WED 7/22: GLAD – SELLING (ALL) P/L: -$470.60 -4.7%

3:34 PM – Selling my entire GLAD position this afternoon after several days of continued weakness. Shares first broke below the 10 DMA and are now violating the 50 DMA, creating too much technical deterioration to ignore. With multiple violations stacking up, I’m taking the loss and moving on.

James’ Trader’s Tip: Respect Stacked Technical Violations

  • One technical violation is a warning; multiple violations confirm that weakness is increasing.

  • A break below both the 10 DMA and 50 DMA shows deterioration in the short- and intermediate-term trends.

  • When bearish signals continue to accumulate, protecting capital becomes the priority.

CLICK/TAP CHART TO ZOOM
Chart services courtesy of stockcharts.com. Annotations by James Taulman.

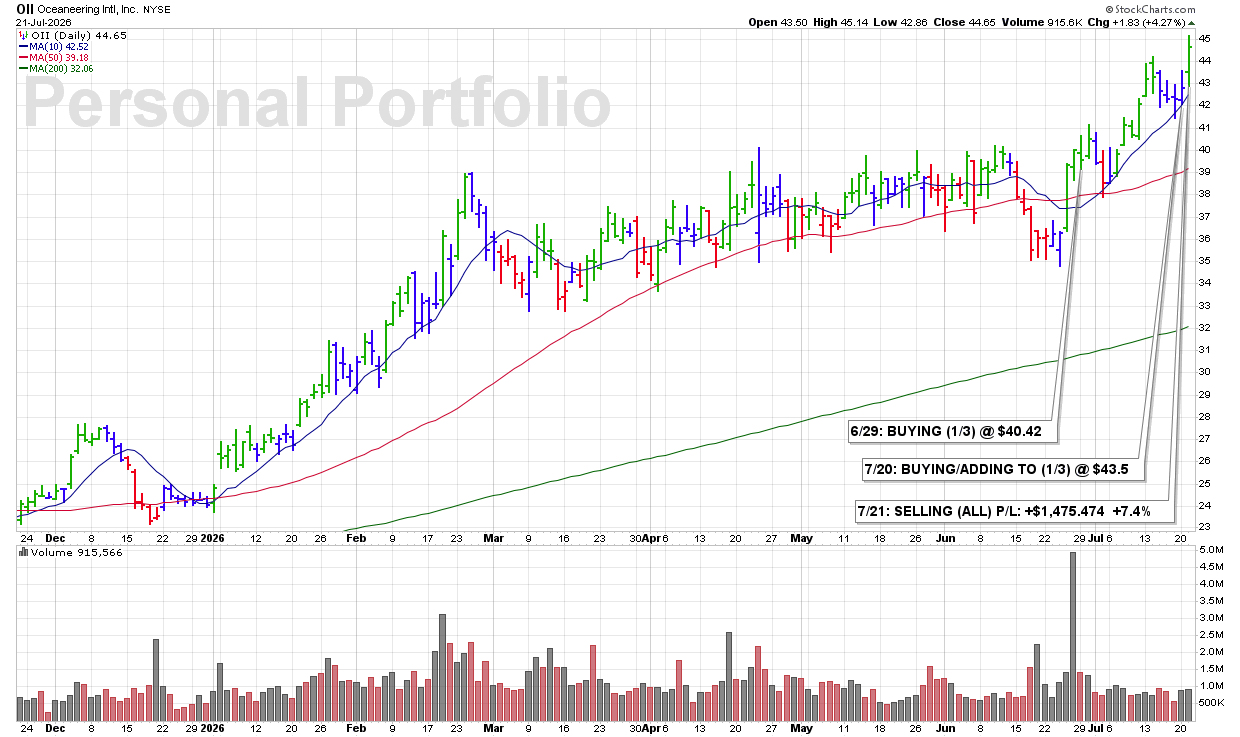
TUE 7/21: OII – SELLING (ALL) P/L: +$1,475.474 +7.4%

2:28 PM – I’m taking these solid profits in OII as the stock has delivered a respectable gain in a short period of time. With the company scheduled to report earnings tomorrow, I’m choosing to lock in the profit rather than assume the additional overnight earnings risk.

James’ Trader’s Tip: Don’t Be Afraid to Take a Good Profit

  • You don’t have to capture every last dollar of a move to be a successful trader.

  • Consistently taking solid gains helps build long-term portfolio performance while reducing risk.

  • Good trades are measured by disciplined execution—not by selling at the exact top.

CLICK/TAP CHART TO ZOOM
Chart services courtesy of stockcharts.com. Annotations by James Taulman.

MON 7/20: OII – BUYING/ADDING TO (1/3) @ $43.5

10:09 AM – Adding another 1/3 position to my OII holding this morning as shares advance from their 10 DMA with an increase in volume. This is constructive bullish action and provides confirmation to continue scaling into the position.

James’ Trader’s Tip: Add When the Stock Confirms Strength

  • An advance from the 10 DMA shows that short-term support is holding.

  • Increased volume adds confirmation that buyers are supporting the move.

  • Scaling in by thirds allows the stock to earn additional capital through continued bullish action.

CLICK/TAP CHART TO ZOOM
Chart services courtesy of stockcharts.com. Annotations by James Taulman.

FRI 7/17: APD – SELLING (ALL) P/L: -$192.64 -1.9%

3:54 PM – Selling my entire APD position here as we head into the close. The stock has been making a series of lower highs and posted a negative reversal today. In addition, the 10 DMA is now rolling over, while the next meaningful support at the 50 DMA remains approximately another 2% below the current share price.

I am responding to these increasingly bearish technical signals while also reducing margin exposure—particularly among technically weaker holdings—in the current market environment.

James’ Trader’s Tip: Reduce Exposure in the Weaker Names

  • Lower highs and a negative reversal indicate that buying momentum is deteriorating.

  • A rolling-over 10 DMA increases the risk of further weakness toward the 50 DMA.

  • When reducing margin, prioritize technically weaker holdings rather than selling your strongest stocks indiscriminately.

CLICK/TAP CHART TO ZOOM
Chart services courtesy of stockcharts.com. Annotations by James Taulman.

THU 7/16: GPN – BUYING (1/3) @ $80.71

2:26 PM – Starting a 1/3 position in this payments and software technology solutions company as shares break above the ROUND-$80 resistance level with volume running above the normal daily rate. This combination of a key resistance breakout and improving volume is constructive bullish action and gives us a technical BUY SIGNAL.

James’ Trader’s Tip: Resistance Breakouts Need Volume

  • Round-number levels often act as important areas of psychological resistance.

  • A decisive move above resistance indicates buyers are gaining control.

  • Above-average volume adds confirmation that the breakout is supported by meaningful demand.

CLICK/TAP CHART TO ZOOM
Chart services courtesy of stockcharts.com. Annotations by James Taulman.

THU 7/16: CLH – BUYING (1/3) @ $310.26

10:20 AM – Picking up a 1/3 position in this pollution control company as shares break out of a downtrend on a healthy increase in volume. The combination of improving price action and expanding volume gives us a technical BUY SIGNAL.

James’ Trader’s Tip: Trend Changes Create Opportunity

  • A breakout from a downtrend can mark the beginning of a new advance.

  • Increased volume adds conviction that buyers are stepping in.

  • Starting with a 1/3 position allows the stock to prove itself before committing additional capital.

CLICK/TAP CHART TO ZOOM
Chart services courtesy of stockcharts.com. Annotations by James Taulman.

WED 7/15: GLAD – BUYING (1/3) @ $20.07

10:50 AM – Starting a 1/3 position in this Finance-Investment Management stock as shares break above the ROUND-$20 level on an increase in volume. This combination of improving price action and expanding volume gives us a technical BUY SIGNAL.

James’ Trader’s Tip: Round Numbers Often Act as Key Price Levels

  • Round-number price levels frequently serve as important areas of support or resistance.

  • A breakout above a round-number level, especially on increasing volume, can signal growing buying interest.

  • Wait for price to confirm the breakout before initiating a new position whenever possible.

CLICK/TAP CHART TO ZOOM
Chart services courtesy of stockcharts.com. Annotations by James Taulman.

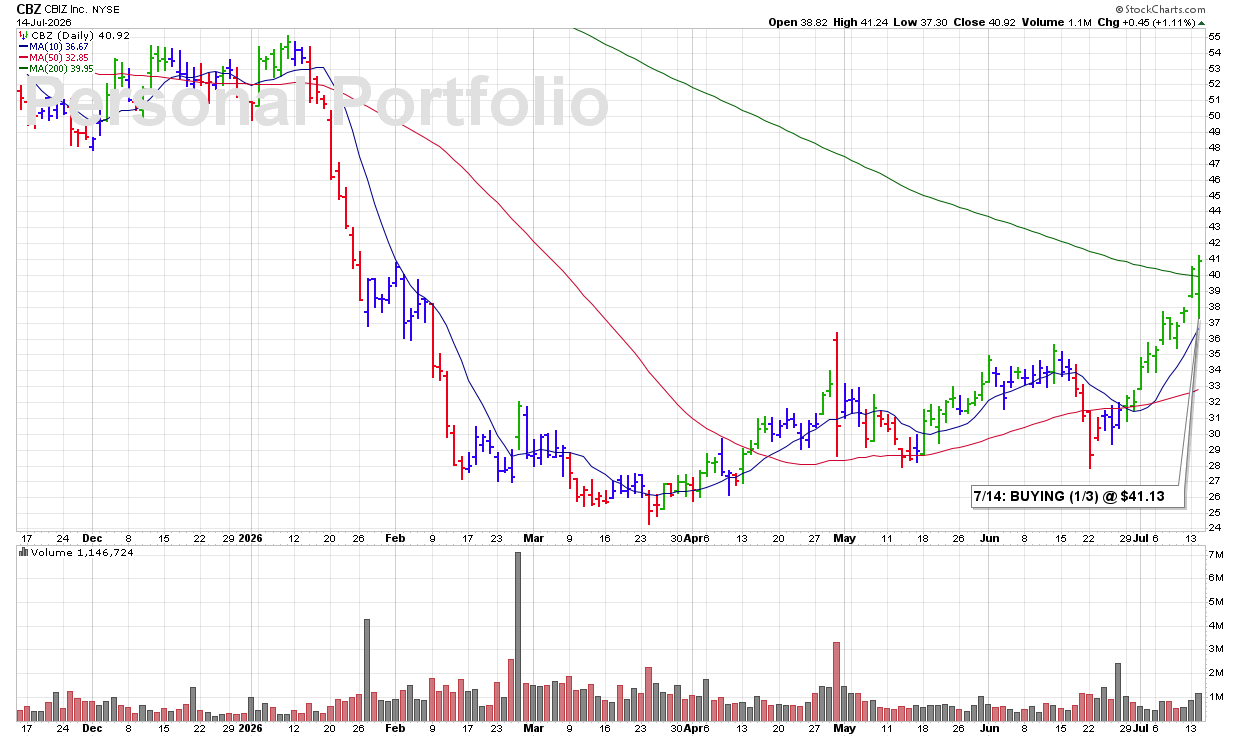
TUE 7/14: CBZ – BUYING (1/3) @ $41.13

3:43 PM – Starting a 1/3 position in this Commercial Services-Consulting stock as shares advance from the 10 DMA and appear set to close near the session highs. This constructive price action gives us a technical BUY SIGNAL.

James’ Trader’s Tip: Strength Into the Close Matters

  • Stocks closing near their session highs are showing that buyers remained in control throughout the day.

  • An advance from the 10 DMA can signal that institutional support is returning at a key technical level.

  • Starting with a 1/3 position allows me to participate while leaving room to add if the stock continues to confirm the move.

CLICK/TAP CHART TO ZOOM
Chart services courtesy of stockcharts.com. Annotations by James Taulman.

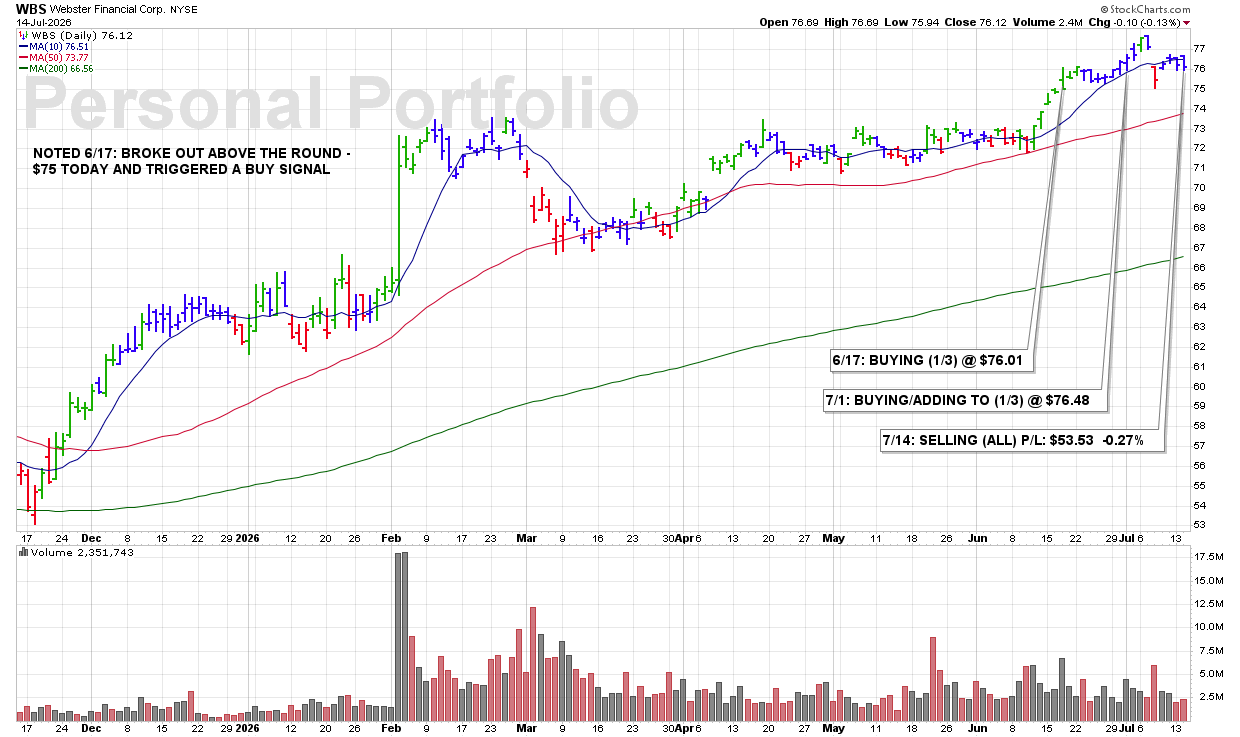
TUE 7/14: WBS – SELLING (ALL) P/L: $53.53 -0.27%

3:30 PM – Selling all my shares of this bank stock this afternoon as the stock does not appear positioned to make a meaningful move anytime soon. I would rather reduce my margin and overall market exposure while freeing up cash for another potentially faster-moving opportunity.

James’ Trader’s Tip: Capital Should Always Have a Purpose

  • A stock does not need to break down technically before you decide the capital could be used more effectively elsewhere.

  • Slow-moving positions can limit your flexibility when stronger opportunities begin to emerge.

  • Protecting buying power and maintaining available cash are important parts of active portfolio management.

CLICK/TAP CHART TO ZOOM
Chart services courtesy of stockcharts.com. Annotations by James Taulman.

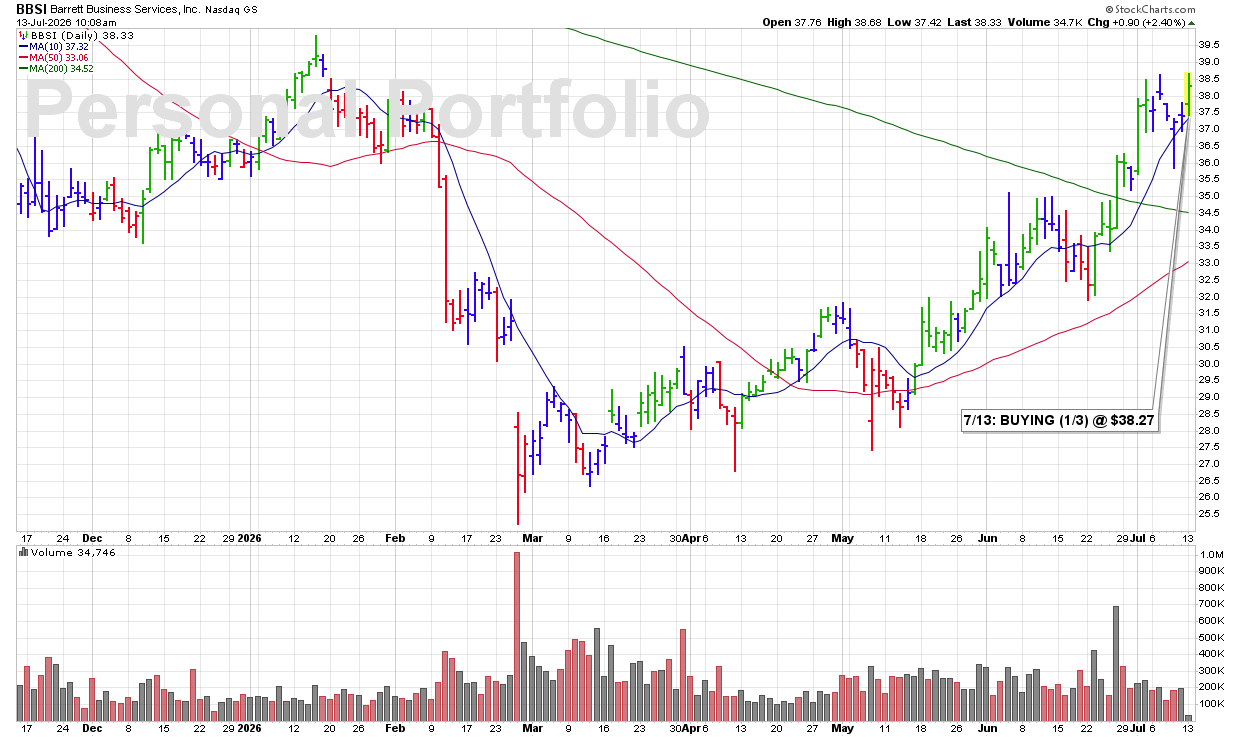
MON 7/13: BBSI – BUYING (1/3) @ $38.27

9:56 AM – This morning, shares are trading higher from the 10 DMA with volume running at more than twice the normal rate. That is one of my highest-probability technical BUY SIGNALS. I’m starting with a 1/3 position here.

James’ Trader’s Tip: Volume Confirms Demand

  • An advance from the 10 DMA shows the stock is responding to short-term support.

  • Volume running at more than twice the normal rate adds meaningful confirmation to the move.

  • Starting with a 1/3 position provides exposure while leaving room to add if the stock continues to prove itself.

CLICK/TAP CHART TO ZOOM
Chart services courtesy of stockcharts.com. Annotations by James Taulman.

FRI 7/10: APD – BUYING (1/3) @ $301.13

3:47 PM – Picking up a 1/3 position in APD this afternoon as the stock advances from its 10 DMA and breaks above ROUND-$300. That combination of short-term support and a move through key resistance is a technical BUY SIGNAL.

James’ Trader’s Tip: Round Numbers Can Confirm Momentum

  • Major round-number levels often act as psychological resistance.

  • Clearing that resistance while advancing from the 10 DMA strengthens the technical picture.

  • Starting with a 1/3 position allows the stock to earn additional capital through continued bullish

CLICK/TAP CHART TO ZOOM
Chart services courtesy of stockcharts.com. Annotations by James Taulman.

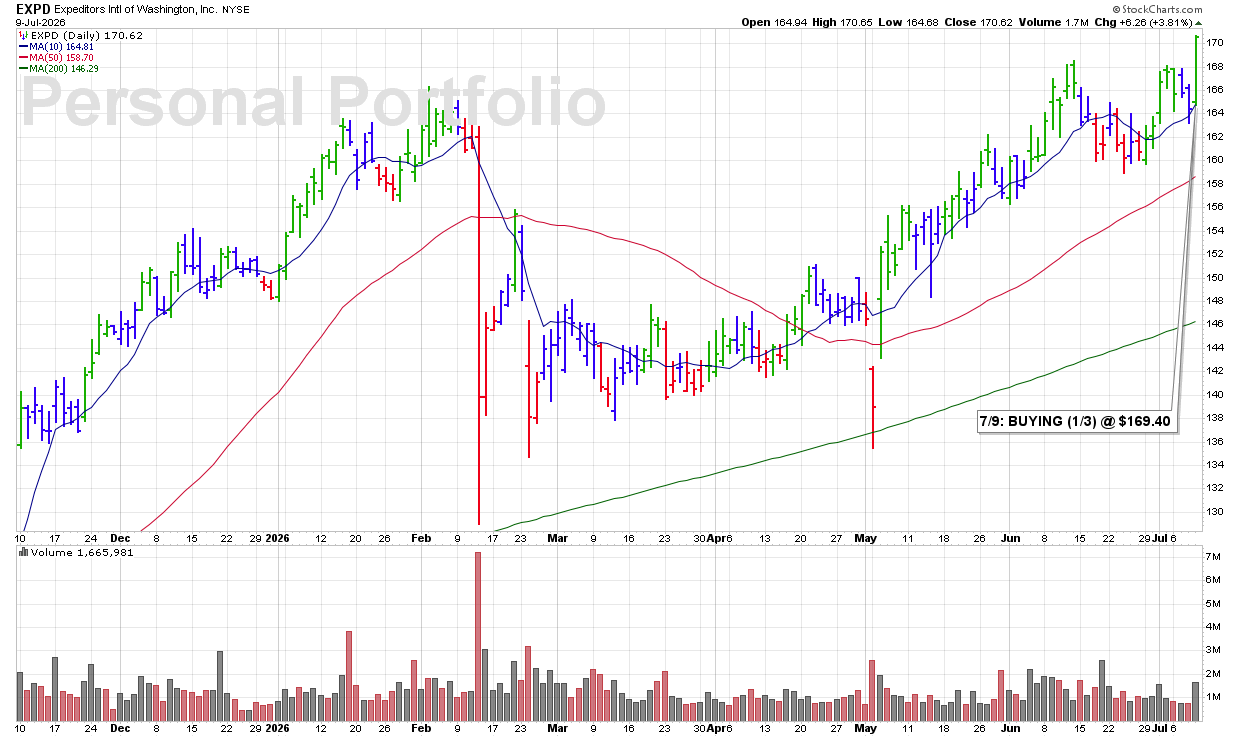
THU 7/9: EXPD – BUYING (1/3) @ $169.40

3:40 PM – Grabbing some of this transportation stock as shares break out to new highs with volume running +39% above average. The stock is also advancing sharply from its 10 DMA, providing additional technical confirmation. Starting with my usual 1/3 position here.

James’ Trader’s Tip: Price and Volume Confirm the Breakout

  • Breakouts to new highs demonstrate strong price momentum.

  • Above-average volume provides evidence of increased buying demand.

  • When a stock advances from its 10 DMA with strong volume, the technical action supports initiating a position.

CLICK/TAP CHART TO ZOOM
Chart services courtesy of stockcharts.com. Annotations by James Taulman.

THU 7/9: THRM – BUYING (1/3) @ $35.92

3:38 PM – Picking up this Auto/Truck Equipment maker here, perhaps a bit prematurely, as I would ideally like to see shares clear $36.00. Therefore, I am starting with only 1/3 of my standard position size and will be watching this one closely.

There is currently a lack of ideal setups, but based on my portfolio goals, I am aggressively looking to put some capital to work this afternoon.

James’ Trader’s Tip: Position Size Can Manage Entry Risk

  • Not every purchase needs to begin with a full position.

  • Starting with 1/3 limits exposure when a stock has not yet fully confirmed its breakout.

  • Additional capital should be earned through continued positive technical action.

CLICK/TAP CHART TO ZOOM
Chart services courtesy of stockcharts.com. Annotations by James Taulman.

WED 7/1: LQDA – SELLING (ALL) P/L: +$1,401.40 +13.9%

7/1 WED: LQDA – SELLING (ALL) P/L: +$1,401.40 +13.9%

3:55 PM – Selling all of my LQDA here this afternoon and taking a solid profit. Again, my current theme remains taking profits — maybe prematurely — but that discipline has helped push my account to new all-time highs after a lackluster first half of the year.

James’ Trader’s Tip: Profits Build Confidence

  • After a difficult stretch, booking real gains can help restore momentum.

  • Taking profits early may leave some upside behind, but it also protects hard-earned progress.

  • Strong account performance is built by consistently turning good trades into realized gains.

CLICK/TAP CHART TO ZOOM
Chart services courtesy of stockcharts.com. Annotations by James Taulman.

WED 7/1: WBS – BUYING/ADDING TO (1/3) @ $76.48

11:25 AM – Adding to my WBS position as shares continue to advance from the 10 DMA with volume currently running +50% above average. That combination of price and volume confirms the stock is continuing to act well technically.

James’ Trader’s Tip: Add Only When the Stock Earns It

  • Let the stock prove itself before committing additional capital.

  • Advances from the 10 DMA on strong volume are a constructive sign of continued demand.

  • Scaling into strength can improve both discipline and long-term performance.

CLICK/TAP CHART TO ZOOM
Chart services courtesy of stockcharts.com. Annotations by James Taulman.

MON 6/29: TRV – SELLING (ALL) P/L: +$560.96 +5.6%

3:31 PM – Selling all of my TRV here as shares are starting to get extended from the 10 DMA, while today’s volume is below average. My mantra remains: take profits.

James’ Trader’s Tip: Take Profits Before the Chart Forces You To

  • Extended stocks often pull back toward the 10 DMA to reset.

  • Below-average volume makes today’s advance less convincing.

  • Locking in gains keeps capital moving and protects hard-earned profits.

CLICK/TAP CHART TO ZOOM
Chart services courtesy of stockcharts.com. Annotations by James Taulman.

MON 6/29: OII – BUYING (1/3) @ $40.42

10:01 PM – Starting a position in this oil-related stock as it breaks above ROUND-$40 and moves to new multi-year highs on above-average volume. That combination of price strength, volume support, and sector momentum qualifies as a technical BUY SIGNAL.

James’ Trader’s Tip: Long-Term Breakouts Matter

  • Multi-year highs often represent the completion of long-term bases.

  • The longer a stock consolidates, the more meaningful the eventual breakout can become.

  • Volume helps confirm that institutions are participating in the move.

CLICK/TAP CHART TO ZOOM
Chart services courtesy of stockcharts.com. Annotations by James Taulman.

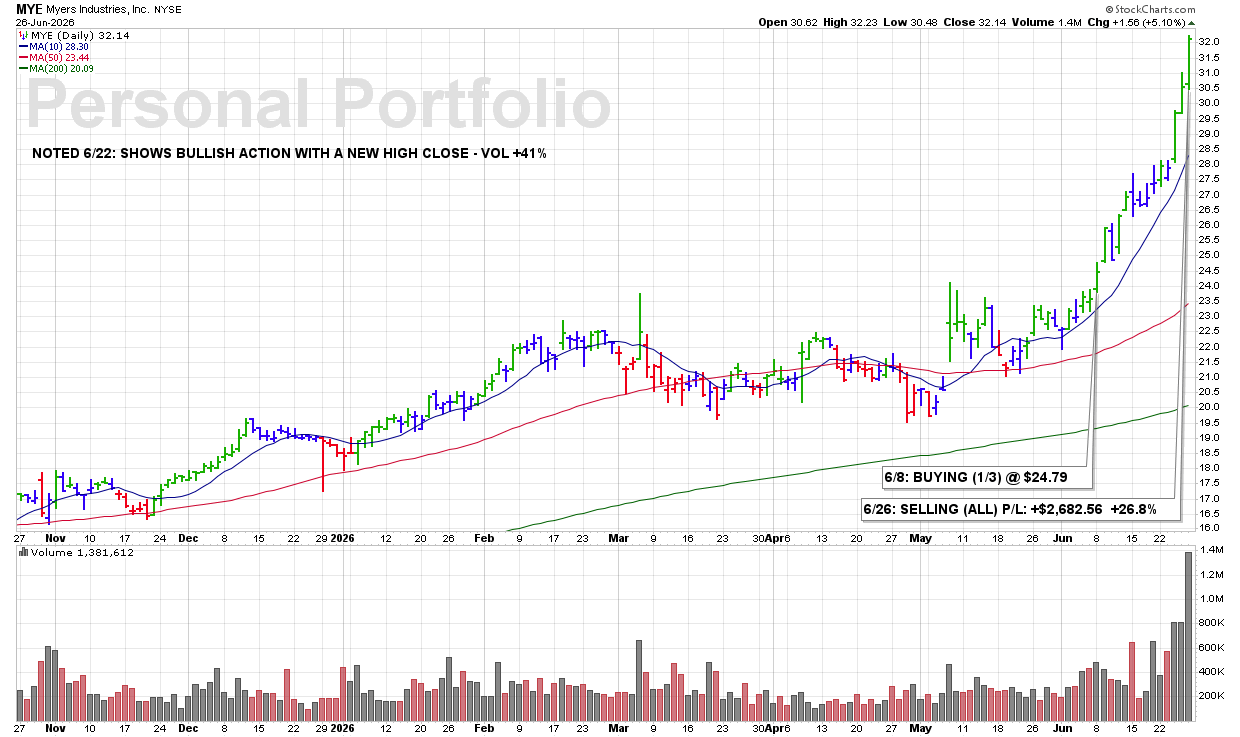
FRI 6/26: MYE – SELLING (ALL) P/L: +$2,682.56 +26.8%

3:44 PM – Selling all of my MYE as we head into the week’s close. As stated when I recently sold my TILE position, this sale may be premature as well. However, I am looking to book another confidence-building win.

My account is now well above all the major benchmarks and will close this week at an all-time Net Account Value. I am also reducing my near wide-open margin exposure as the S&P 500 continues to struggle technically and show bearish signs.

James’ Trader’s Tip: Protect Progress When You Have It

  • Big gains deserve to be converted into realized profits.

  • Reducing margin exposure after a strong run helps protect account equity.

  • When the broader market is showing technical weakness, locking in winners can be the smartest move.

CLICK/TAP CHART TO ZOOM
Chart services courtesy of stockcharts.com. Annotations by James Taulman.

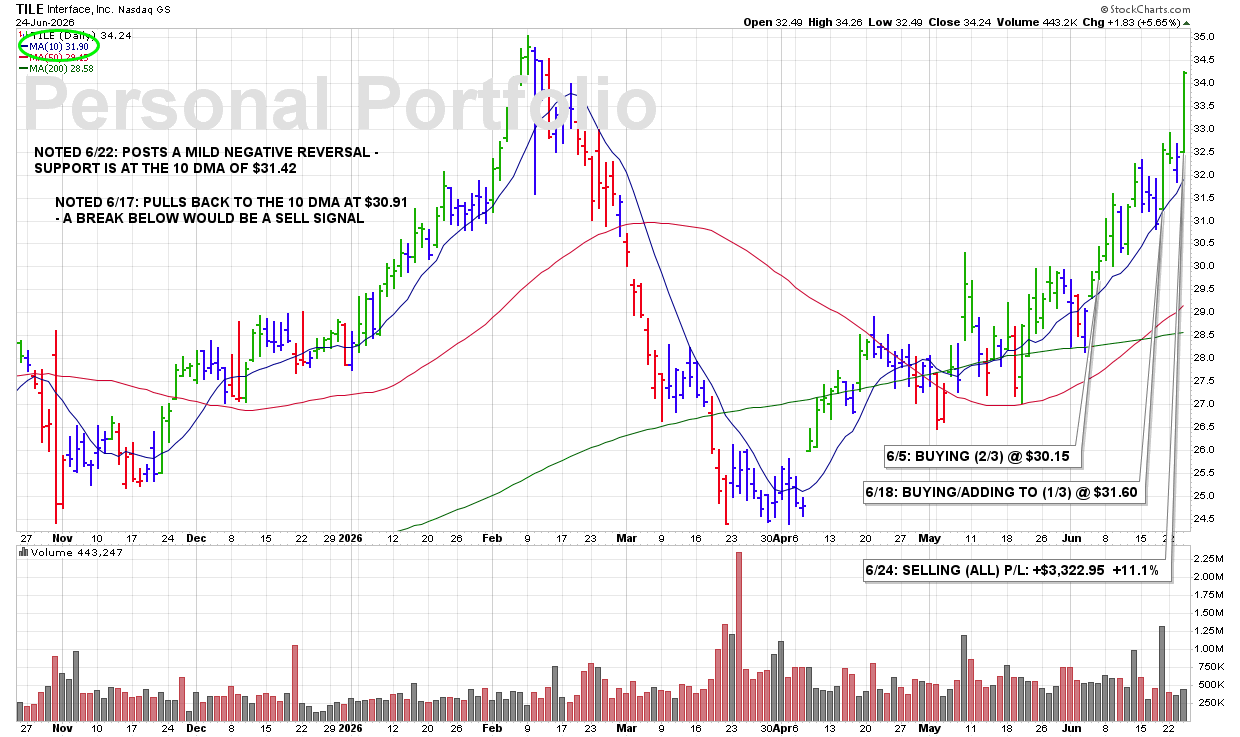
WED 6/24: TILE – SELLING (ALL) P/L: +$3,322.95 +11.1%

12:18 PM – Currently selling all of my TILE position as shares continue to advance on lighter volume, and get extended from the 10 DMA. This may be a bit premature, but with my overall portfolio lagging, I am looking to capture solid gains when I can. Locking in an +11.1% profit here gives me capital, flexibility, and a much-needed win.

James Trader’s Tip: Take the Win When It Matters

  • Sometimes portfolio context matters as much as the individual chart.

  • Capturing gains can help stabilize performance during a tougher stretch.

  • A realized profit gives you flexibility; an unrealized gain can disappear quickly.

CLICK/TAP CHART TO ZOOM
Chart services courtesy of stockcharts.com. Annotations by James Taulman.

TUE 6/23: TRV – BUYING (1/3) @ $314.18

3:47 PM – Decided to pick up some TRV as we head into today’s close. The stock actually broke out yesterday from our Traditional BreakOuts Watch List on good volume, but closed back below its TRIGGER PRICE. Today, however, it posted another day of constructive action, giving me more confidence to take a personal stake.

James’ Trader’s Tip: Not All Breakouts Are One-Day Events

  • Some breakouts require multiple attempts before gaining traction.

  • Follow-through after an initial breakout attempt is often a bullish sign.

  • Patience can sometimes provide a better entry than chasing the first move through resistance.

CLICK/TAP CHART TO ZOOM
Chart services courtesy of stockcharts.com. Annotations by James Taulman.

TUE 6/23: UNF – SELLING (ALL) P/L: -$515.16 -5.2%

3:47 PM – Selling the remainder of my UNF position here as the 10 DMA continues to act as resistance. We see this pattern time and time again when technical weakness develops. I’m not waiting for the next potential technical violation, which would likely be a break below the 50 DMA, currently at $261.37. I’d rather free up capital and redeploy it into stocks showing better technical conditions, such as TRV.

James’ Trader’s Tip: Resistance Is Just as Important as Support

  • A stock repeatedly failing at the 10 DMA is often a sign that buyers are losing control.

  • Former support levels frequently become resistance after they are broken.

  • When a stock cannot reclaim key moving averages, capital is often better deployed in stronger opportunities.

CLICK/TAP CHART TO ZOOM
Chart services courtesy of stockcharts.com. Annotations by James Taulman.

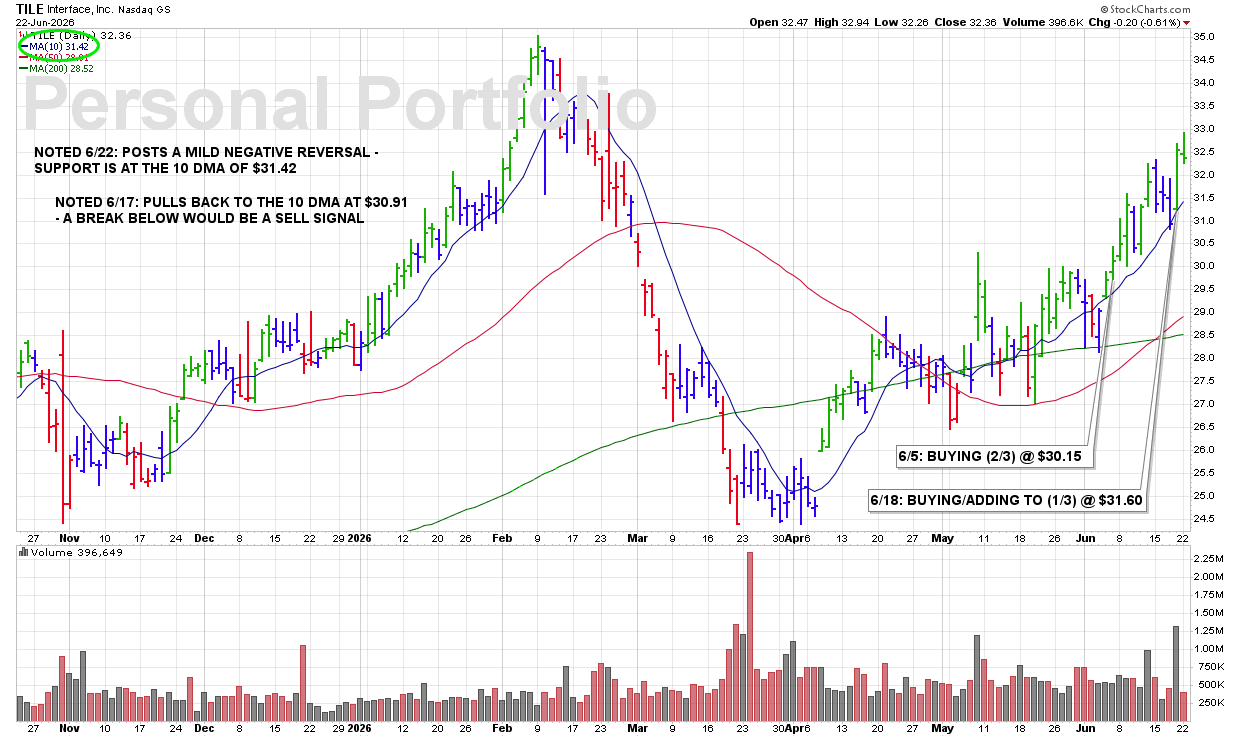
MON 6/22: TILE – Posts a Mild Negative Reversal – Support Is at the 10 DMA of $31.42

Latest Chart Update: TILE

9:15 PM – We are currently reporting on this stock as an active holding and continue to monitor the stock closely for any technical SELL SIGNALS.

The focus always remains on price/volume action around key support levels, including the 10 DMA, 50 DMA, and any nearby trendline or ROUND-$ support.

CLICK/TAP CHART TO ZOOM
Chart services courtesy of stockcharts.com. Annotations by James Taulman.

MON 6/22: MYE – Shows Bullish Action With a New High Close – Volume +41%

Latest Chart Update: MYE

9:10 PM – We are currently reporting on this stock as an active holding and continue to monitor the stock closely for any technical SELL SIGNALS.

The focus always remains on price/volume action around key support levels, including the 10 DMA, 50 DMA, and any nearby trendline or ROUND-$ support.

CLICK/TAP CHART TO ZOOM
Chart services courtesy of stockcharts.com. Annotations by James Taulman.

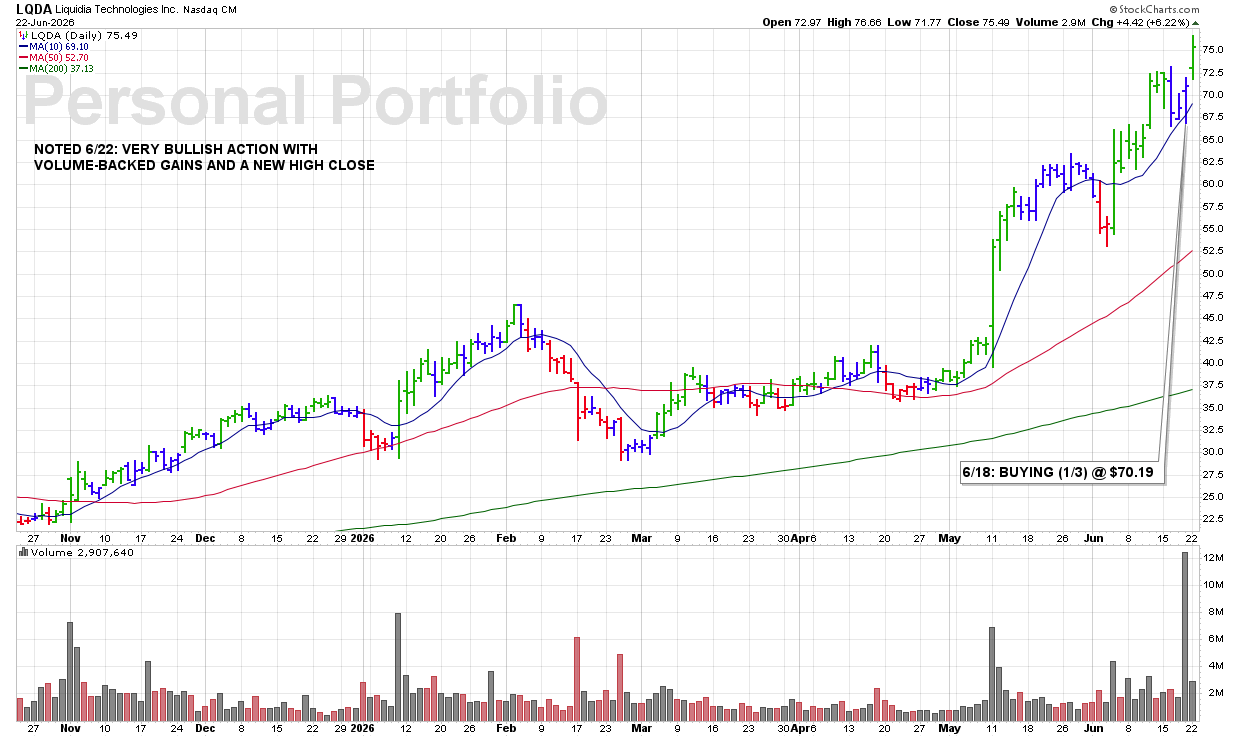
MON 6/22: LQDA – Very Bullish Action With Volume-Backed Gains and a New High Close

Latest Chart Update: LQDA

9:05 PM – We are currently reporting on this stock as an active holding and continue to monitor the stock closely for any technical SELL SIGNALS.

The focus always remains on price/volume action around key support levels, including the 10 DMA, 50 DMA, and any nearby trendline or ROUND-$ support.

CLICK/TAP CHART TO ZOOM
Chart services courtesy of stockcharts.com. Annotations by James Taulman.

MON 6/22: UNF – SELLING (1/3) P/L: -$415.01 -4.2%

3:45 PM – Selling another 1/3 of my UNF position as the 10 DMA continues to roll over. A declining 10 DMA is often an early sign that momentum is fading, and I want to continue reducing exposure as the stock’s technical condition deteriorates.

James’ Trader’s Tip: Pay Attention to the Direction of the Trend

  • Moving averages provide more information than just support and resistance levels.

  • A rising 10 DMA typically confirms a healthy uptrend, while a falling 10 DMA can signal weakening momentum.

  • When the trend begins to turn against you, reducing exposure can help preserve capital and flexibility.

CLICK/TAP CHART TO ZOOM
Chart services courtesy of stockcharts.com. Annotations by James Taulman.

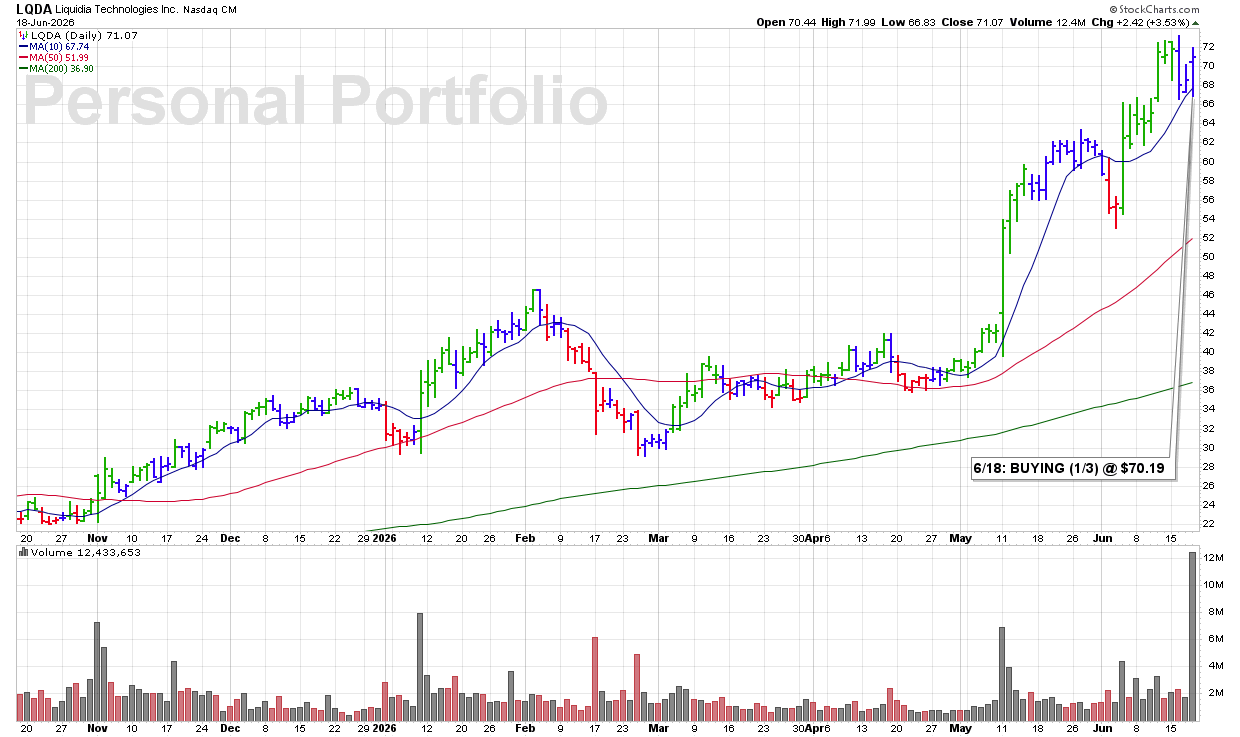
THU 6/18: LQDA – BUYING (1/3) @ $70.19

3:37 PM – Starting a position here in LQDA as the stock trades higher from its 10 DMA on above-average volume and begins to break above ROUND-$70. That combination of price strength and volume support is a technical BUY SIGNAL.

James’ Trader’s Tip: Round Numbers Often Matter

  • Round-number levels frequently act as support or resistance because traders watch them closely.

  • Stocks breaking above these levels on strong volume often attract additional buying interest.

  • When price, volume, and trend align, the odds of a successful breakout generally improve.

CLICK/TAP CHART TO ZOOM
Chart services courtesy of stockcharts.com. Annotations by James Taulman.

THU 6/18: TILE – BUYING/ADDING TO (1/3) @ $31.60

10:14 AM – Adding the final 1/3 to my position here as shares advance from the 10 DMA on above-average volume. The stock continues to act well technically, and today’s action supports completing the position.

Cost Basis Adjusted To: $30.88

James’ Trader’s Tip: Build Positions as Stocks Prove Themselves

  • Scaling into a position allows the stock to earn additional capital through positive action.

  • Advances from the 10 DMA often indicate continued institutional support.

  • Adding to strength can improve results while helping avoid oversized initial positions.

CLICK/TAP CHART TO ZOOM
Chart services courtesy of stockcharts.com. Annotations by James Taulman.

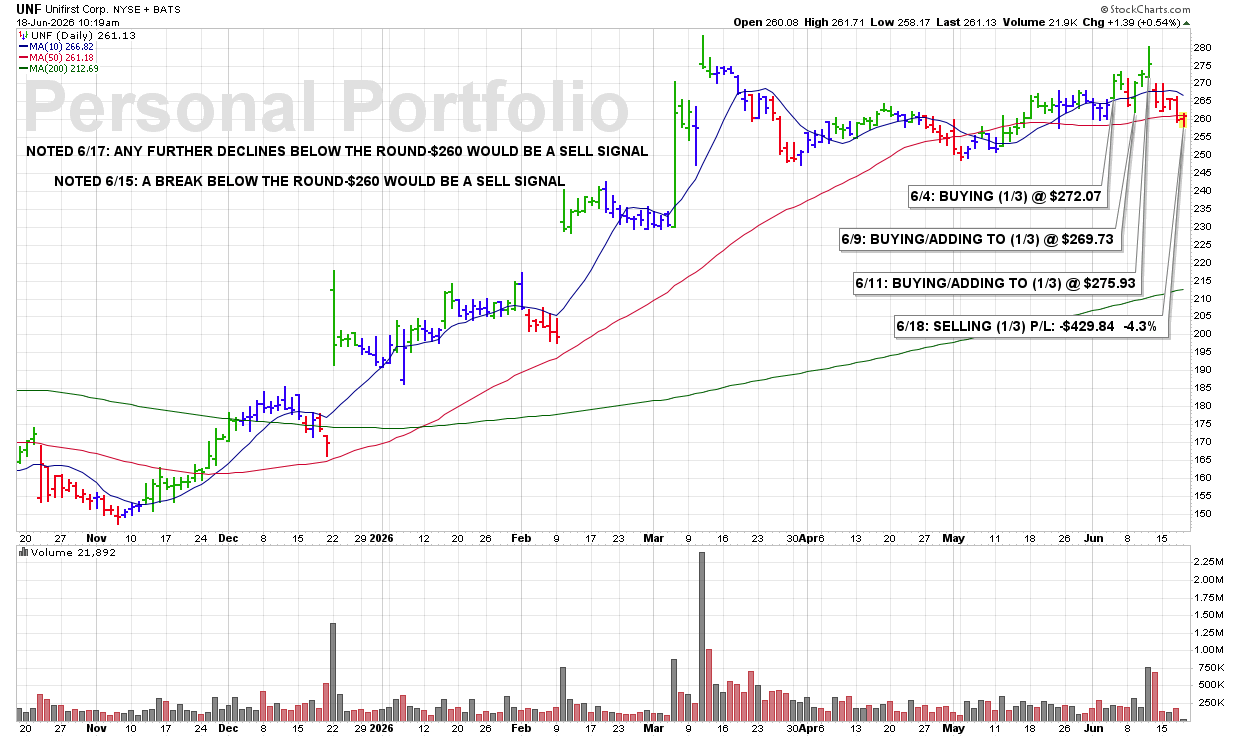
THU 6/18: UNF – SELLING (1/3) P/L: -$429.84 -4.3%

10:14 AM – I have to lighten up on UNF here as the stock is starting to break below support at ROUND-$260. I’m also looking to free up some capital to add to my TILE position, which is currently showing stronger technical action.

ULTRA Trader’s Tip: Capital Should Flow to Strength

  • Not all positions deserve the same amount of capital.

  • When one stock weakens while another strengthens, reallocating capital can improve portfolio efficiency.

  • Successful portfolio management is often about where your money is working best today, not where it was working best yesterday.

CLICK/TAP CHART TO ZOOM
Chart services courtesy of stockcharts.com. Annotations by James Taulman.

WED 6/17: WBS – Broke Out Above the Round-$75 Today and Triggered a Buy Signal

Latest Chart Update: WBS

9:20 PM – We are currently reporting on this stock as an active holding and continue to monitor the stock closely for any technical SELL SIGNALS.

The focus always remains on price/volume action around key support levels, including the 10 DMA, 50 DMA, and any nearby trendline or ROUND-$ support.

CLICK/TAP CHART TO ZOOM
Chart services courtesy of stockcharts.com. Annotations by James Taulman.

WED 6/17: TILE – Pulls Back to the 10 DMA at $30.91 – a Break Below Would Be a Sell Signal

Latest Chart Update: TILE

9:10 PM – We are currently reporting on this stock as an active holding and continue to monitor the stock closely for any technical SELL SIGNALS.

The focus always remains on price/volume action around key support levels, including the 10 DMA, 50 DMA, and any nearby trendline or ROUND-$ support.

CLICK/TAP CHART TO ZOOM
Chart services courtesy of stockcharts.com. Annotations by James Taulman.

WED 6/17: UNF – Any Further Declines Below the Round-$260 Would Be a Sell Signal

Latest Chart Update: UNF

9:05 PM -We are currently reporting on this stock as an active holding and continue to monitor the stock closely for any technical SELL SIGNALS.

The focus always remains on price/volume action around key support levels, including the 10 DMA, 50 DMA, and any nearby trendline or ROUND-$ support.

CLICK/TAP CHART TO ZOOM
Chart services courtesy of stockcharts.com. Annotations by James Taulman.

WED 6/17: WBS – BUYING (1/3) @ $76.01

10:57 AM – Going to pick up some WBS this morning as the stock breaks above ROUND-$76 with an increase in volume. The combination of a breakout through resistance and expanding volume is a constructive technical signal and warrants starting a 1/3 position.

ULTRA Trader’s Tip: Breakouts Need Participation

  • Price alone is good, but price plus volume is better.

  • Increased volume suggests that larger investors may be participating in the move.

  • The strongest breakouts tend to attract additional buyers after resistance is cleared.

CLICK/TAP CHART TO ZOOM
Chart services courtesy of stockcharts.com. Annotations by James Taulman.

MON 6/15: UNF – A Break Below the Round-$260 Would Be a Sell Signal

Latest Chart Update: UNF

9:25 PM -We are currently reporting on this stock as an active holding and continue to monitor the stock closely for any technical SELL SIGNALS.

The focus always remains on price/volume action around key support levels, including the 10 DMA, 50 DMA, and any nearby trendline or ROUND-$ support.

CLICK/TAP CHART TO ZOOM
Chart services courtesy of stockcharts.com. Annotations by James Taulman.

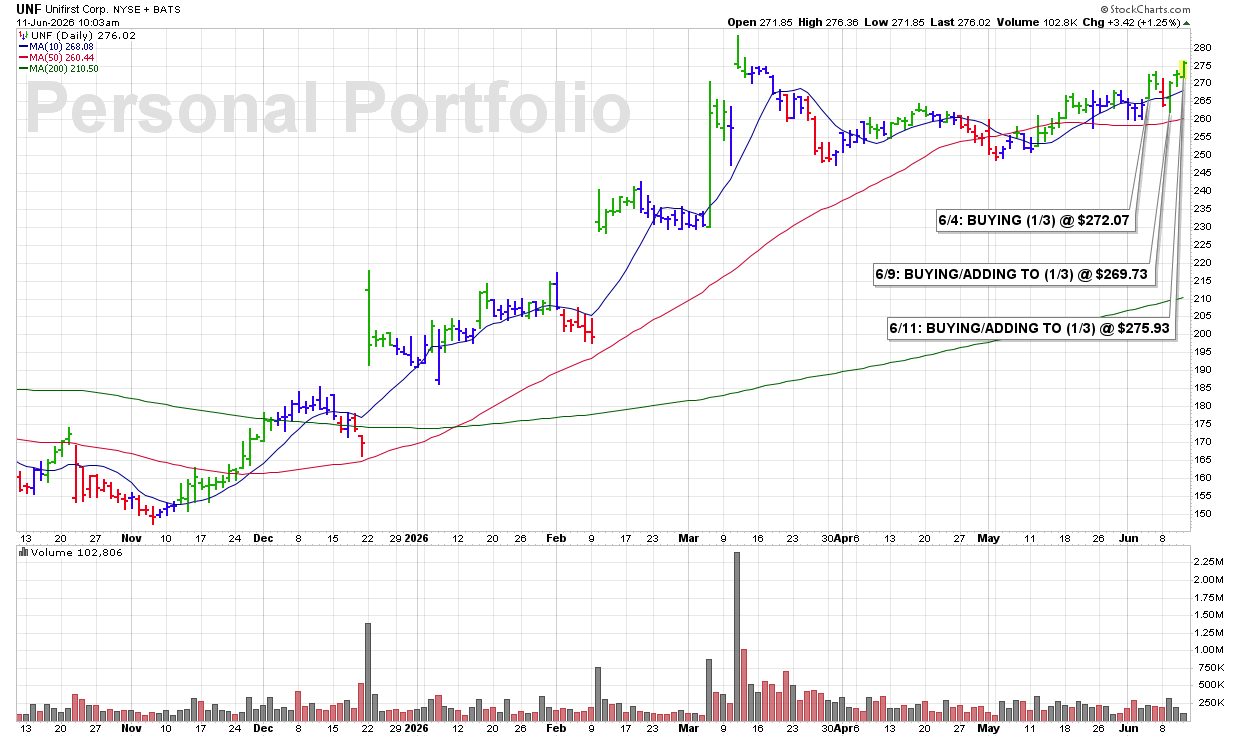
THU 6/11: UNF – BUYING/ADDING TO (1/3) @ $275.93

10:00 AM – Shares are again advancing on strong volume. I’m adding a final 1/3 position here before price potentially becomes too extended from the 10 DMA. My average buy price is now $272.54.

James’ Trader’s Tip: Add to Strength, Not Weakness

  • Additional purchases should be earned through positive price action.

  • Stocks advancing on volume demonstrate continued institutional demand.

  • Scaling into a winner can be far more effective than averaging down in a loser.

CLICK/TAP CHART TO ZOOM
Chart services courtesy of stockcharts.com. Annotations by James Taulman.

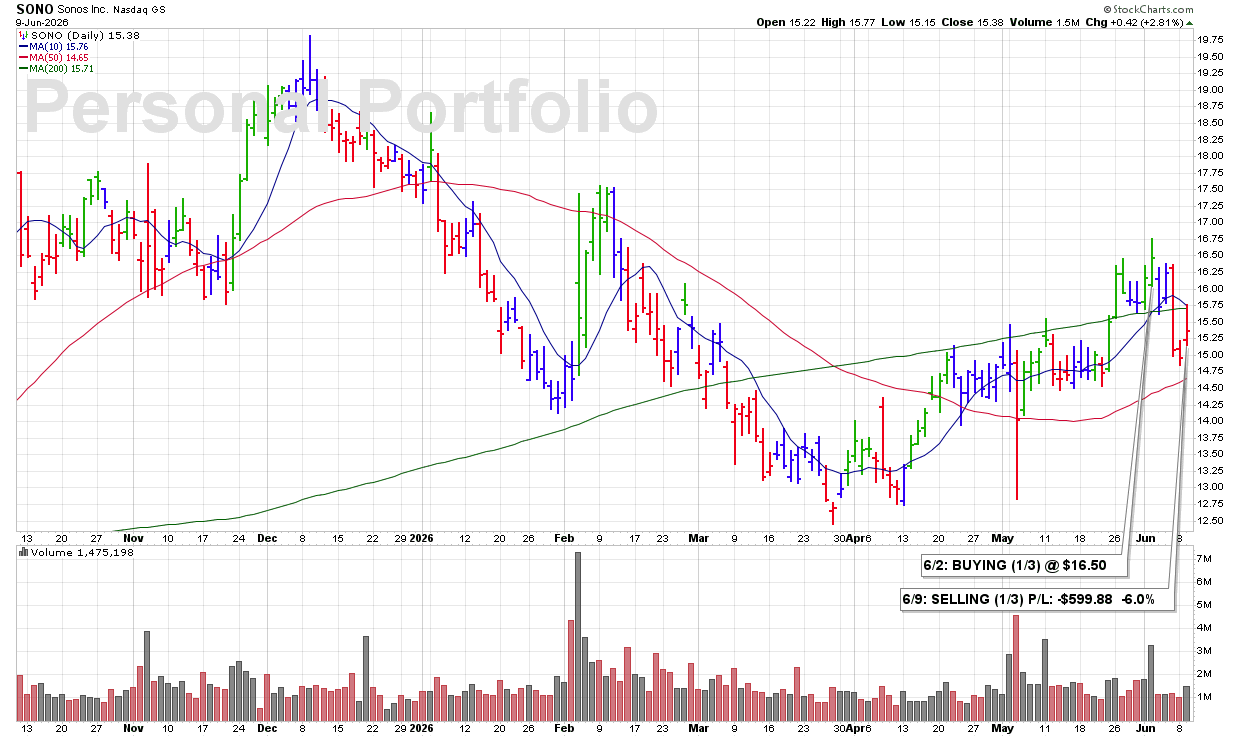
TUE 6/9: SONO – SELLING (ALL) P/L: -$599.88 -6.0%

3:45 PM – Selling all of my SONO here as we head into the close. The stock was essentially turned back from its 10 DMA today, while that line is beginning to roll over. That combination is a bearish technical development and warrants an exit.

James’ Trader’s Tip: Watch the Slope of the 10 DMA

  • A rising 10 DMA typically supports advancing stocks.

  • When the line begins to flatten or turn lower, momentum may be fading.

  • Stocks rejected at a declining 10 DMA often face additional selling pressure in the days ahead.

CLICK/TAP CHART TO ZOOM
Chart services courtesy of stockcharts.com. Annotations by James Taulman.

TUE 6/9: UNF – BUYING/ADDING TO (1/3) @ $269.73

3:45 PM – Shares are advancing this afternoon and appear headed for a solid close, with volume running +48% above average. I’m going to take that as confirmation of institutional demand and add another 1/3 to my current position.

James’ Trader’s Tip: Let Volume Guide the Decision

  • Price gains become more meaningful when accompanied by expanding volume.

  • Strong closes often indicate buyers remained active throughout the session.

  • Adding to positions after confirmation is generally safer than anticipating the move beforehand.

CLICK/TAP CHART TO ZOOM
Chart services courtesy of stockcharts.com. Annotations by James Taulman.

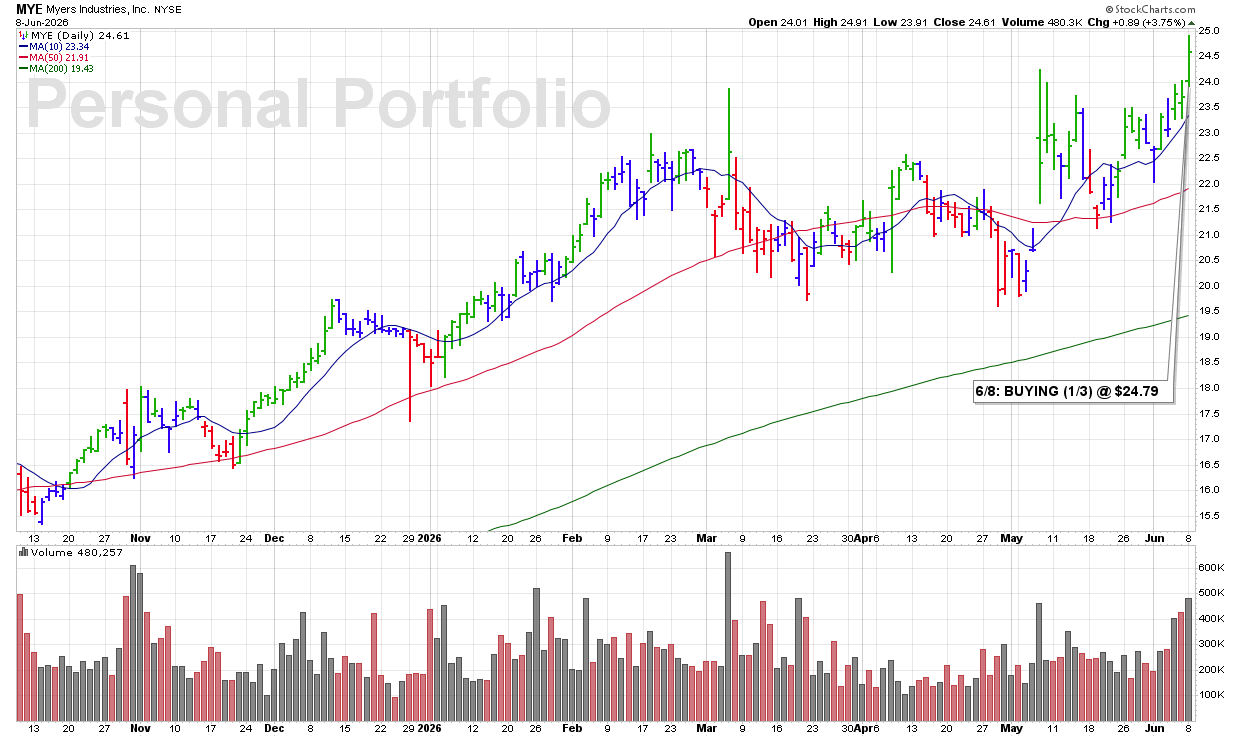
MON 6/8: MYE – BUYING (1/3) @ $24.79

3:31 PM – Buying a 1/3 stake in MYE as the stock has just broken out to new all-time highs on volume running at roughly twice the normal rate. That combination of price and volume strength is a powerful technical BUY SIGNAL.

ULTRA Trader’s Tip: New Highs Are a Sign of Strength

  • Stocks making new all-time highs have no overhead resistance from prior buyers.

  • Heavy volume suggests institutions are actively accumulating shares.

  • The strongest stocks often look expensive before they move even higher.

CLICK/TAP CHART TO ZOOM
Chart services courtesy of stockcharts.com. Annotations by James Taulman.

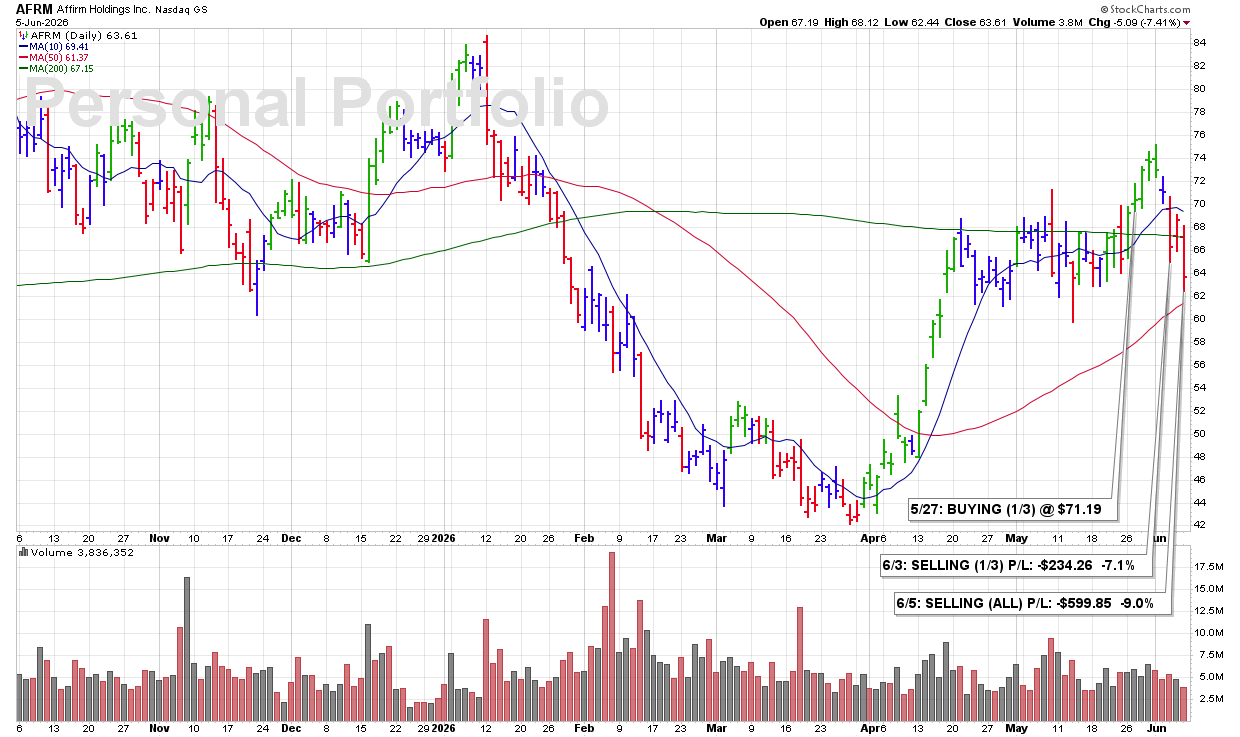
FRI 6/5: AFRM – SELLING (ALL) P/L: -$599.85 -9.0%

10:57 AM – Selling all of my AFRM this morning as the stock continues to show bearish technical signs. After recently breaking below the 10 DMA and 200 DMA, the stock has failed to stabilize and continues to deteriorate.

ULTRA Trader’s Tip: Capital Preservation Comes First

  • Strong traders focus as much on protecting capital as they do on making profits.

  • When a stock continues showing technical weakness, hope is not a strategy.

  • Exiting losing positions quickly keeps you financially and emotionally prepared for the next opportunity.

CLICK/TAP CHART TO ZOOM
Chart services courtesy of stockcharts.com. Annotations by James Taulman.

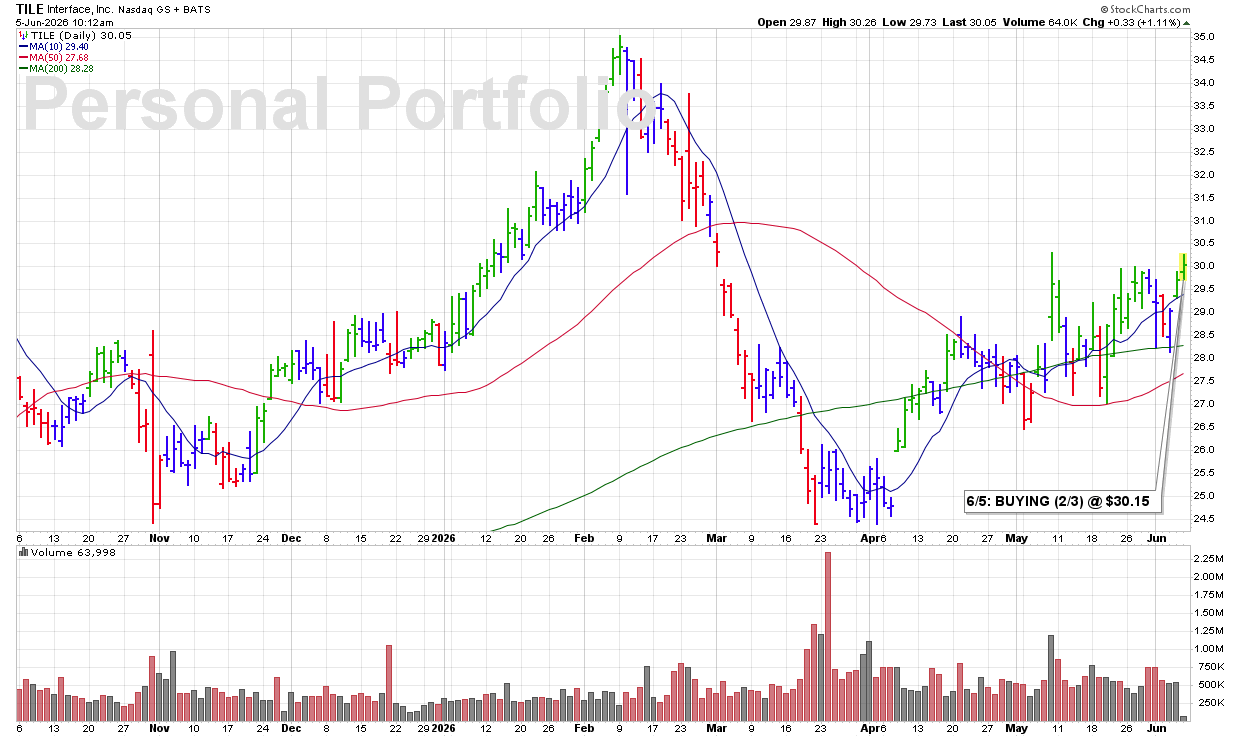
FRI 6/5: TILE – BUYING (2/3) @ $30.15

10:06 AM – Starting with a 2/3 position in TILE this morning. Technically, the stock looks constructive as it begins to break out above ROUND-$30. With available cash and buying power on hand, I’m taking a larger-than-normal initial position.

ULTRA Trader’s Tip: Position Size Can Reflect Conviction

  • Not every trade has to begin with a 1/3 position.

  • Larger initial positions may be appropriate when both the setup and available capital align.

  • Position sizing is a risk-management tool and should be adjusted thoughtfully, not emotionally.

CLICK/TAP CHART TO ZOOM
Chart services courtesy of stockcharts.com. Annotations by James Taulman.

THU 6/4: UNF – BUYING (1/3) @ $272.07

10:14 AM – Starting a 1/3 position in UNF as the stock breaks out this morning. This is primarily a technical-based buy, as the fundamentals do not align as closely with my normal guidelines. However, the breakout action and price strength are sufficient to warrant an initial position.

James’ Trader’s Tip: Not Every Buy Has to Be Perfect

  • Trading is about probabilities, not perfection.

  • Occasionally a stock will check more boxes on the technical side than the fundamental side.

  • When price and volume are sending a clear signal, an initial position can be justified while you continue to monitor the story.

CLICK/TAP CHART TO ZOOM
Chart services courtesy of stockcharts.com. Annotations by James Taulman.

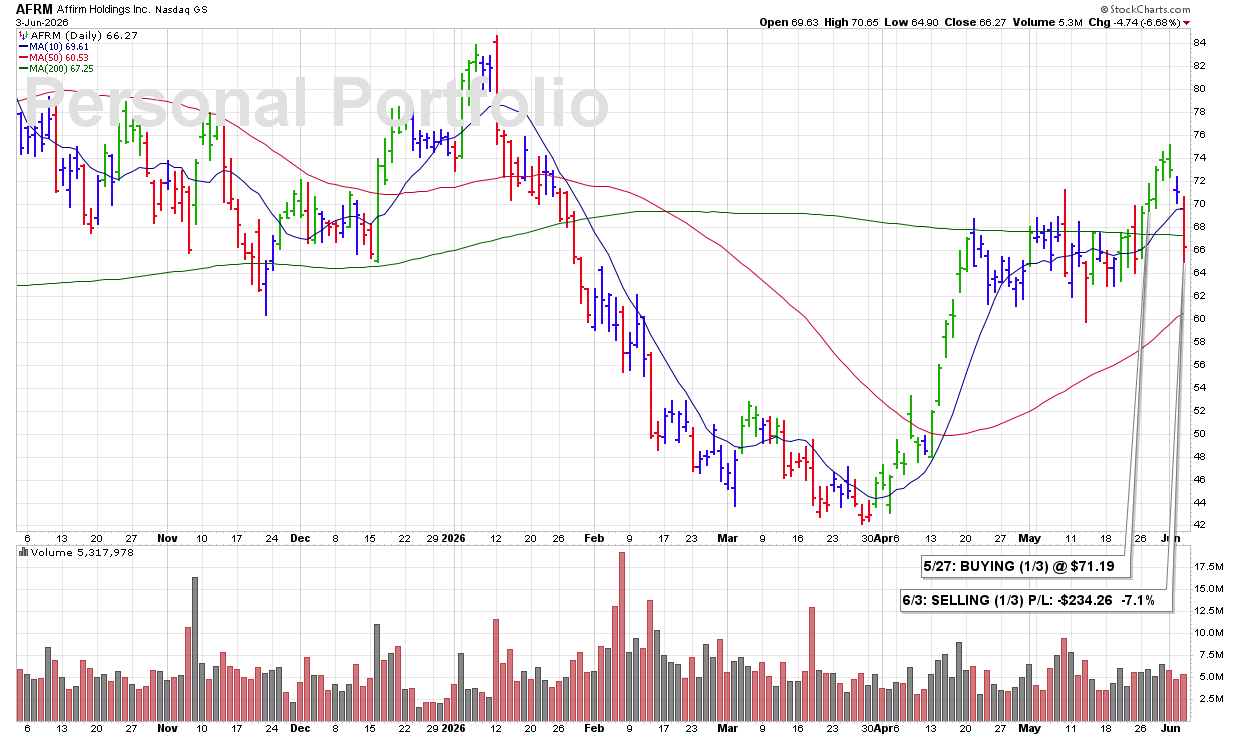
WED 6/3: AFRM – SELLING (1/3) P/L: -$234.26 -7.1%

2:27 PM – The stock sliced through its 10 DMA and also fell below its 200 DMA. Those are significant technical violations and trigger a SELL SIGNAL under our rules.

James’ Trader’s Tip: Respect the Major Moving Averages

  • The 10 DMA measures short-term momentum, while the 200 DMA reflects the longer-term trend.

  • When both levels fail, the chart is signaling a meaningful change in character.

  • Reducing exposure after major technical violations helps preserve capital and maintain discipline.

CLICK/TAP CHART TO ZOOM
Chart services courtesy of stockcharts.com. Annotations by James Taulman.

WED 6/3: NSIT – SELLING (ALL) P/L: +$641.03 +12.7%

9:37 AM – Selling the remainder of my NSIT position this morning as the ROUND-$120 level has become resistance, as previously noted. Shares had failed to reclaim that line yesterday and a selling off from there today, making it a logical spot to lock in the remaining gain and redeploy capital elsewhere.

SELL SIGNALS:
6/1 (1/2) @ +16.2%
6/3 (ALL) @ +12.7%

James’ Trader’s Tip: Taking Profits Into Resistance

  • Prior support often becomes resistance.

  • When a stock repeatedly fails at a known resistance level, it may signal waning momentum.

  • Protecting gains is just as important as finding good entries. Capital preserved can be redeployed into stronger opportunities.

CLICK/TAP CHART TO ZOOM
Chart services courtesy of stockcharts.com. Annotations by James Taulman.