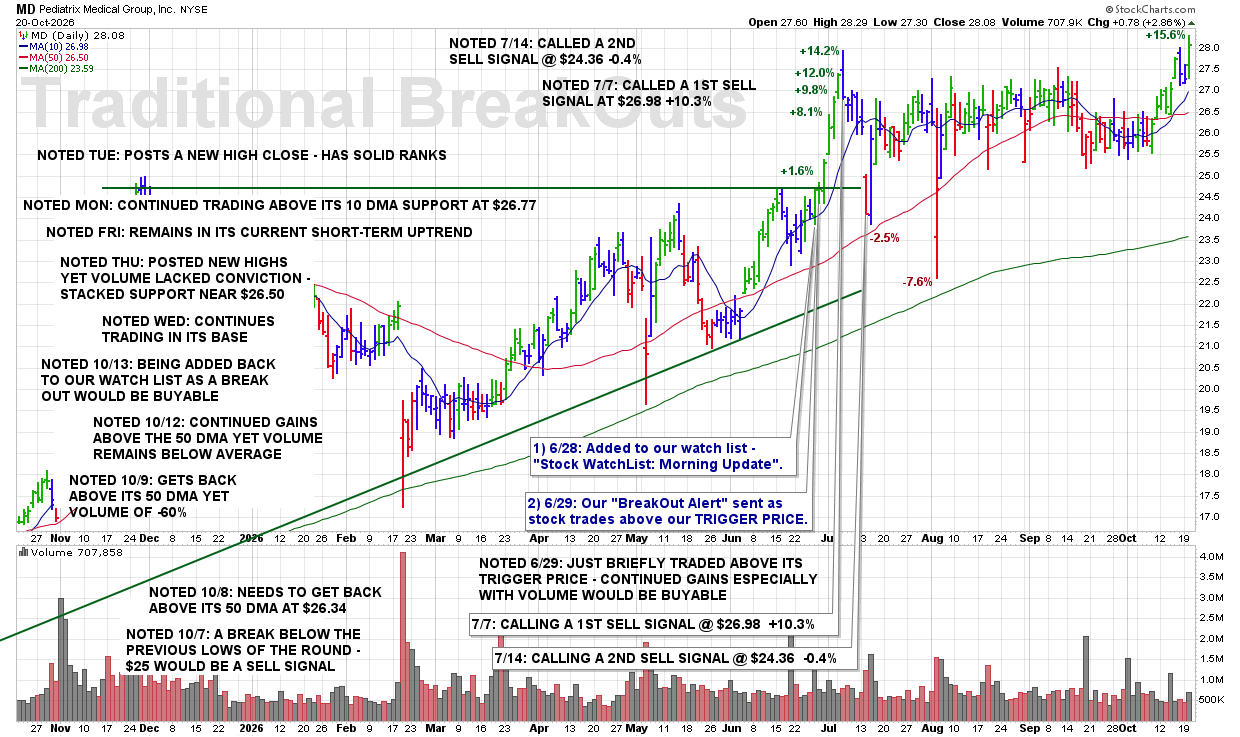
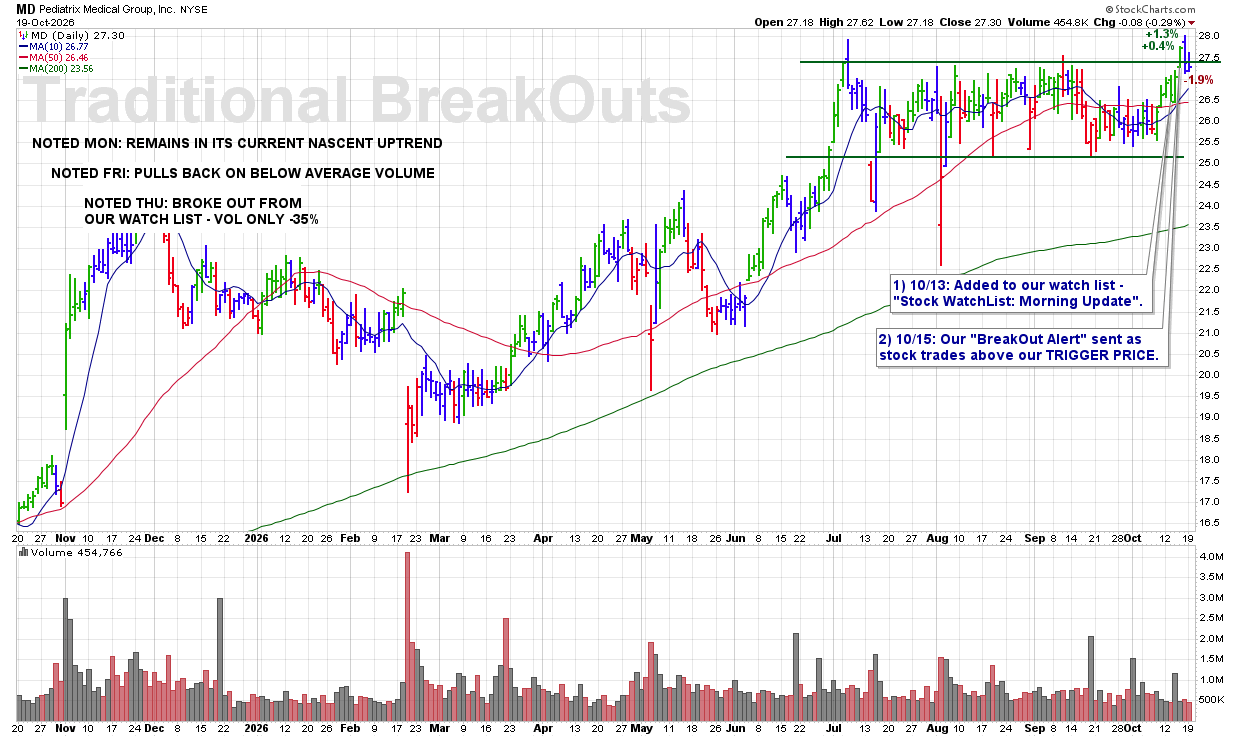
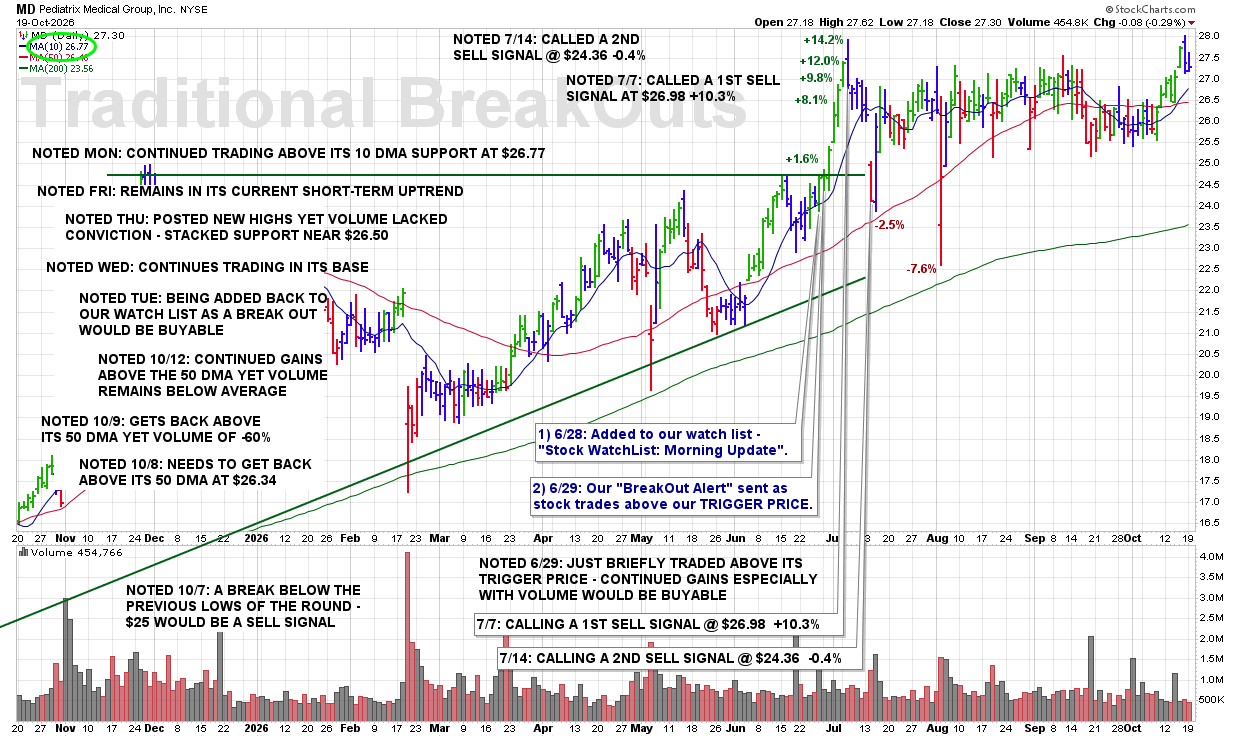
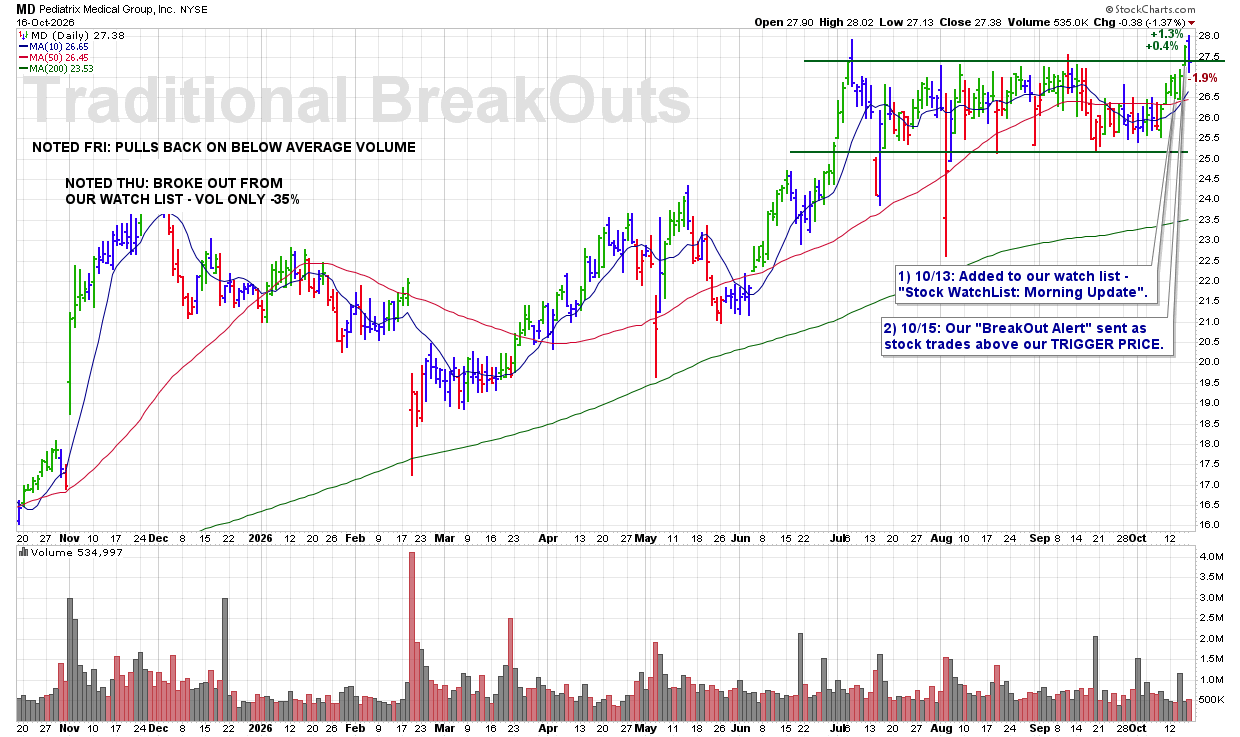
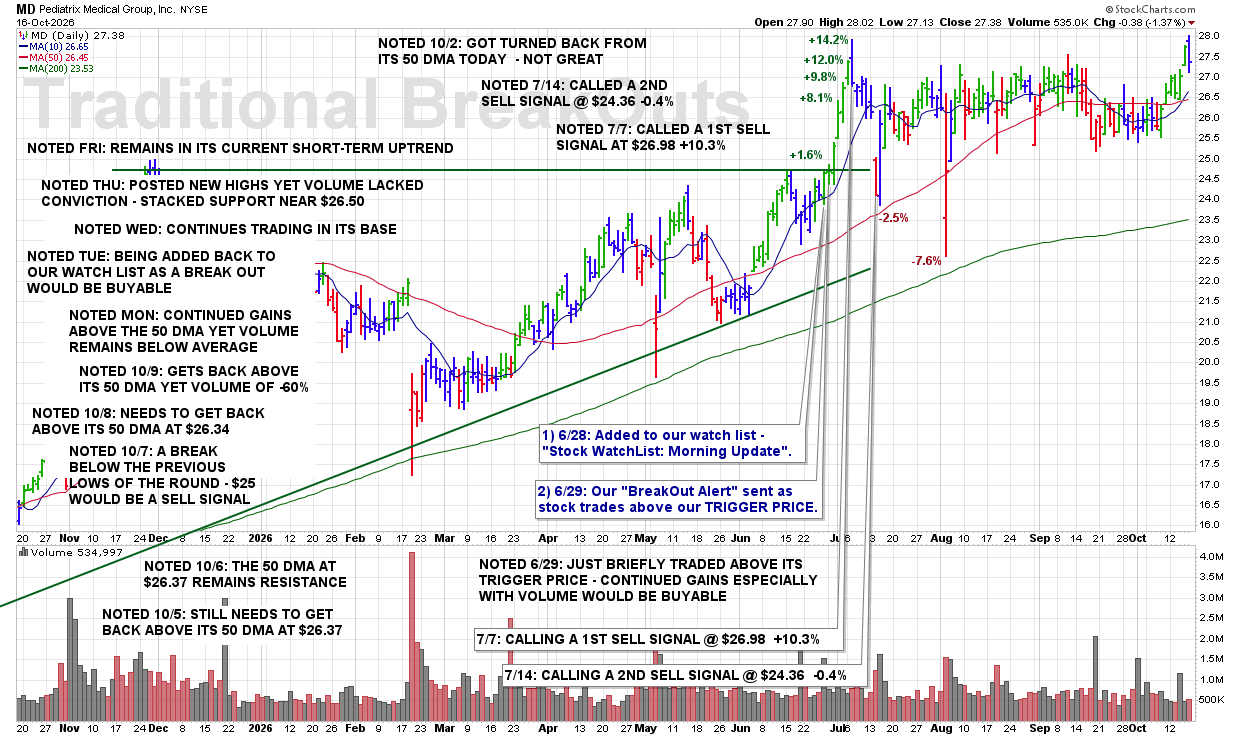
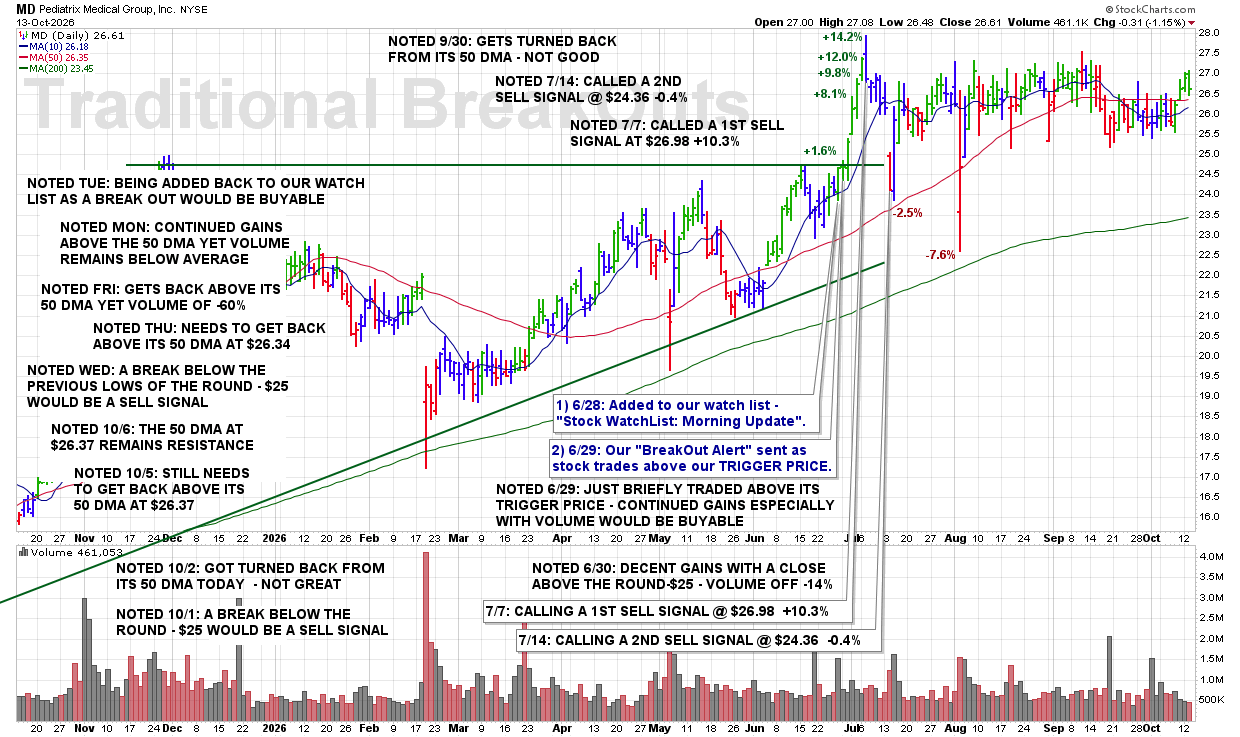
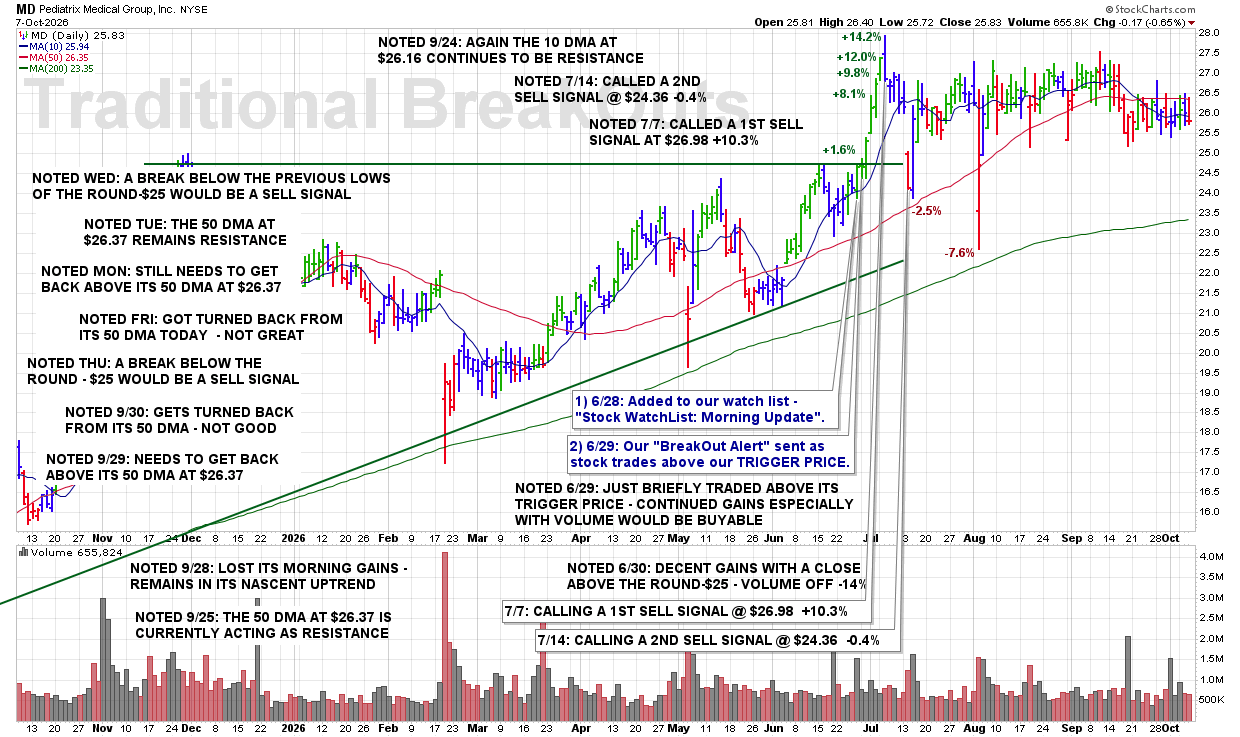
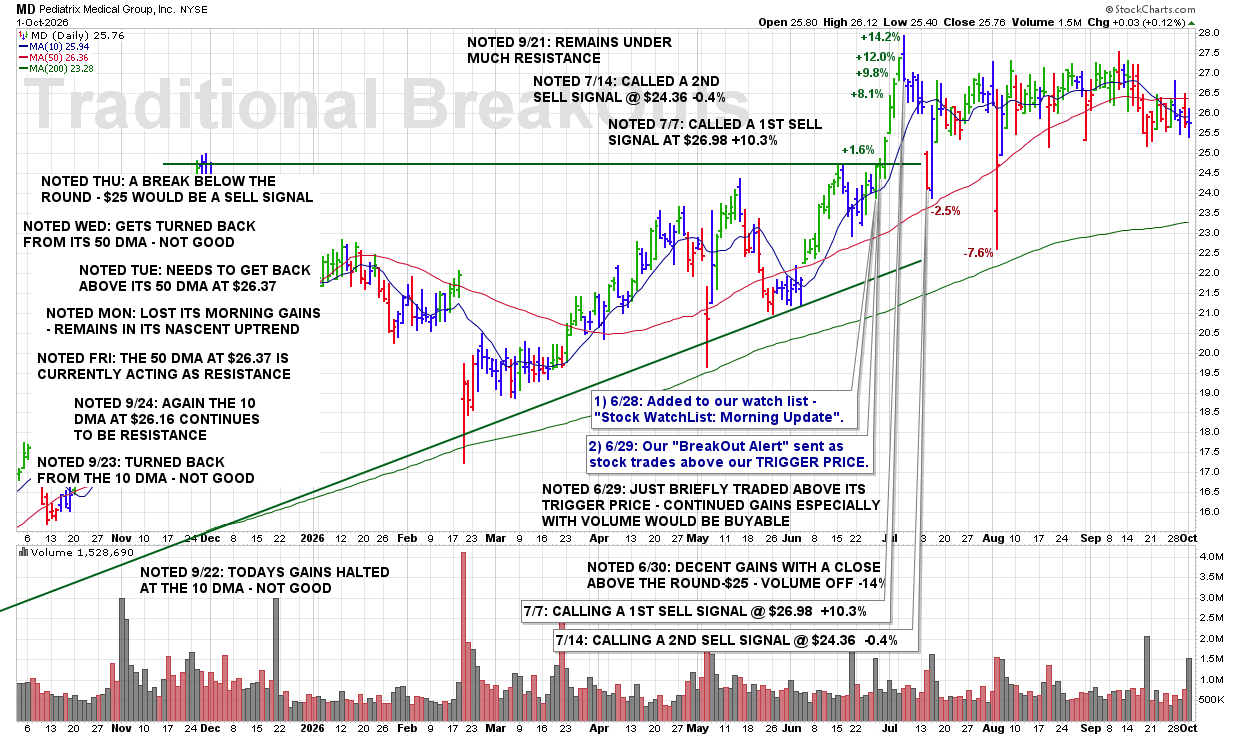
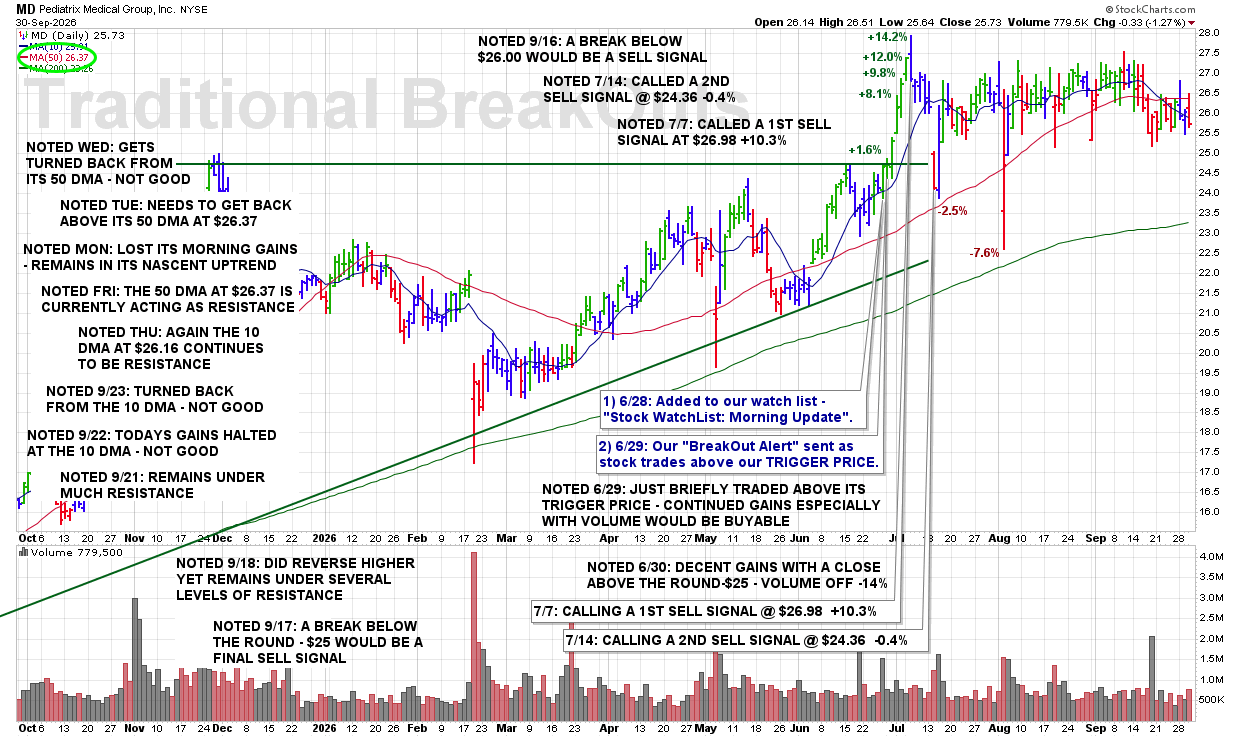
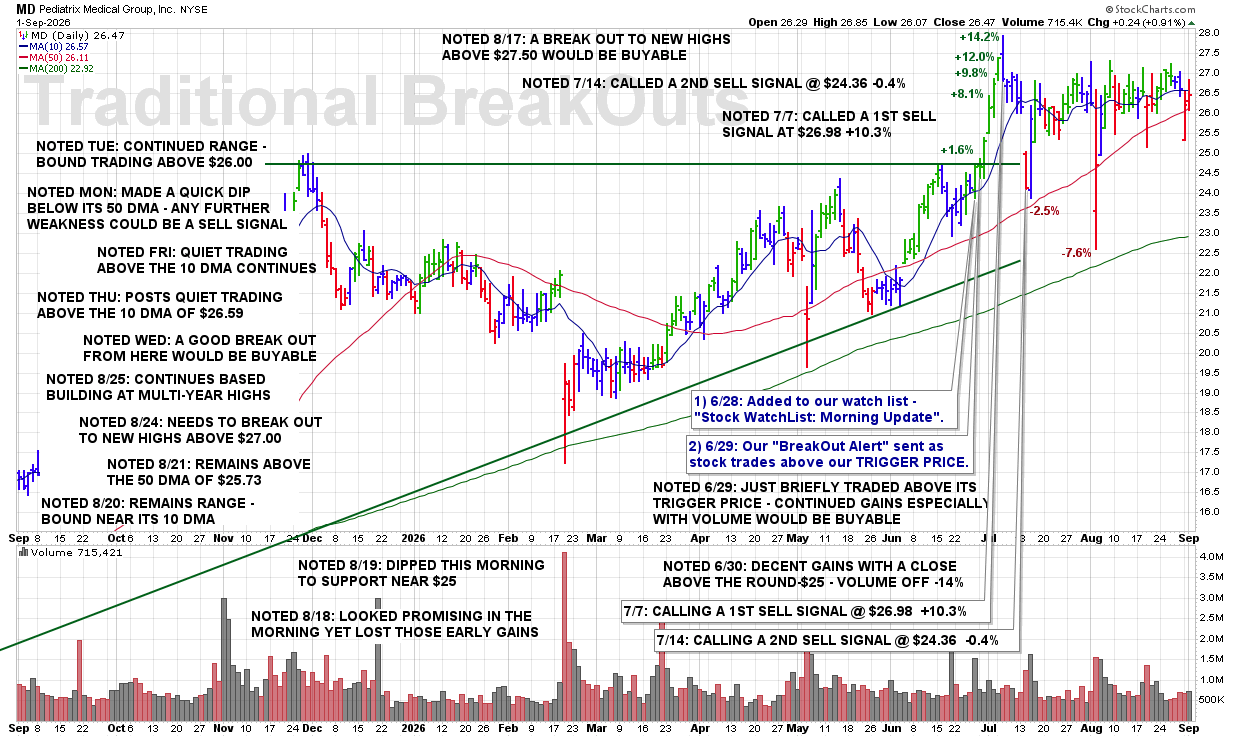
TUE 9/29: MD – Needs to Get Back Above Its 50 DMA at $26.37

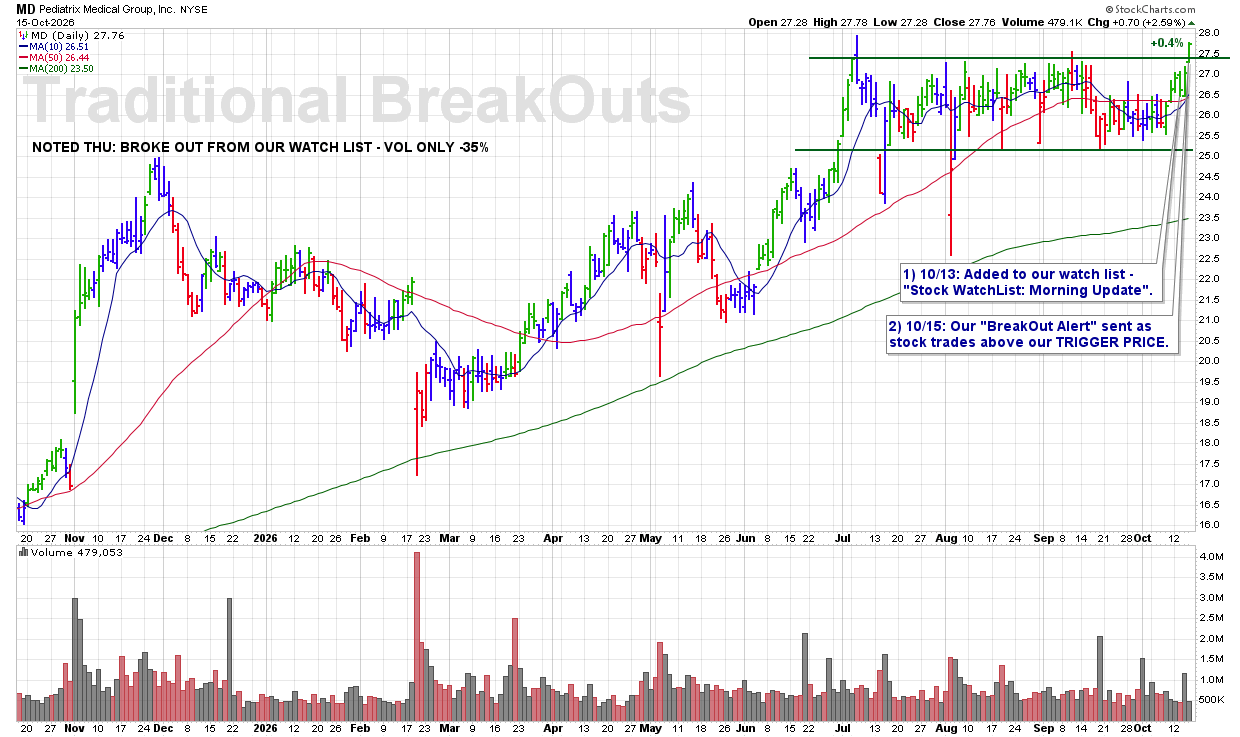
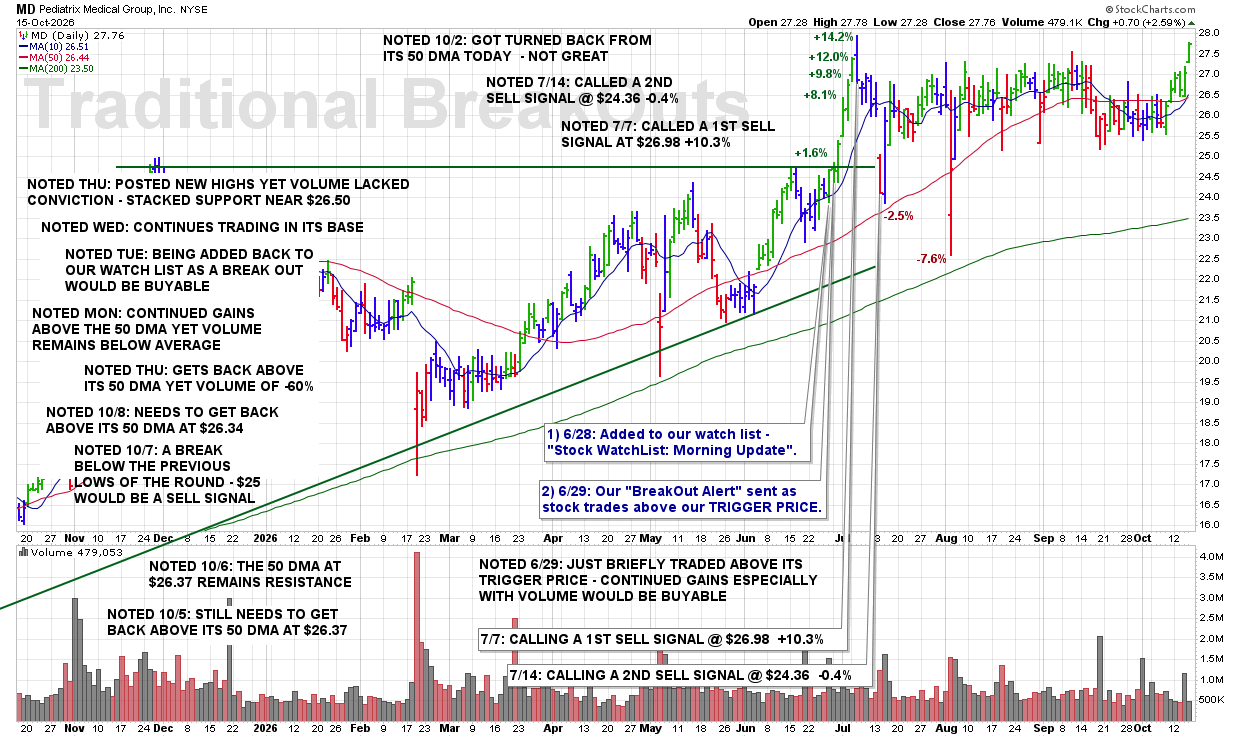
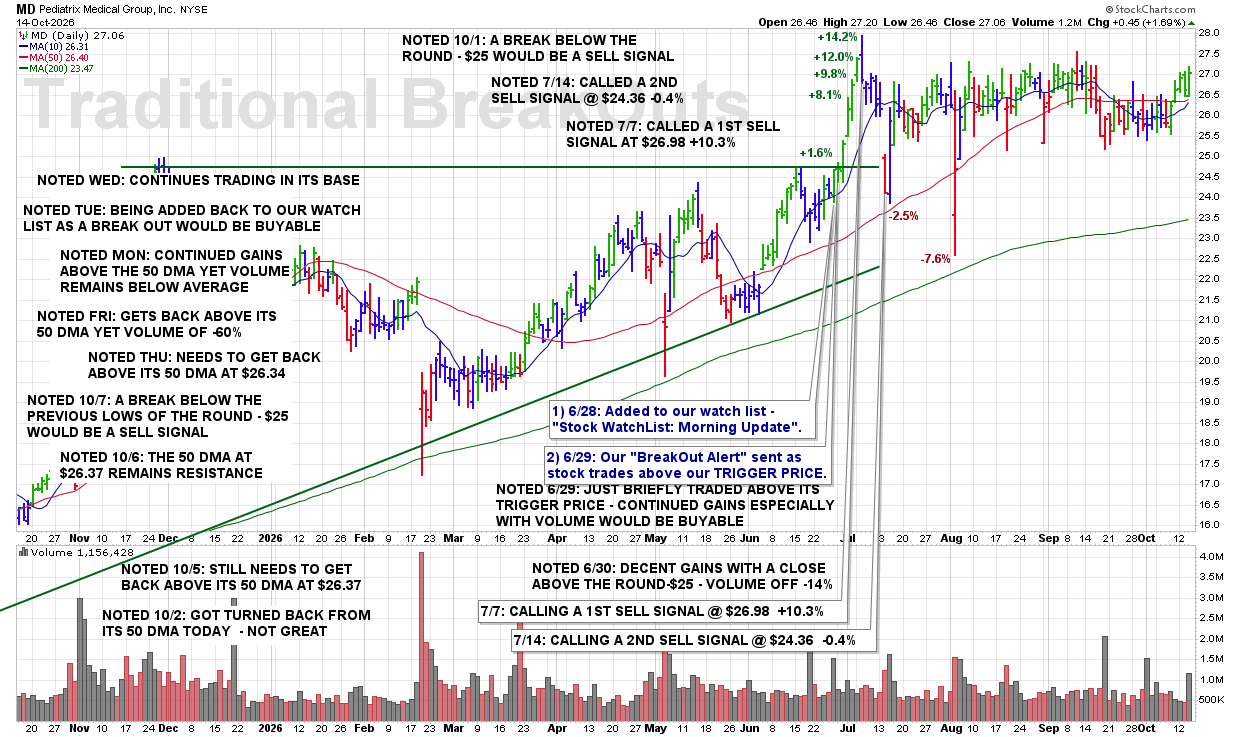
7:20 PM – Here is our latest chart update for this recent breakout from our Traditional BreakOuts Watch List.
CLICK/TAP CHART TO ZOOM
Chart services courtesy of stockcharts.com. Annotations by James Taulman.

We are currently reporting on this stock as an active holding and continue to monitor the stock closely for any technical SELL SIGNALS.

The focus always remains on price/volume action around key support levels, including the 10 DMA, 50 DMA, and any nearby trendline or ROUND-$ support.

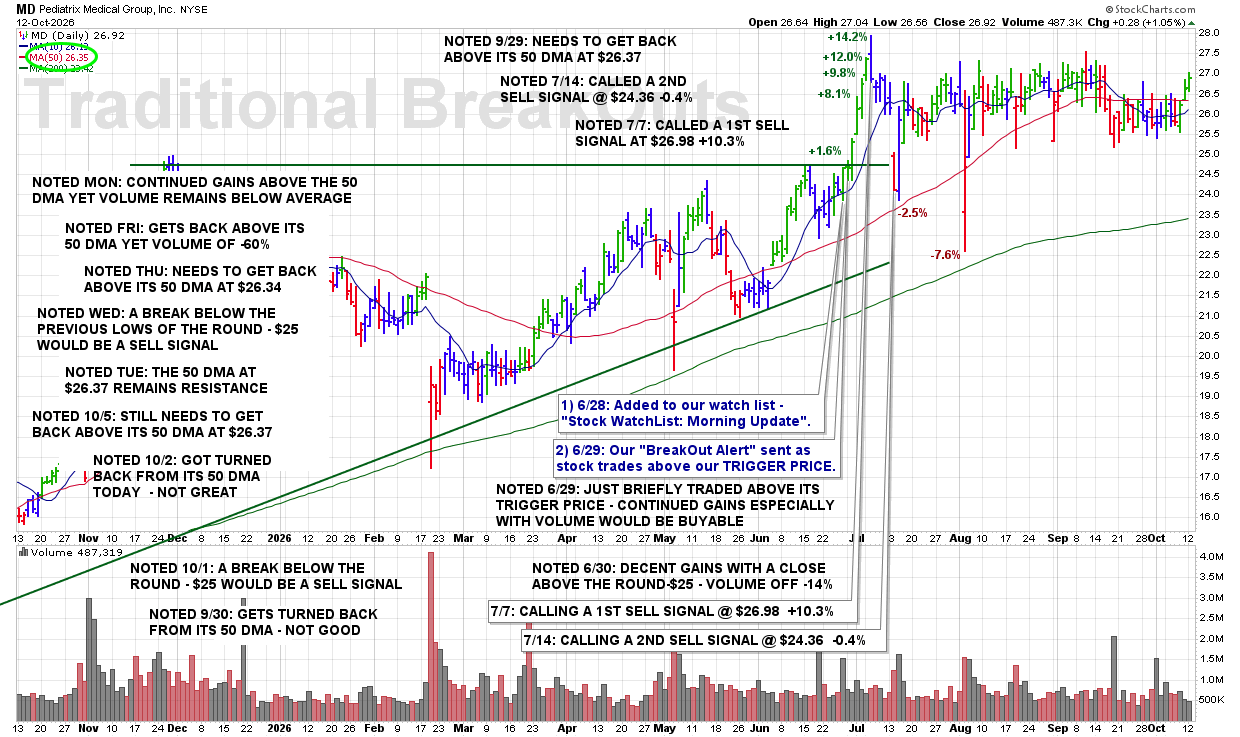
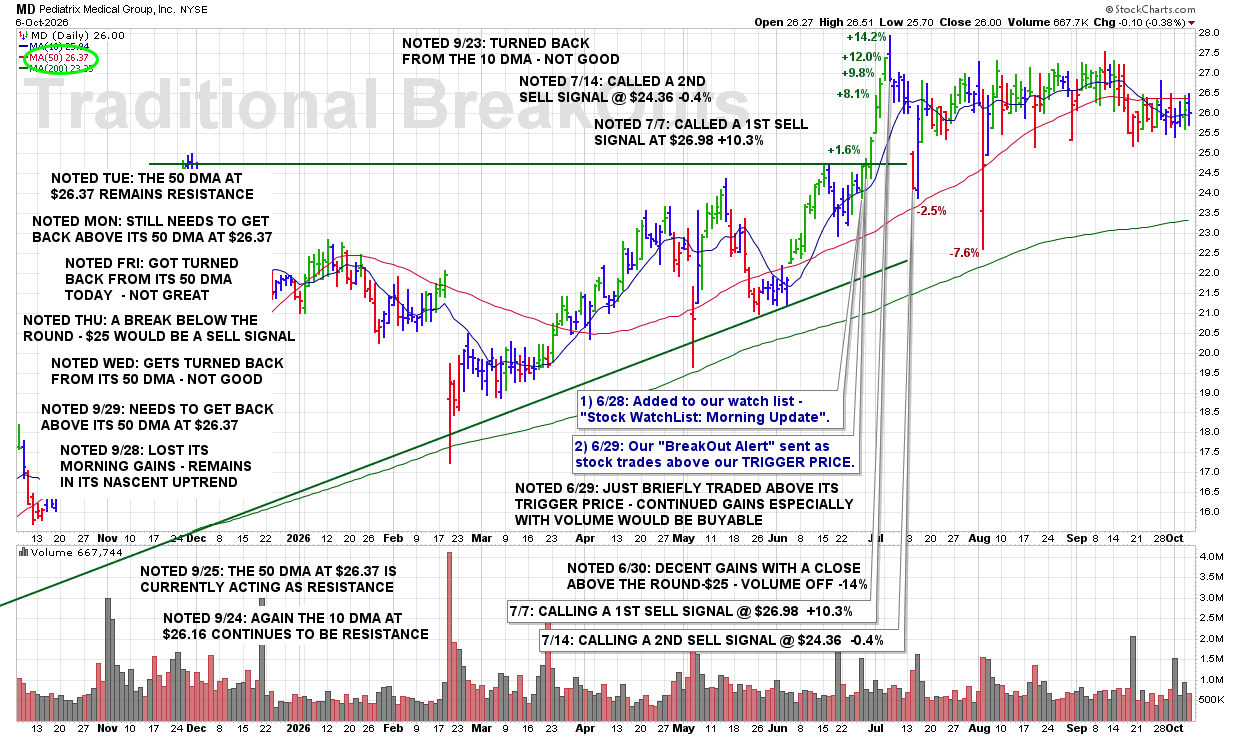
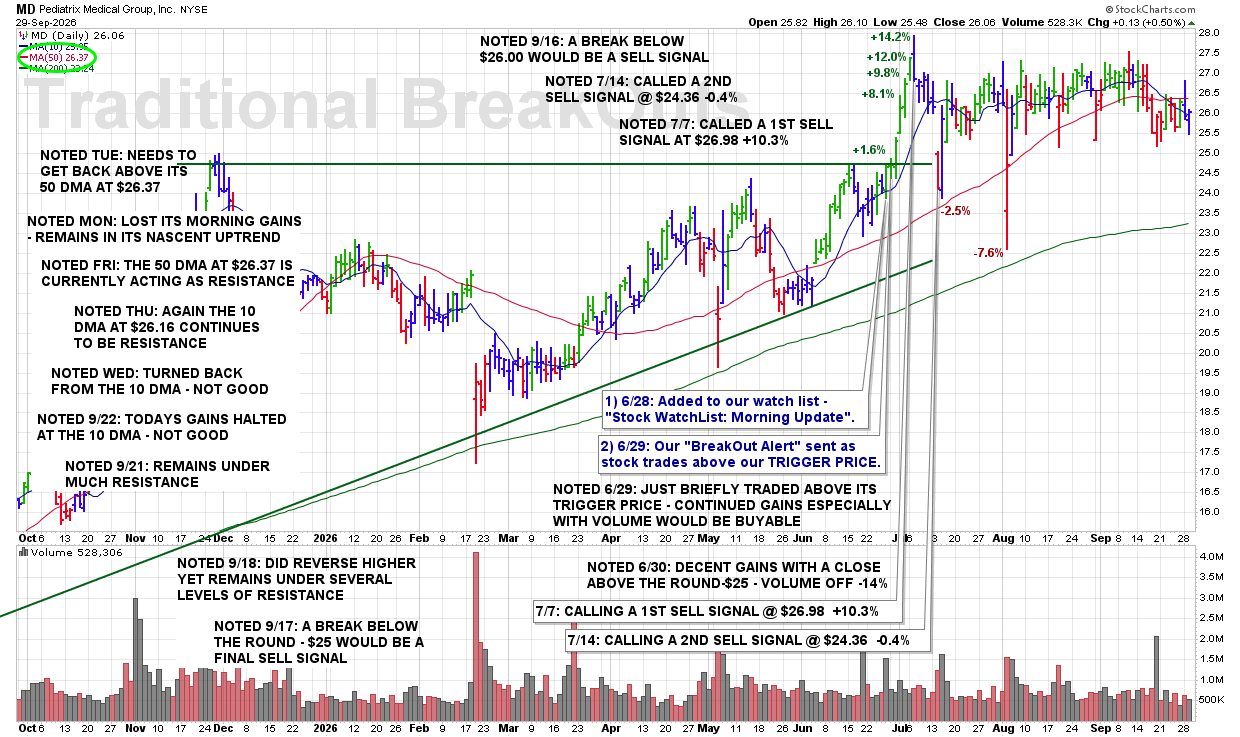
MON 9/28: MD – Lost Its Morning Gains – Remains in Its Nascent Uptrend

7:00 PM – Here is our latest chart update for this recent breakout from our Traditional BreakOuts Watch List.

CLICK/TAP CHART TO ZOOM
Chart services courtesy of stockcharts.com. Annotations by James Taulman.

We are currently reporting on this stock as an active holding and continue to monitor the stock closely for any technical SELL SIGNALS.

The focus always remains on price/volume action around key support levels, including the 10 DMA, 50 DMA, and any nearby trendline or ROUND-$ support.

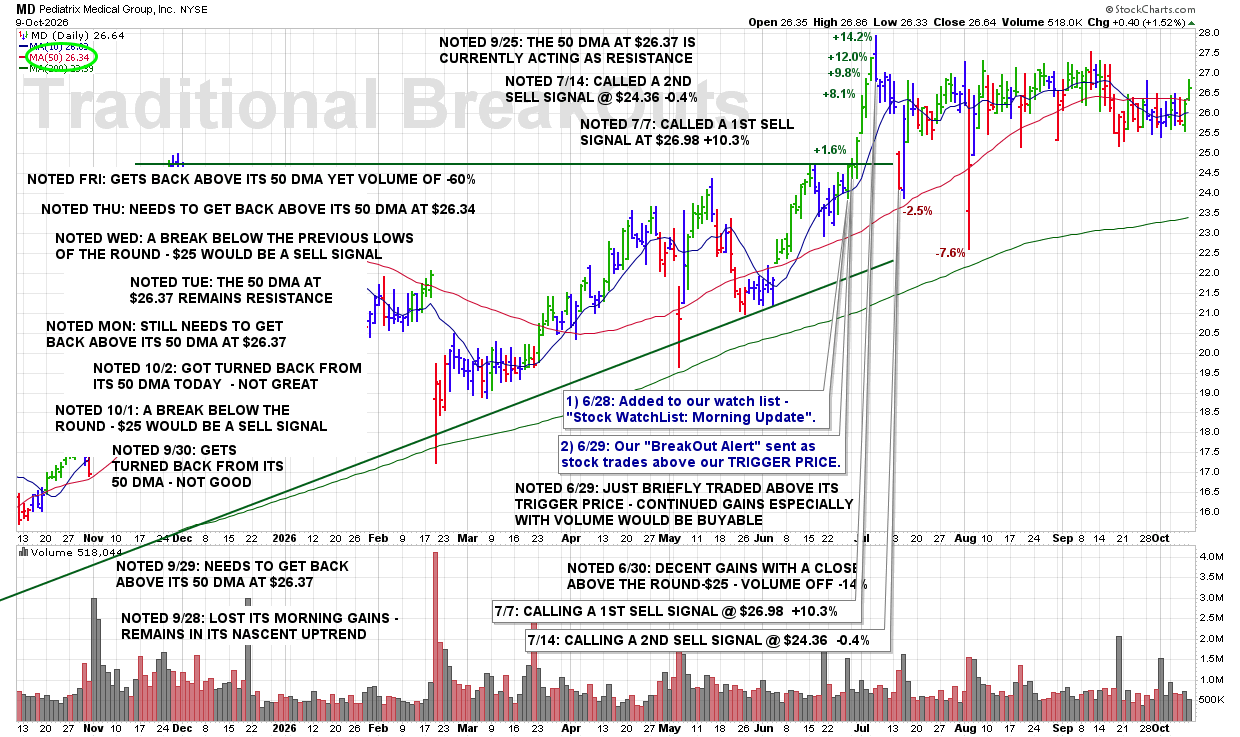
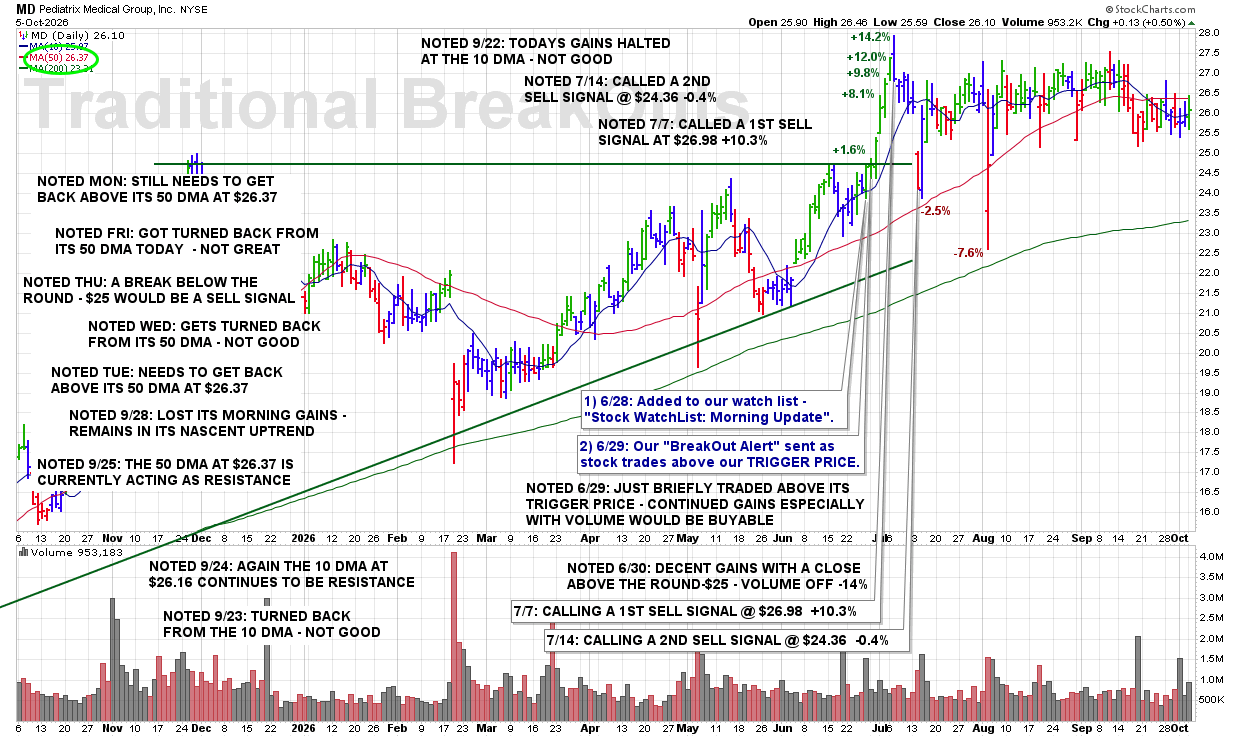
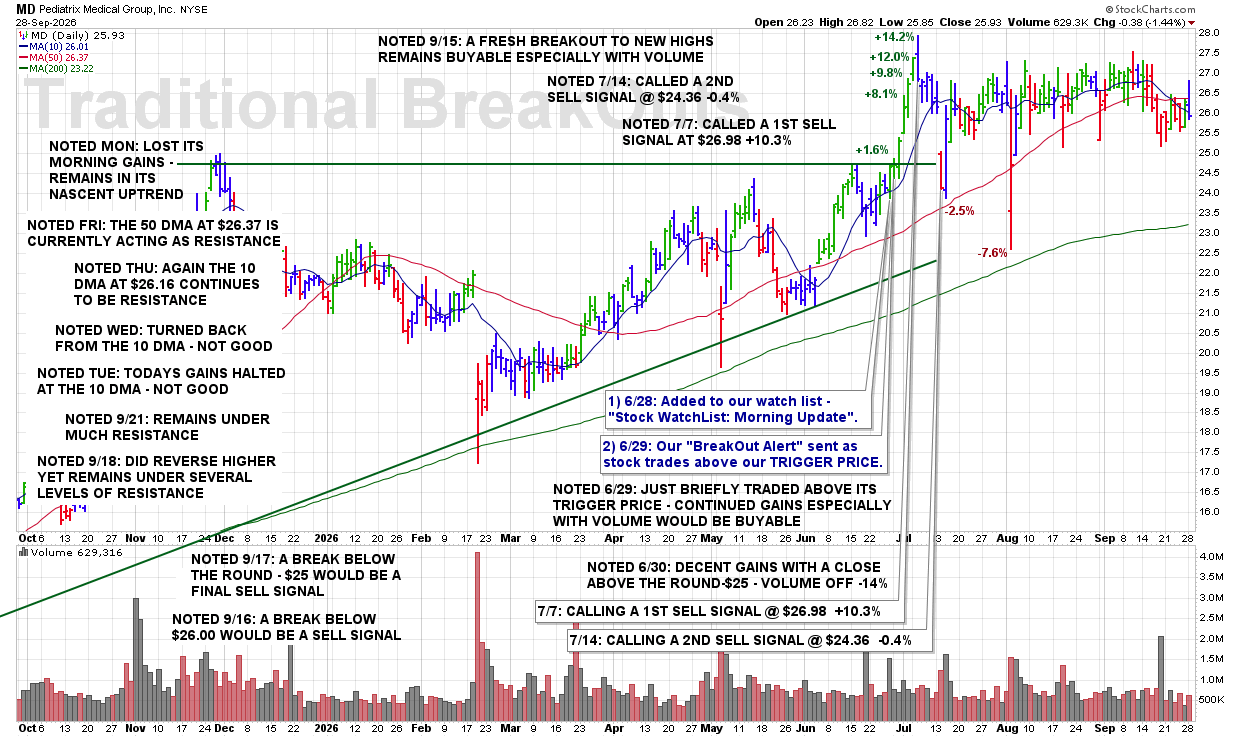
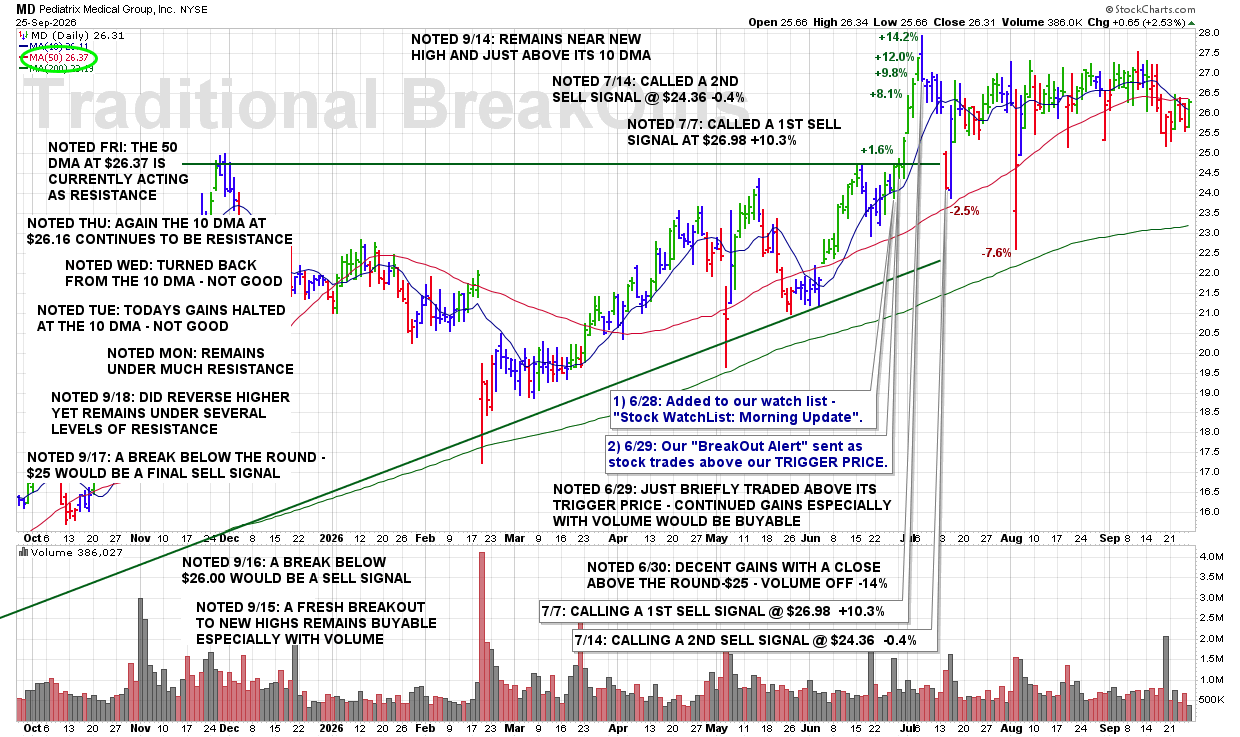
FRI 9/25: MD – The 50 DMA at $26.37 Is Currently Acting as Resistance

7:30 PM – Here is our latest chart update for this recent breakout from our Traditional BreakOuts Watch List.

CLICK/TAP CHART TO ZOOM
Chart services courtesy of stockcharts.com. Annotations by James Taulman.

We are currently reporting on this stock as an active holding and continue to monitor the stock closely for any technical SELL SIGNALS.

The focus always remains on price/volume action around key support levels, including the 10 DMA, 50 DMA, and any nearby trendline or ROUND-$ support.

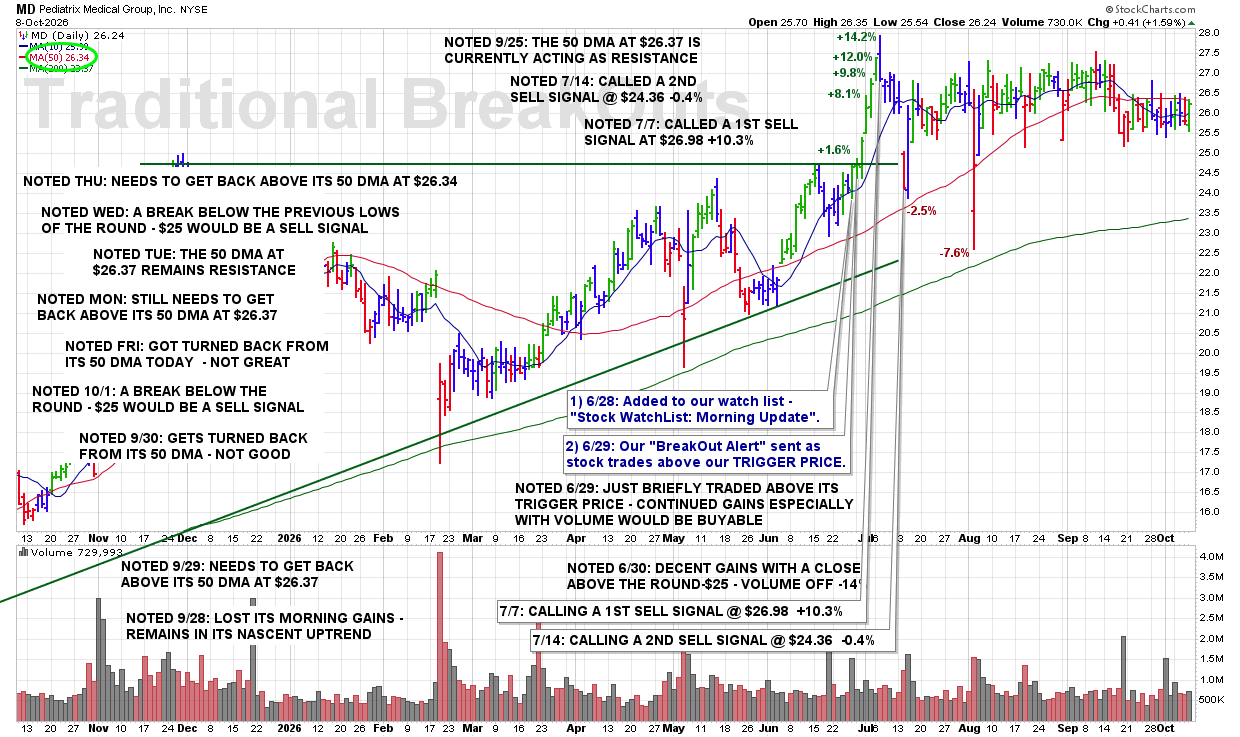
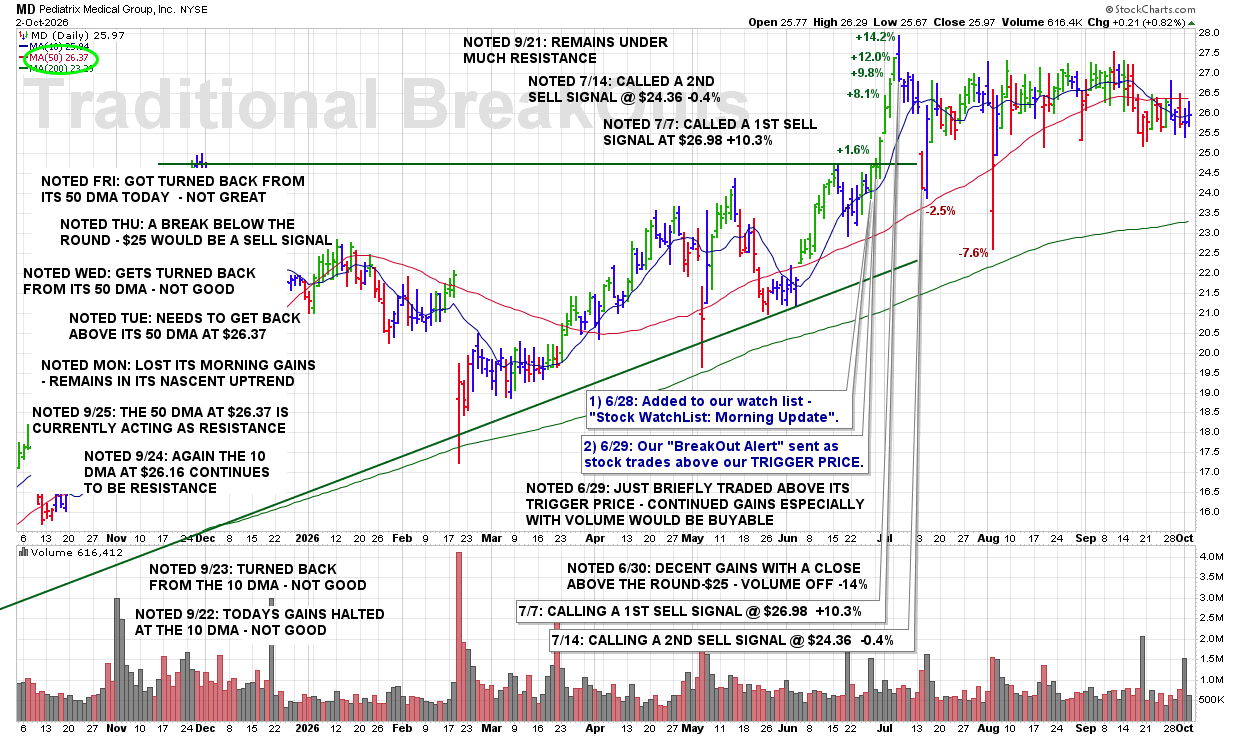
THU 9/24: MD – Again The 10 DMA At $26.16 Continues To Be Resistance

7:30 PM – Here is our latest chart update for this recent breakout from our Traditional BreakOuts Watch List.

CLICK/TAP CHART TO ZOOM
Chart services courtesy of stockcharts.com. Annotations by James Taulman.

We are currently reporting on this stock as an active holding and continue to monitor the stock closely for any technical SELL SIGNALS.

The focus always remains on price/volume action around key support levels, including the 10 DMA, 50 DMA, and any nearby trendline or ROUND-$ support.

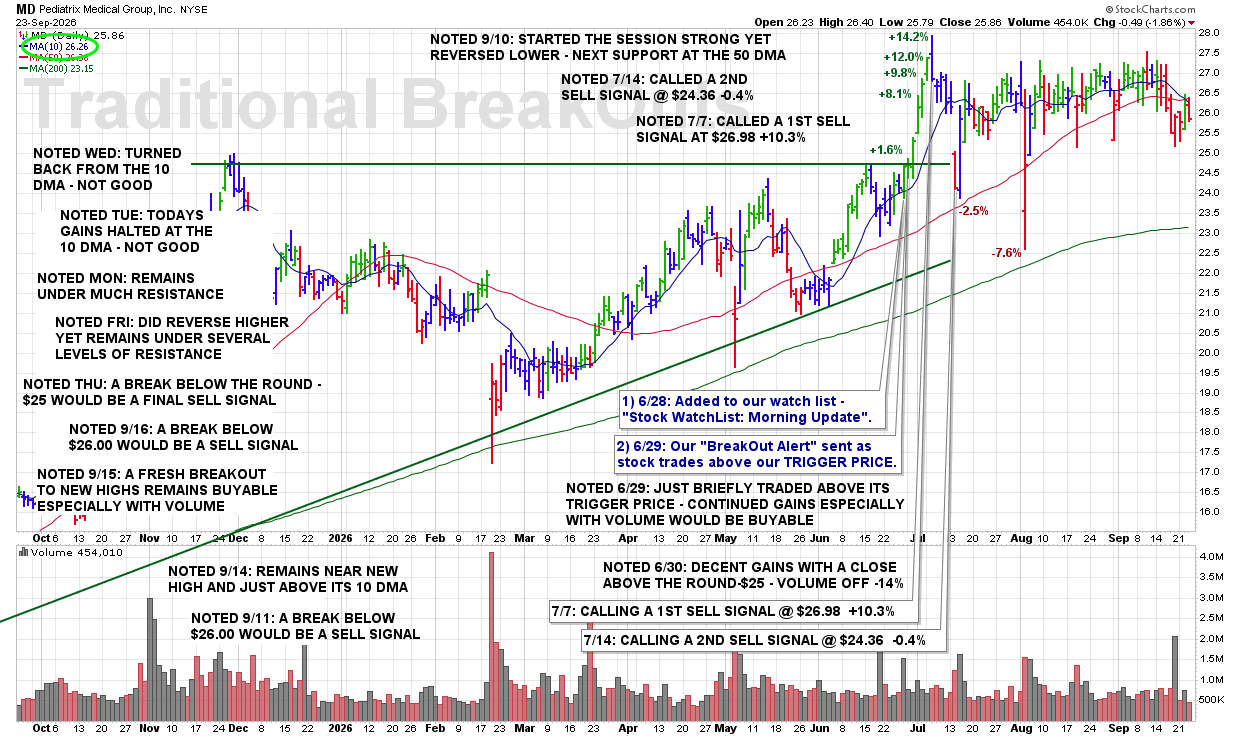
WED 9/23: MD – Turned Back From the 10 DMA – Not Good

8:30 PM – Here is our latest chart update for this recent breakout from our Traditional BreakOuts Watch List.

CLICK/TAP CHART TO ZOOM
Chart services courtesy of stockcharts.com. Annotations by James Taulman.

We are currently reporting on this stock as an active holding and continue to monitor the stock closely for any technical SELL SIGNALS.

The focus always remains on price/volume action around key support levels, including the 10 DMA, 50 DMA, and any nearby trendline or ROUND-$ support.

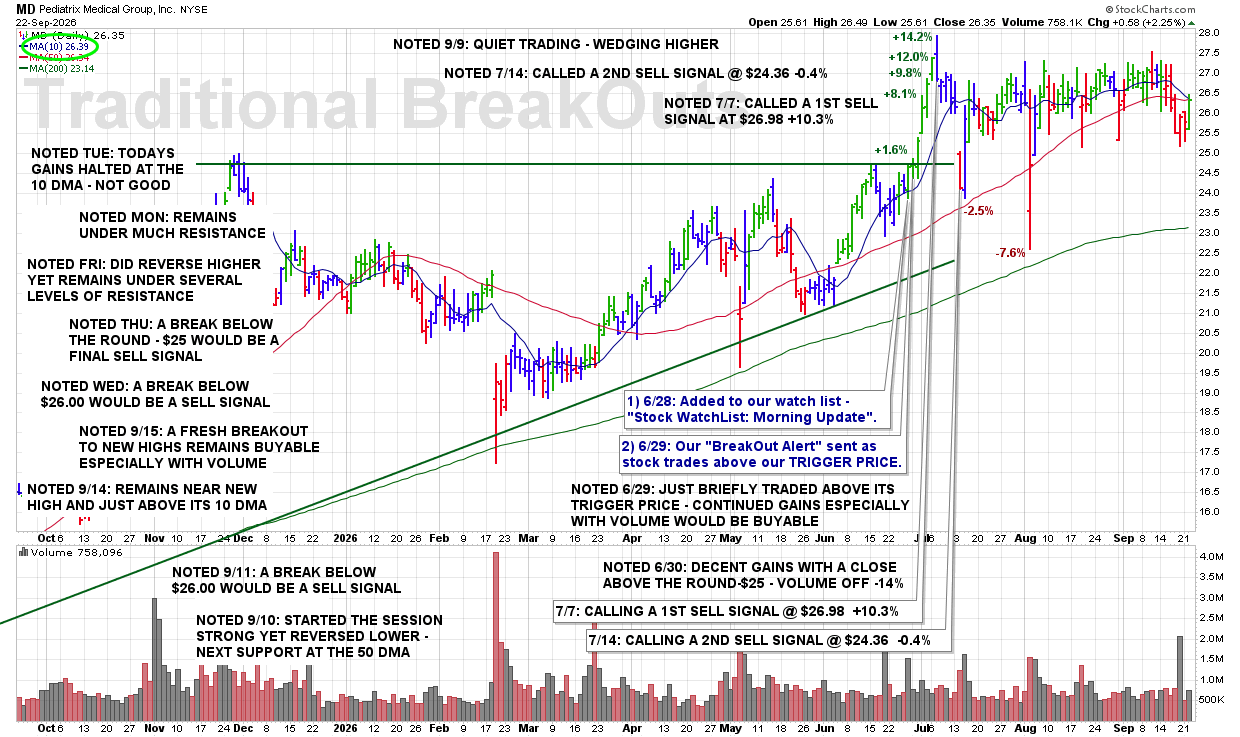
TUE 9/22: MD – Todays Gains Halted at the 10 DMA – Not Good

8:20 PM – Here is our latest chart update for this recent breakout from our Traditional BreakOuts Watch List.

CLICK/TAP CHART TO ZOOM
Chart services courtesy of stockcharts.com. Annotations by James Taulman.

We are currently reporting on this stock as an active holding and continue to monitor the stock closely for any technical SELL SIGNALS.

The focus always remains on price/volume action around key support levels, including the 10 DMA, 50 DMA, and any nearby trendline or ROUND-$ support.

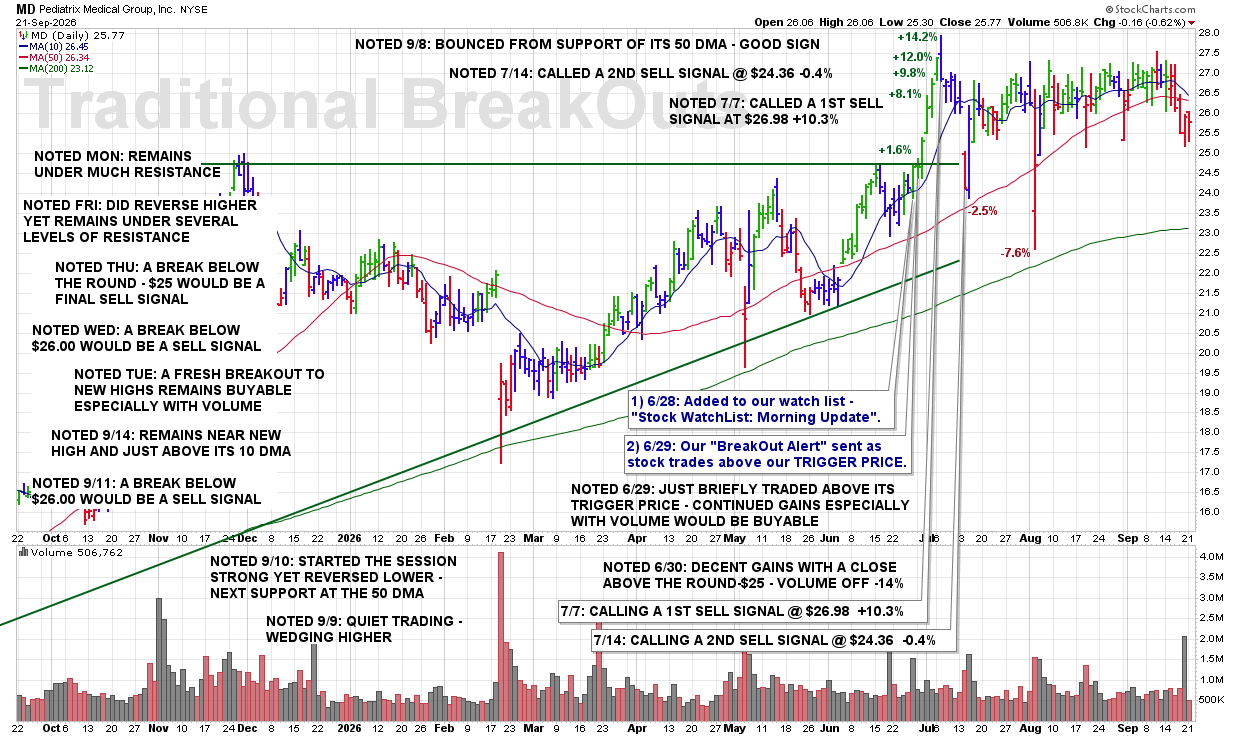
MON 9/21: MD – Remains Under Much Resistance

8:00 PM – Here is our latest chart update for this recent breakout from our Traditional BreakOuts Watch List.

CLICK/TAP CHART TO ZOOM
Chart services courtesy of stockcharts.com. Annotations by James Taulman.

We are currently reporting on this stock as an active holding and continue to monitor the stock closely for any technical SELL SIGNALS.

The focus always remains on price/volume action around key support levels, including the 10 DMA, 50 DMA, and any nearby trendline or ROUND-$ support.

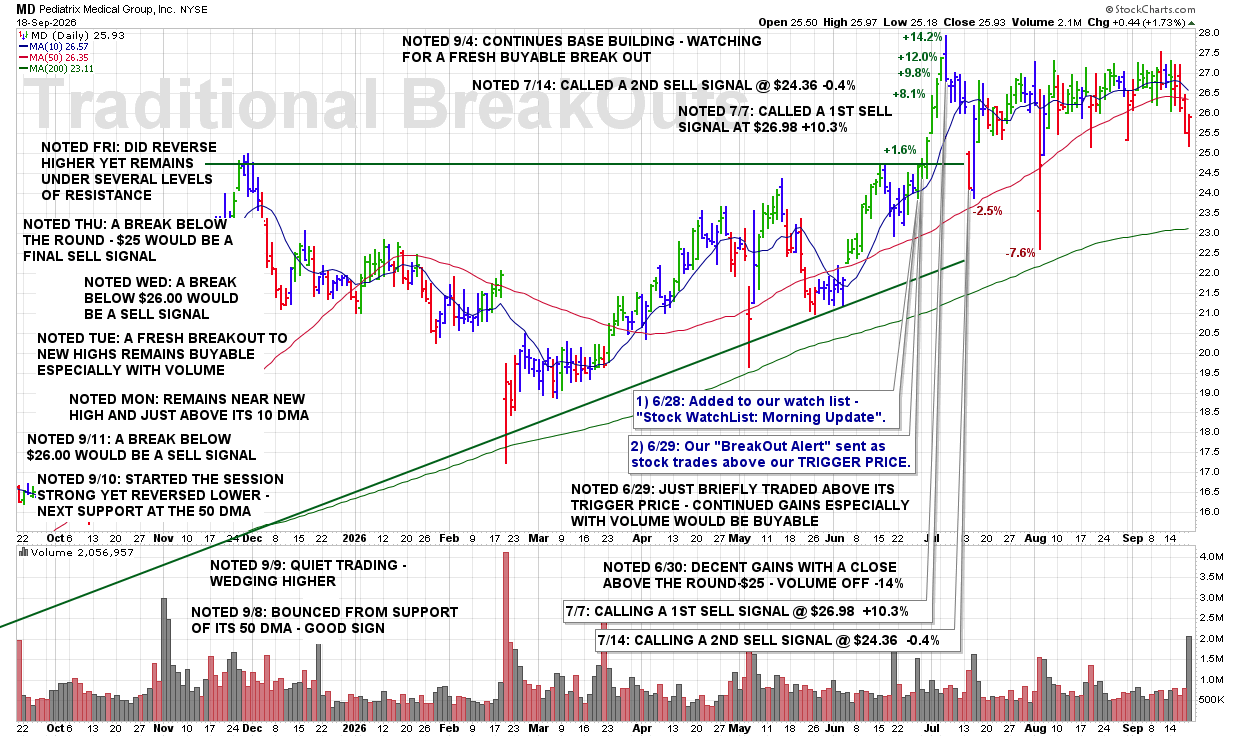
FRI 9/18 – MD – Did Reverse Higher Yet Remains Under Several Levels of Resistance

8:00 PM – Here is our latest chart update for this recent breakout from our Traditional BreakOuts Watch List.

CLICK/TAP CHART TO ZOOM
Chart services courtesy of stockcharts.com. Annotations by James Taulman.

We are currently reporting on this stock as an active holding and continue to monitor the stock closely for any technical SELL SIGNALS.

The focus always remains on price/volume action around key support levels, including the 10 DMA, 50 DMA, and any nearby trendline or ROUND-$ support.

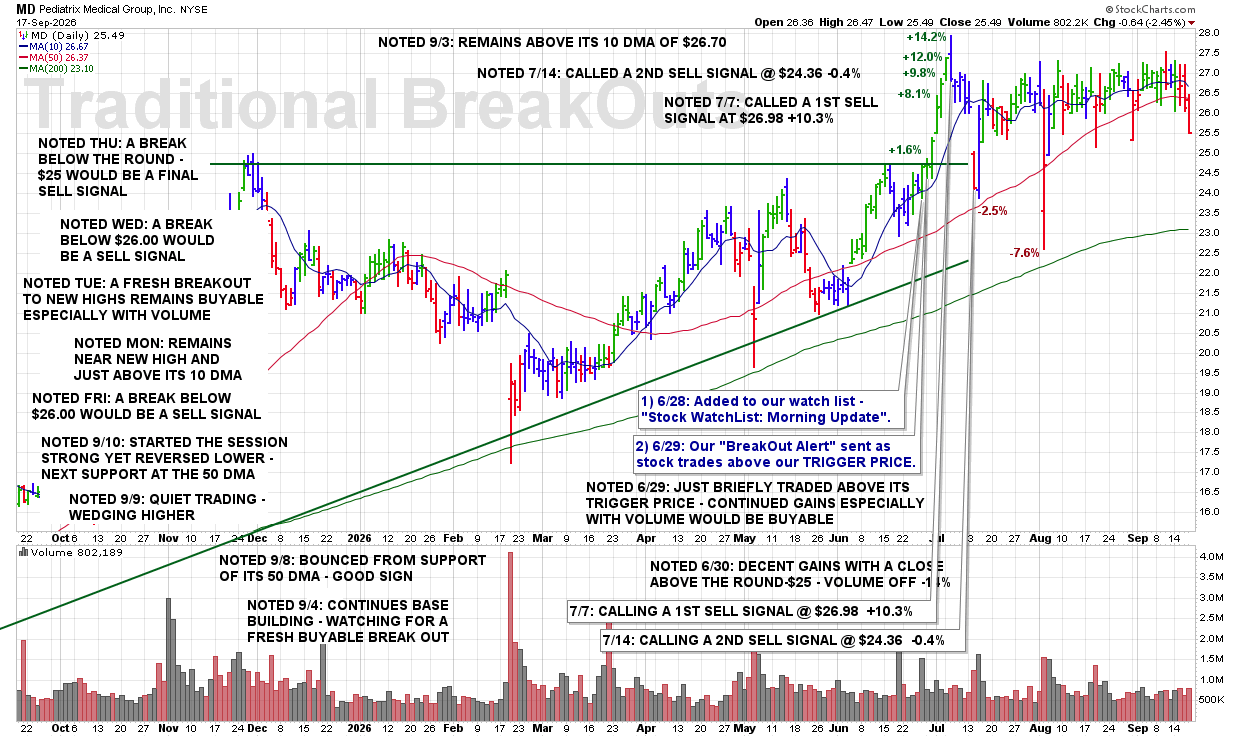
THU 9/17: MD – A Break Below the Round-$25 Would Be a Final Sell Signal

8:30 PM – Here is our latest chart update for this recent breakout from our Traditional BreakOuts Watch List.

CLICK/TAP CHART TO ZOOM
Chart services courtesy of stockcharts.com. Annotations by James Taulman.

We are currently reporting on this stock as an active holding and continue to monitor the stock closely for any technical SELL SIGNALS.

The focus always remains on price/volume action around key support levels, including the 10 DMA, 50 DMA, and any nearby trendline or ROUND-$ support.

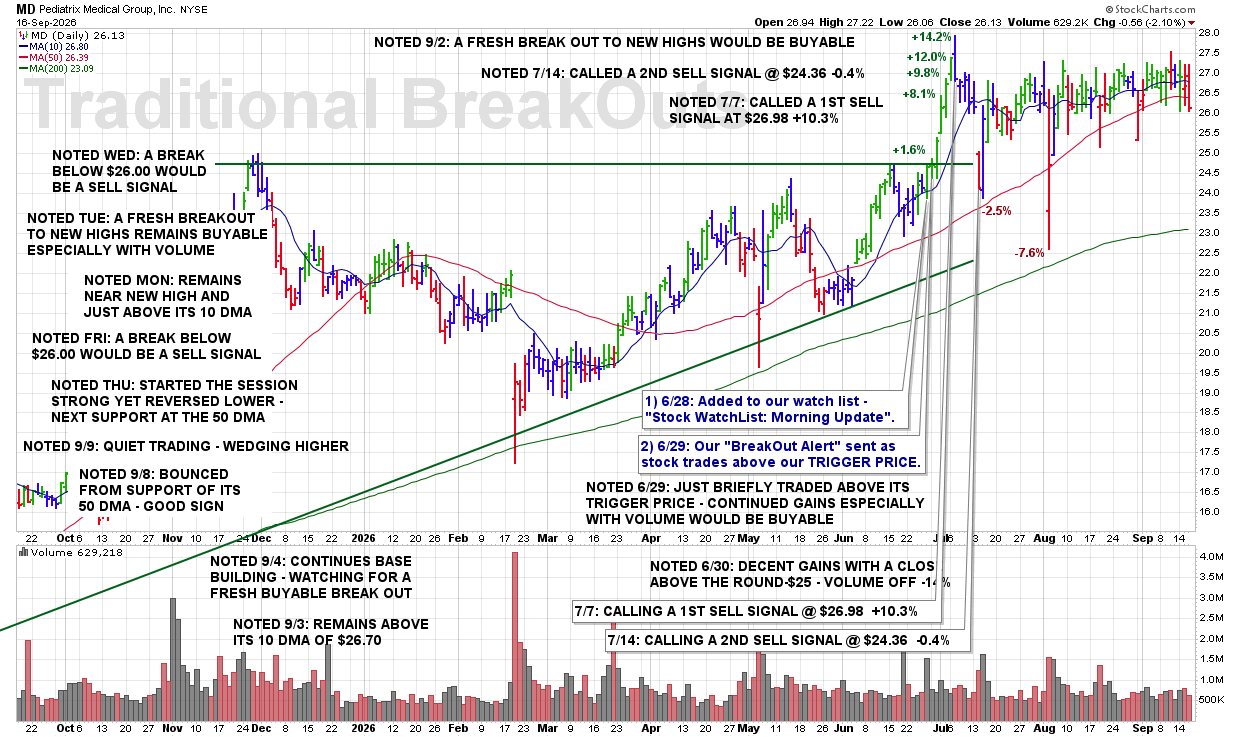
WED 9/16: MD – A Break Below $26.00 Would Be a Sell Signal

8:15 PM – Here is our latest chart update for this recent breakout from our Traditional BreakOuts Watch List.

CLICK/TAP CHART TO ZOOM
Chart services courtesy of stockcharts.com. Annotations by James Taulman.

We are currently reporting on this stock as an active holding and continue to monitor the stock closely for any technical SELL SIGNALS.

The focus always remains on price/volume action around key support levels, including the 10 DMA, 50 DMA, and any nearby trendline or ROUND-$ support.

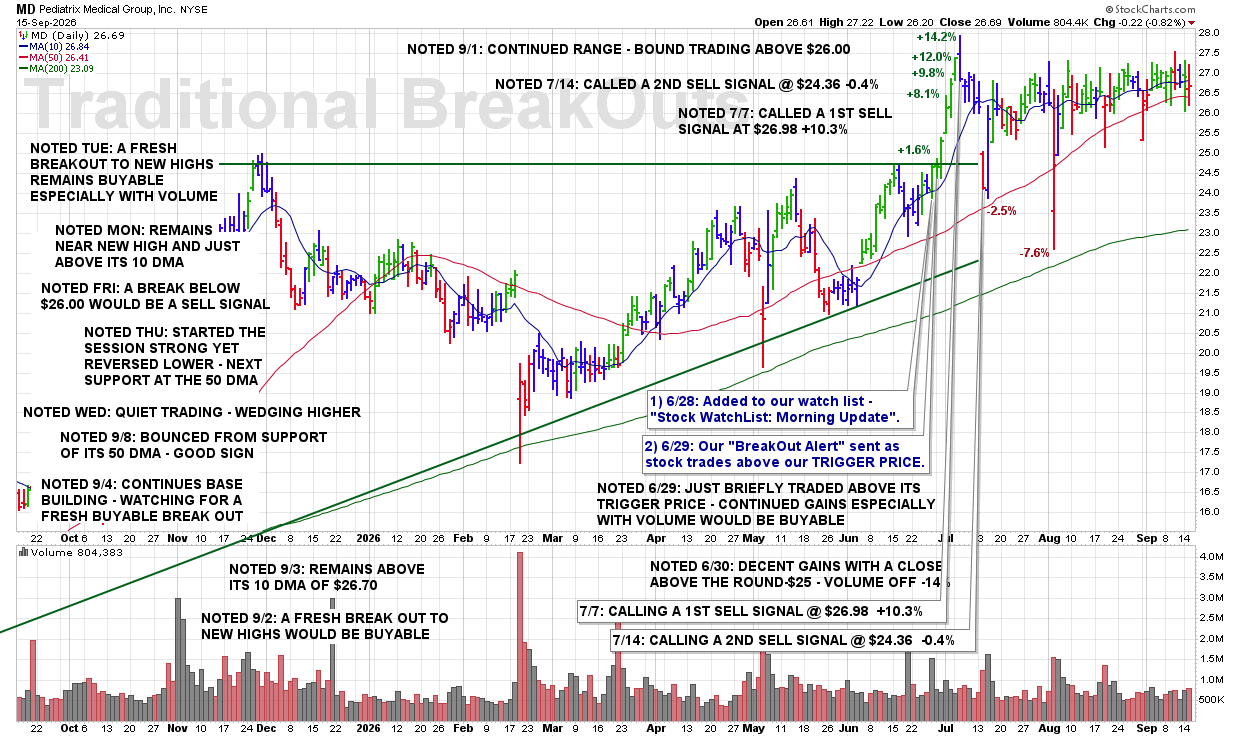
TUE 9/15: MD – A Fresh Breakout to New Highs Remains Buyable Especially With Volume

8:15 PM – Here is our latest chart update for this recent breakout from our Traditional BreakOuts Watch List.

CLICK/TAP CHART TO ZOOM
Chart services courtesy of stockcharts.com. Annotations by James Taulman.

We are currently reporting on this stock as an active holding and continue to monitor the stock closely for any technical SELL SIGNALS.

The focus always remains on price/volume action around key support levels, including the 10 DMA, 50 DMA, and any nearby trendline or ROUND-$ support.

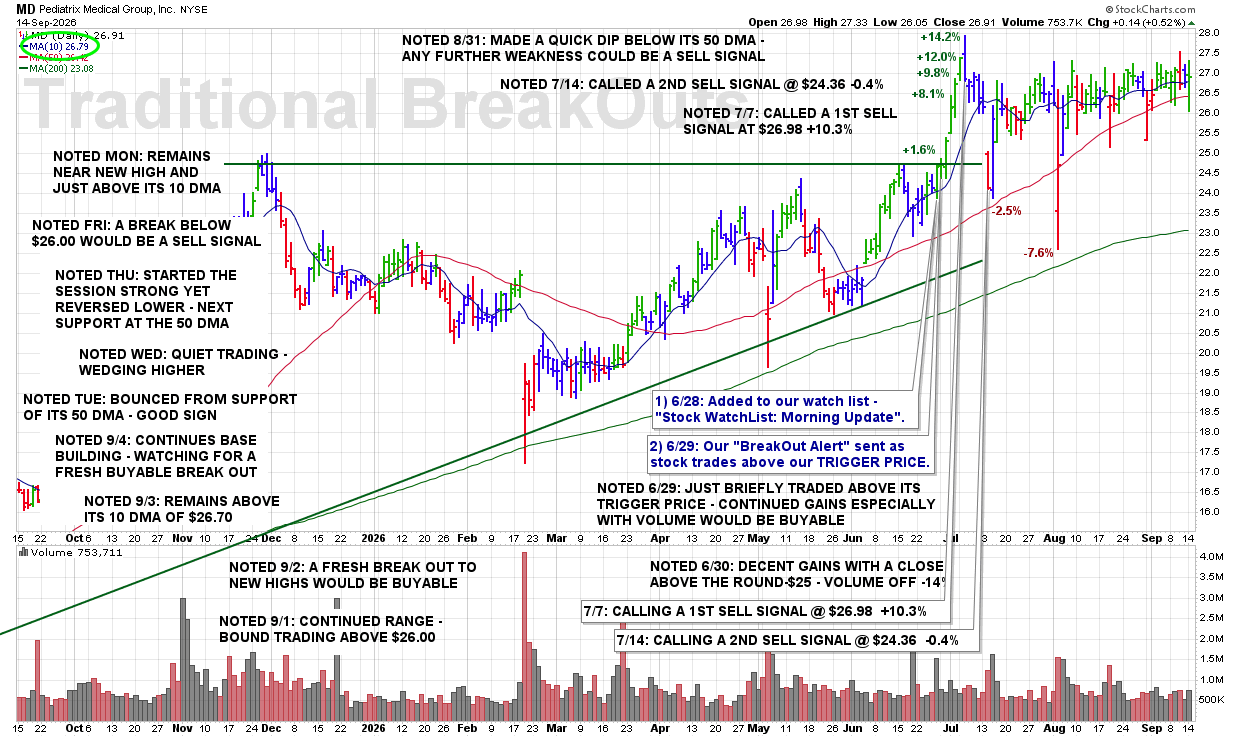
MON 9/14: MD – Remains Near New High and Just Above Its 10 DMA

8:45 PM – Here is our latest chart update for this recent breakout from our Traditional BreakOuts Watch List.

CLICK/TAP CHART TO ZOOM
Chart services courtesy of stockcharts.com. Annotations by James Taulman.

We are currently reporting on this stock as an active holding and continue to monitor the stock closely for any technical SELL SIGNALS.

The focus always remains on price/volume action around key support levels, including the 10 DMA, 50 DMA, and any nearby trendline or ROUND-$ support.

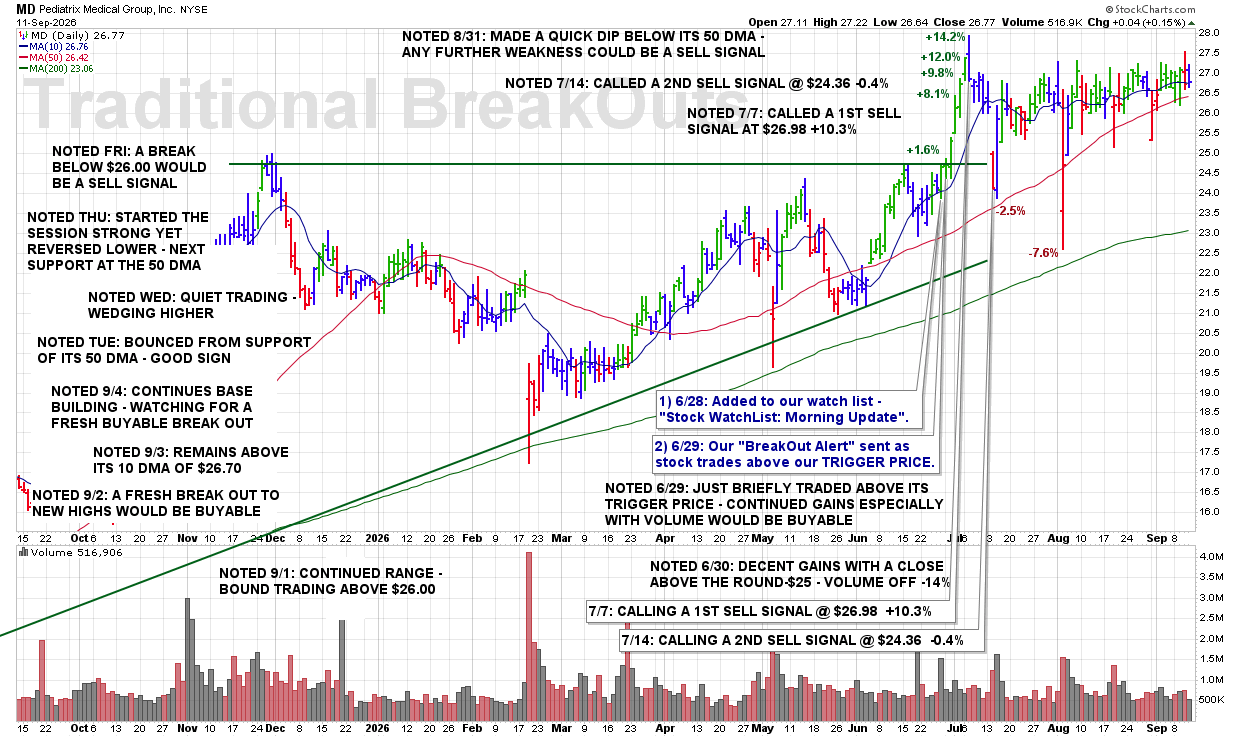
FRI 9/11: MD – A Break Below $26.00 Would Be a Sell Signal

8:35 PM – Here is our latest chart update for this recent breakout from our Traditional BreakOuts Watch List.

CLICK/TAP CHART TO ZOOM
Chart services courtesy of stockcharts.com. Annotations by James Taulman.

We are currently reporting on this stock as an active holding and continue to monitor the stock closely for any technical SELL SIGNALS.

The focus always remains on price/volume action around key support levels, including the 10 DMA, 50 DMA, and any nearby trendline or ROUND-$ support.

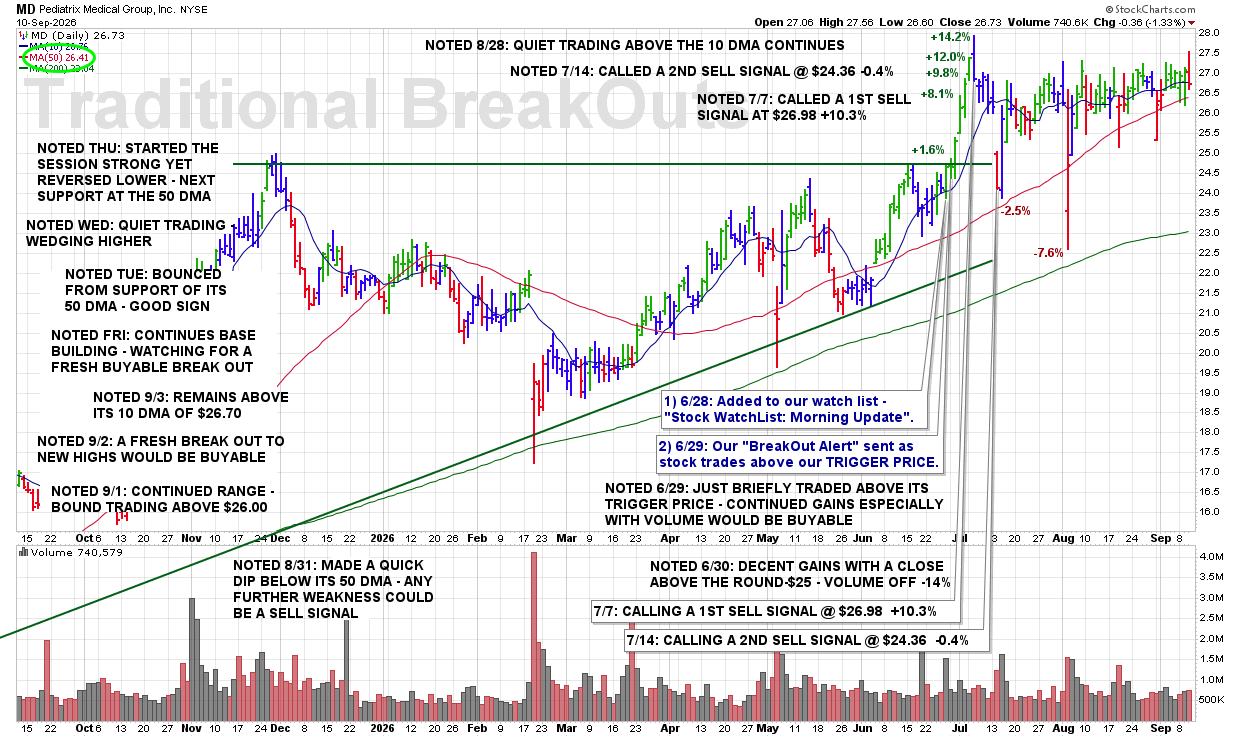
THU 9/10: MD – Started the Session Strong Yet Reversed Lower – Next Support at the 50 DMA

8:35 PM – Here is our latest chart update for this recent breakout from our Traditional BreakOuts Watch List.

CLICK/TAP CHART TO ZOOM
Chart services courtesy of stockcharts.com. Annotations by James Taulman.

We are currently reporting on this stock as an active holding and continue to monitor the stock closely for any technical SELL SIGNALS.

The focus always remains on price/volume action around key support levels, including the 10 DMA, 50 DMA, and any nearby trendline or ROUND-$ support.

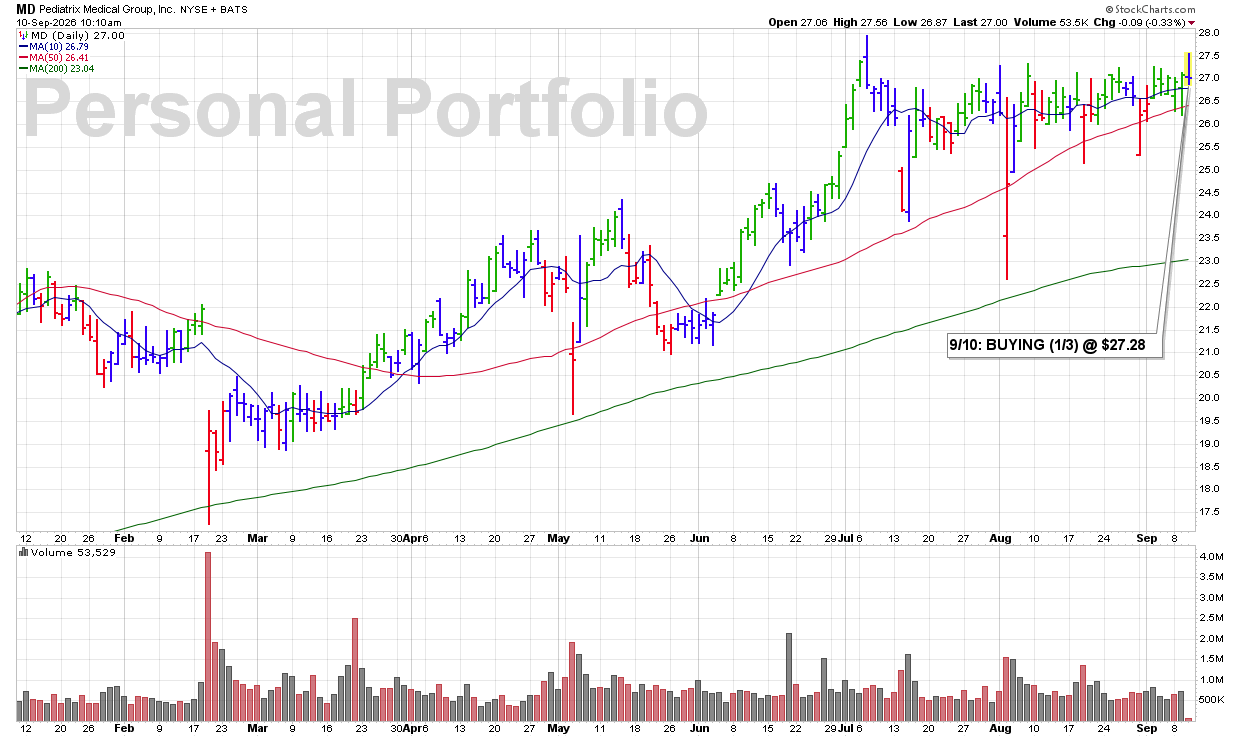
THU 9/10: MD — High-Ranked Medical Services Stock Breaking Out to New All-Time Highs

10:20 AM – Picked up a 1/3 position in this Medical Services stock as it sports very high overall rankings, is part of a leading industry group ranked 5th, and is clearly breaking above its previous highs with an increase in volume. The combination of strong rankings, industry group leadership, a breakout to new all-time highs, and increased volume gives me enough bullish technical evidence to initiate a position.

James’ Trader’s Tip: Look for Leadership Confirmed by Price and Volume

  • Stocks breaking into new all-time highs are demonstrating clear price strength.

  • Strength within a leading industry group adds another positive characteristic.

  • Increased volume helps confirm that there is meaningful demand behind the breakout.

CLICK/TAP CHART TO ZOOM
Chart services courtesy of stockcharts.com. Annotations by James Taulman.

WED 9/9: MD – Quiet Trading – Wedging Higher

8:35 PM – Here is our latest chart update for this recent breakout from our Traditional BreakOuts Watch List.

CLICK/TAP CHART TO ZOOM
Chart services courtesy of stockcharts.com. Annotations by James Taulman.

We are currently reporting on this stock as an active holding and continue to monitor the stock closely for any technical SELL SIGNALS.

The focus always remains on price/volume action around key support levels, including the 10 DMA, 50 DMA, and any nearby trendline or ROUND-$ support.

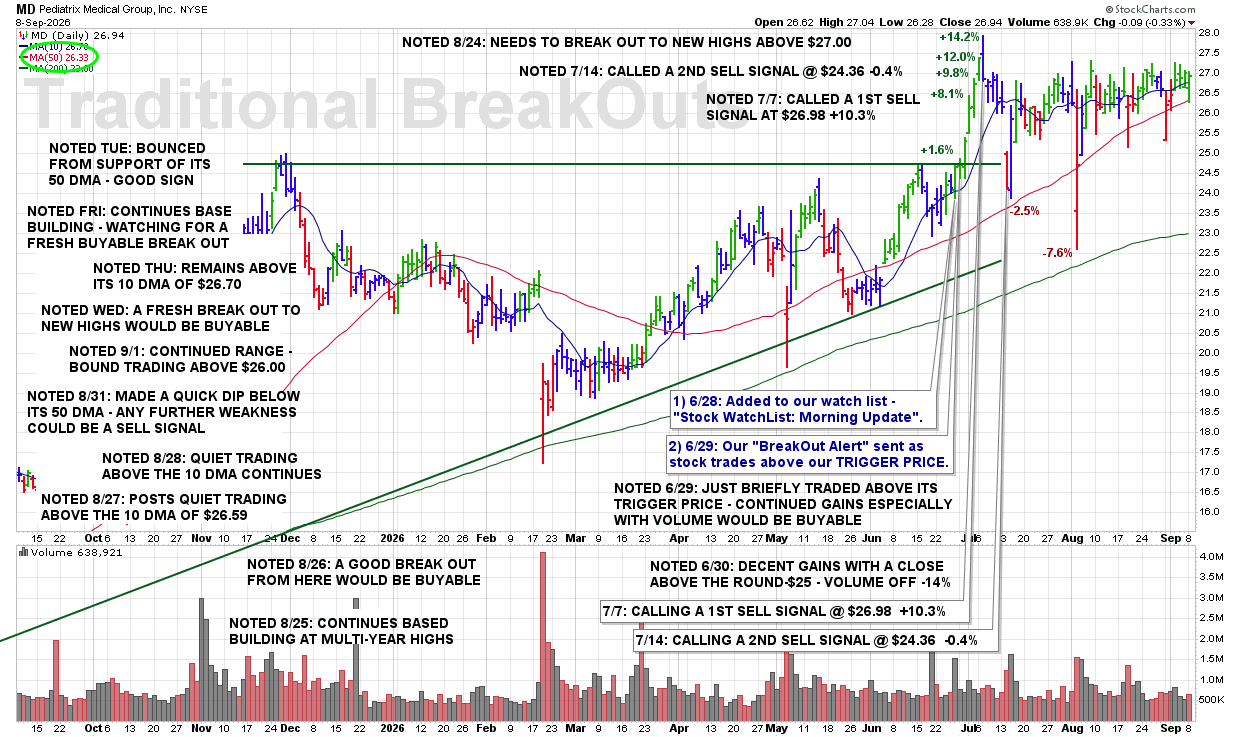
TUE 9/8: MD – Bounced From Support of Its 50 DMA – Good Sign

9:05 PM – Here is our latest chart update for this recent breakout from our Traditional BreakOuts Watch List.

CLICK/TAP CHART TO ZOOM
Chart services courtesy of stockcharts.com. Annotations by James Taulman.

We are currently reporting on this stock as an active holding and continue to monitor the stock closely for any technical SELL SIGNALS.

The focus always remains on price/volume action around key support levels, including the 10 DMA, 50 DMA, and any nearby trendline or ROUND-$ support.

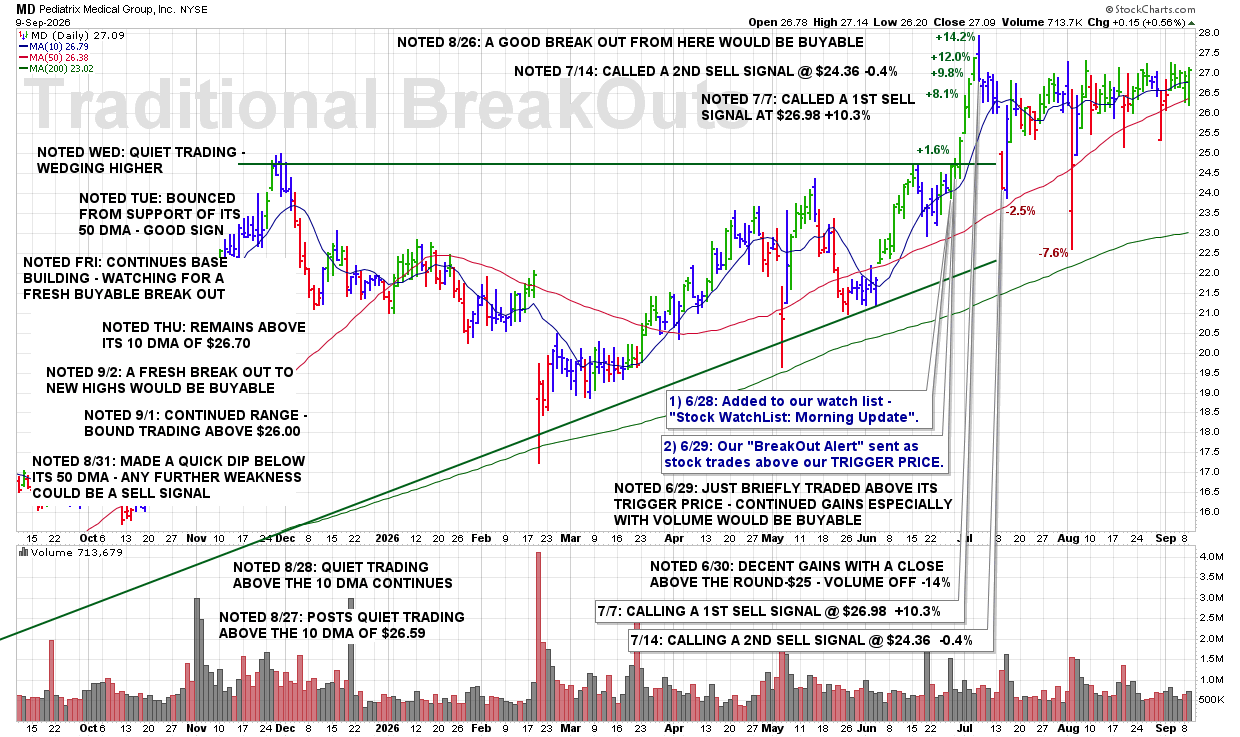
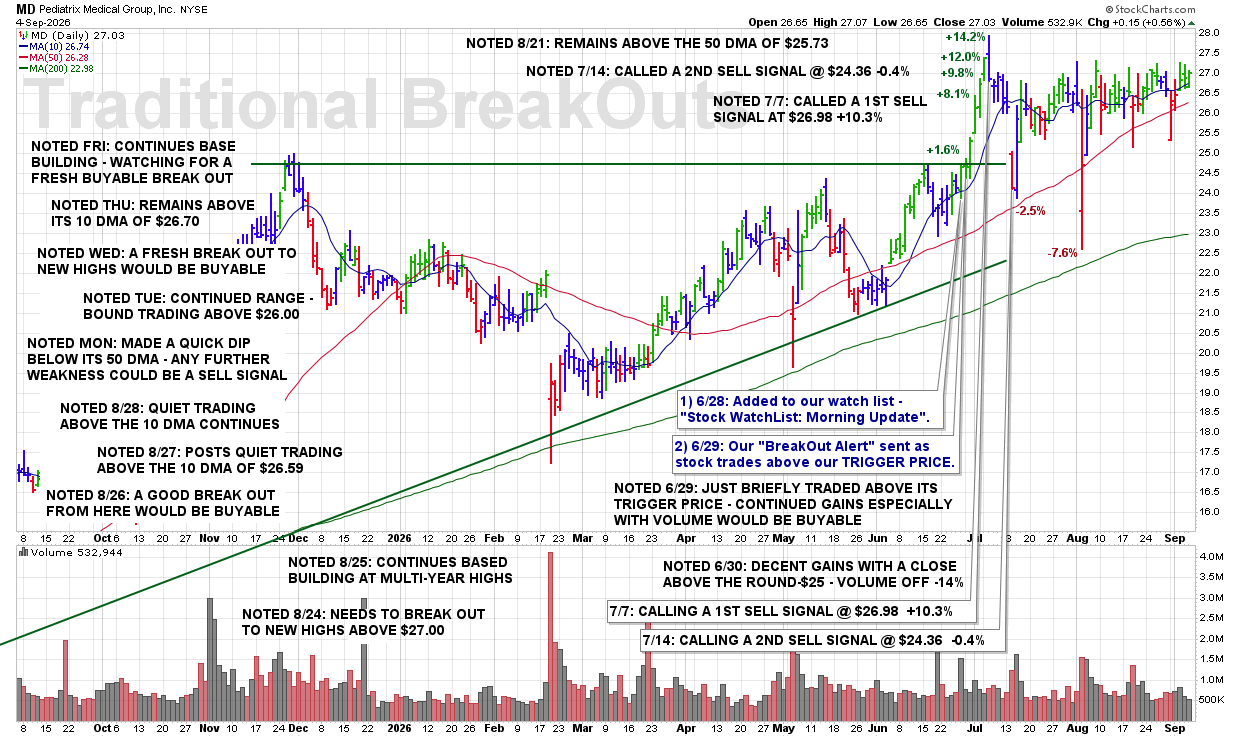
FRI 9/4: MD – Continues Base Building – Watching for a Fresh Buyable Break Out

8:05 PM – Here is our latest chart update for this recent breakout from our Traditional BreakOuts Watch List.

CLICK/TAP CHART TO ZOOM
Chart services courtesy of stockcharts.com. Annotations by James Taulman.

We are currently reporting on this stock as an active holding and continue to monitor the stock closely for any technical SELL SIGNALS.

The focus always remains on price/volume action around key support levels, including the 10 DMA, 50 DMA, and any nearby trendline or ROUND-$ support.

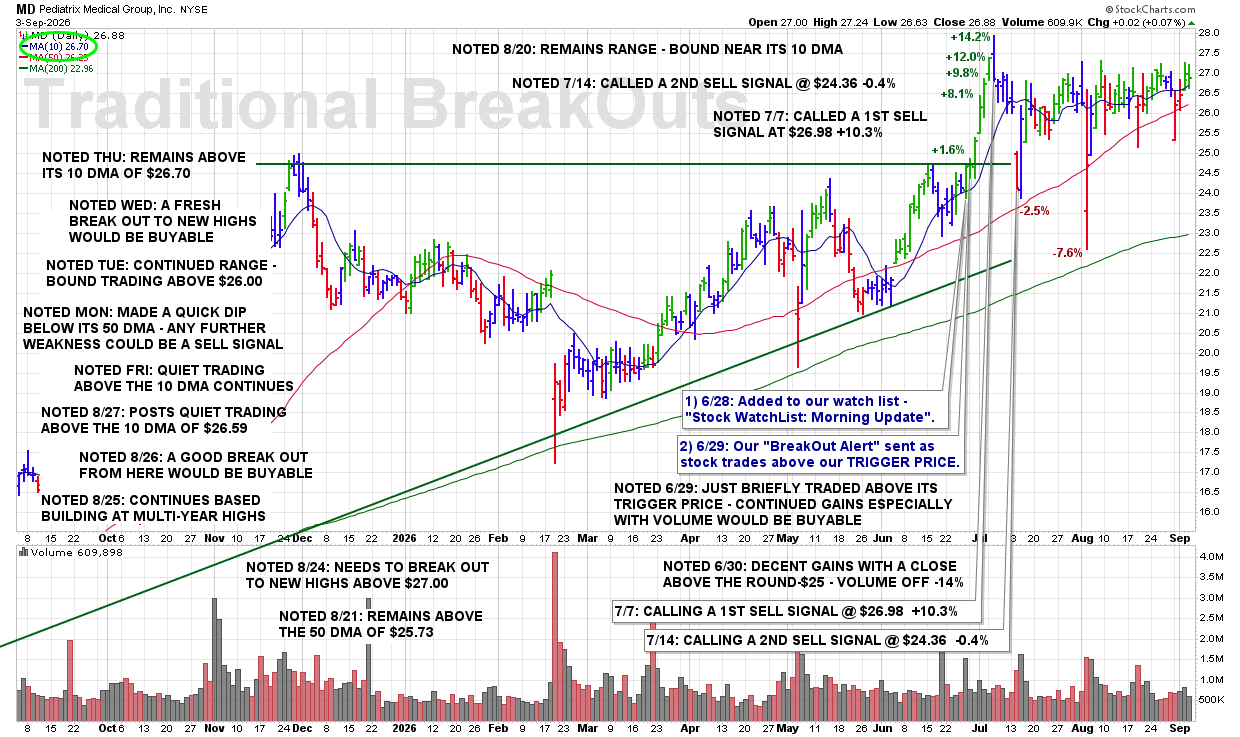
THU 9/3: MD – Remains Above Its 10 DMA of $26.70

8:35 PM – Here is our latest chart update for this recent breakout from our Traditional BreakOuts Watch List.

CLICK/TAP CHART TO ZOOM
Chart services courtesy of stockcharts.com. Annotations by James Taulman.

We are currently reporting on this stock as an active holding and continue to monitor the stock closely for any technical SELL SIGNALS.

The focus always remains on price/volume action around key support levels, including the 10 DMA, 50 DMA, and any nearby trendline or ROUND-$ support.

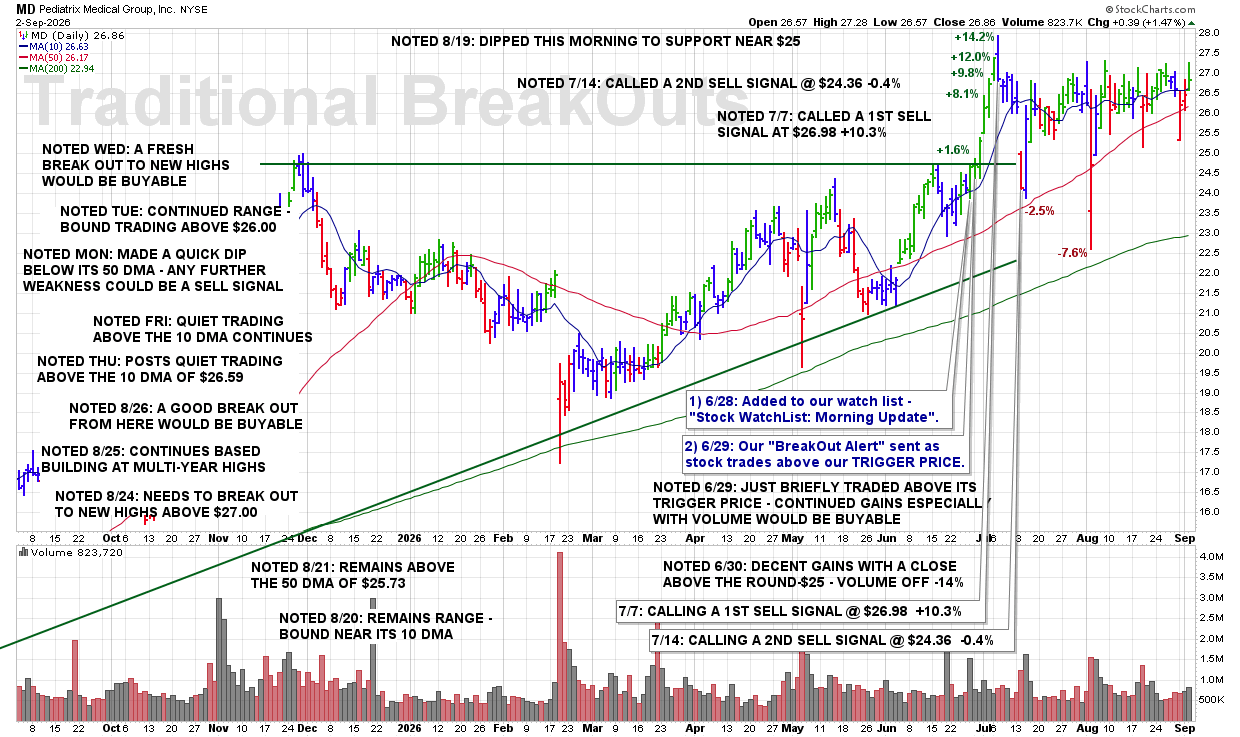
WED 9/2: MD – A Fresh Break Out to New Highs Would Be Buyable

8:35 PM – Here is our latest chart update for this recent breakout from our Traditional BreakOuts Watch List.

CLICK/TAP CHART TO ZOOM
Chart services courtesy of stockcharts.com. Annotations by James Taulman.

We are currently reporting on this stock as an active holding and continue to monitor the stock closely for any technical SELL SIGNALS.

The focus always remains on price/volume action around key support levels, including the 10 DMA, 50 DMA, and any nearby trendline or ROUND-$ support.

TUE 9/1: MD – Continued Range-Bound Trading Above $26.00

8:35 PM – Here is our latest chart update for this recent breakout from our Traditional BreakOuts Watch List.

CLICK/TAP CHART TO ZOOM
Chart services courtesy of stockcharts.com. Annotations by James Taulman.

We are currently reporting on this stock as an active holding and continue to monitor the stock closely for any technical SELL SIGNALS.

The focus always remains on price/volume action around key support levels, including the 10 DMA, 50 DMA, and any nearby trendline or ROUND-$ support.

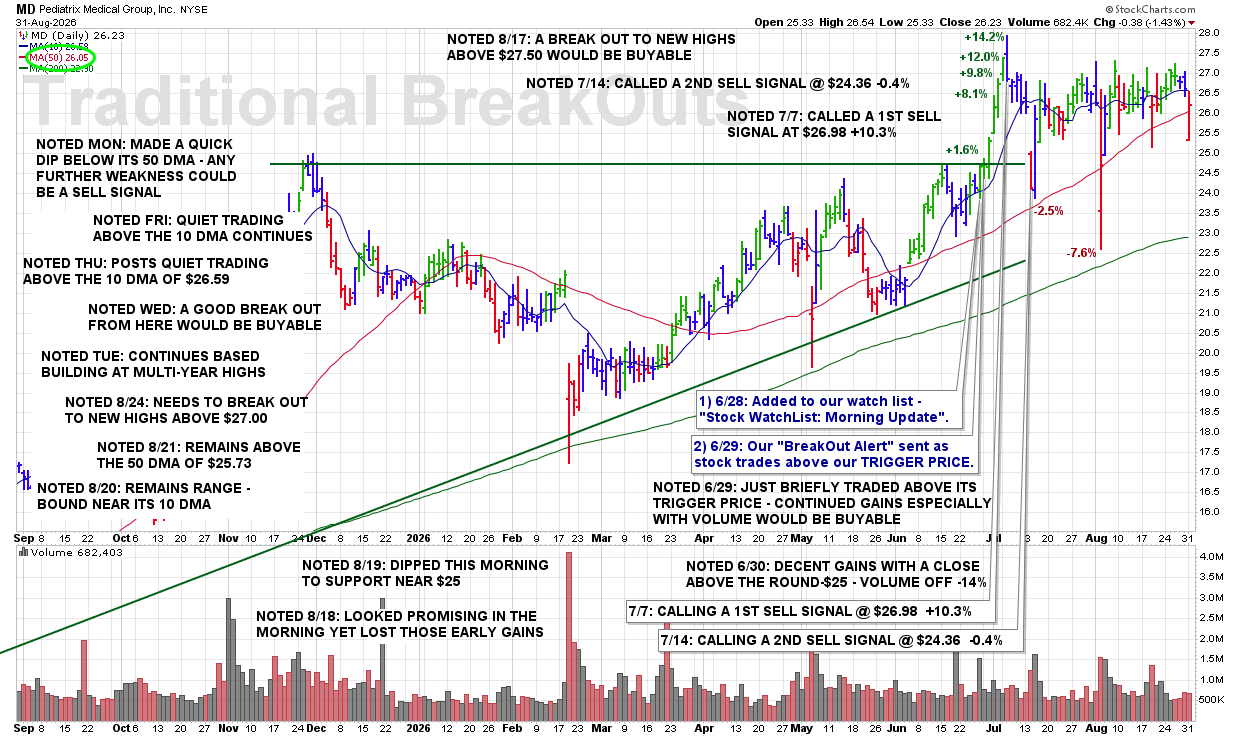
MON 8/31: MD – Made a Quick Dip Below Its 50 DMA – Any Further Weakness Could Be a Sell Signal

9:05 PM – Here is our latest chart update for this recent breakout from our Traditional BreakOuts Watch List.

CLICK/TAP CHART TO ZOOM
Chart services courtesy of stockcharts.com. Annotations by James Taulman.

We are currently reporting on this stock as an active holding and continue to monitor the stock closely for any technical SELL SIGNALS.

The focus always remains on price/volume action around key support levels, including the 10 DMA, 50 DMA, and any nearby trendline or ROUND-$ support.

FRI 8/28: MD – Quiet Trading Above the 10 DMA Continues

8:35 PM – Here is our latest chart update for this recent breakout from our Traditional BreakOuts Watch List.

CLICK/TAP CHART TO ZOOM
Chart services courtesy of stockcharts.com. Annotations by James Taulman.

We are currently reporting on this stock as an active holding and continue to monitor the stock closely for any technical SELL SIGNALS.

The focus always remains on price/volume action around key support levels, including the 10 DMA, 50 DMA, and any nearby trendline or ROUND-$ support.

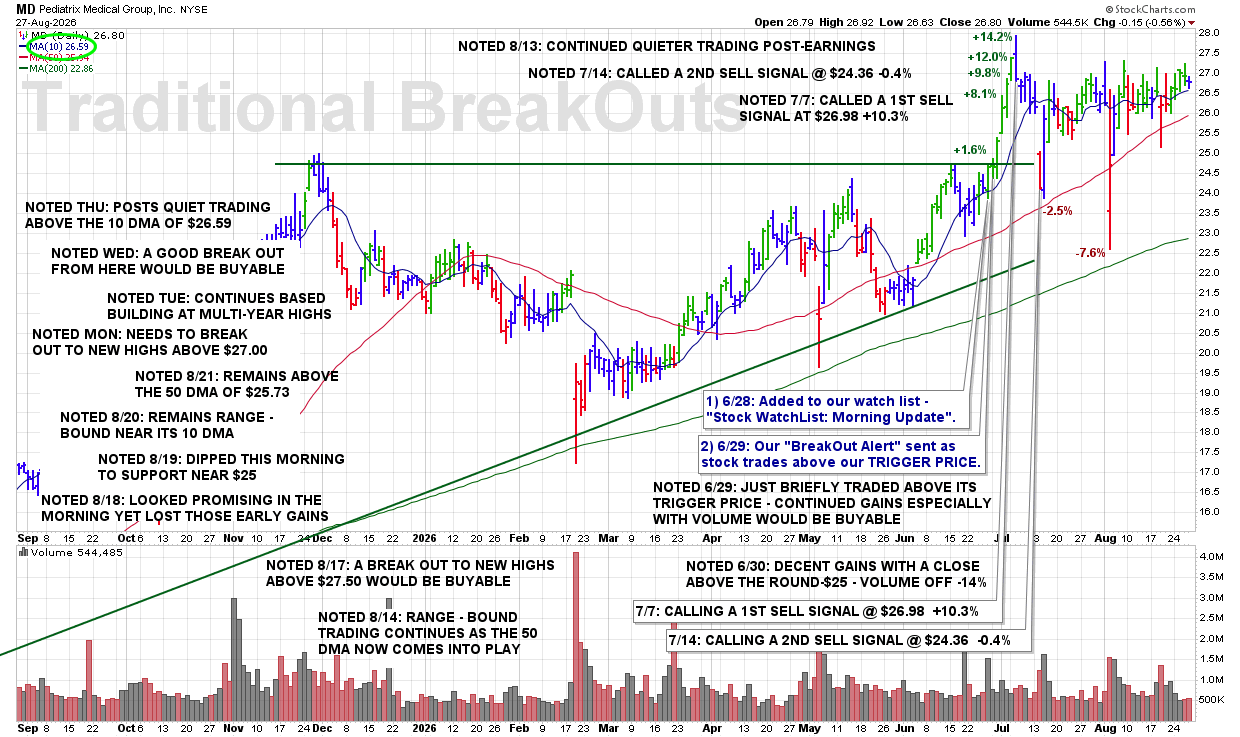
THU 8/27: MD – Posts Quiet Trading Above the 10 DMA of $26.59

8:05 PM – Here is our latest chart update for this recent breakout from our Traditional BreakOuts Watch List.

CLICK/TAP CHART TO ZOOM
Chart services courtesy of stockcharts.com. Annotations by James Taulman.

We are currently reporting on this stock as an active holding and continue to monitor the stock closely for any technical SELL SIGNALS.

The focus always remains on price/volume action around key support levels, including the 10 DMA, 50 DMA, and any nearby trendline or ROUND-$ support.

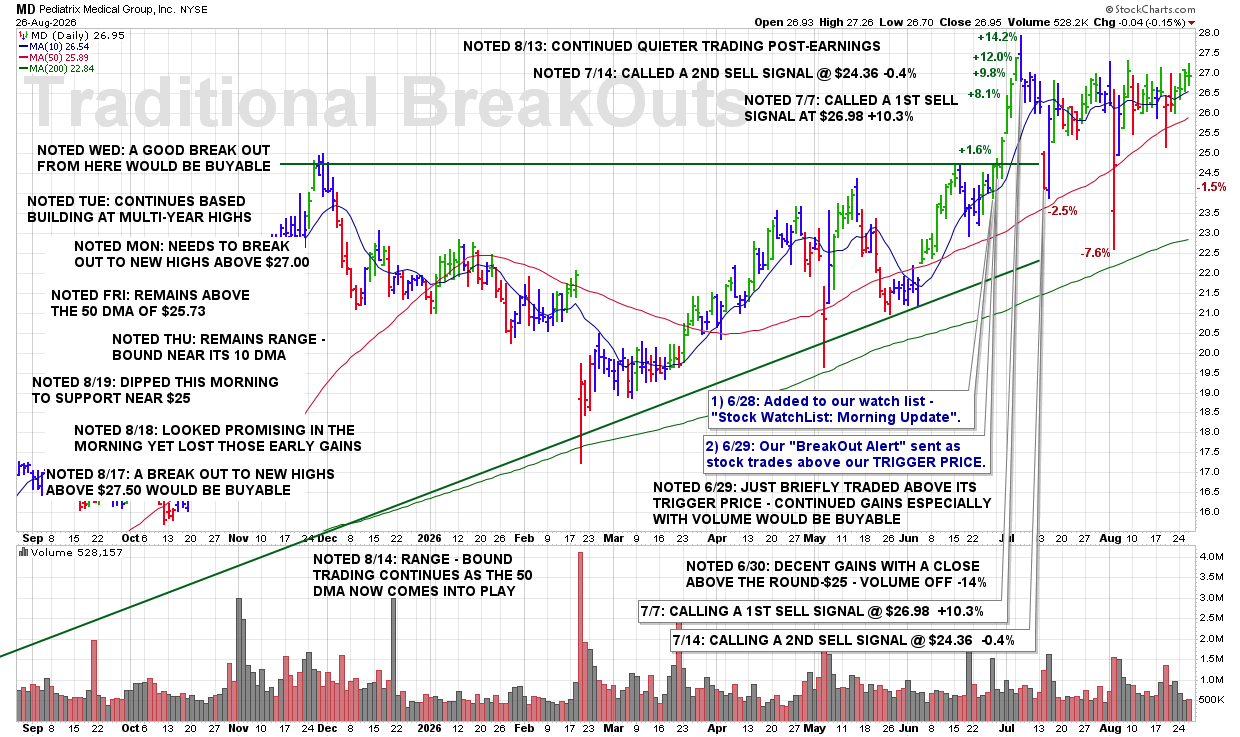
WED 8/26: MD – A Good Break Out From Here Would Be Buyable

8:35 PM – Here is our latest chart update for this recent breakout from our Traditional BreakOuts Watch List.

CLICK/TAP CHART TO ZOOM
Chart services courtesy of stockcharts.com. Annotations by James Taulman.

We are currently reporting on this stock as an active holding and continue to monitor the stock closely for any technical SELL SIGNALS.

The focus always remains on price/volume action around key support levels, including the 10 DMA, 50 DMA, and any nearby trendline or ROUND-$ support.

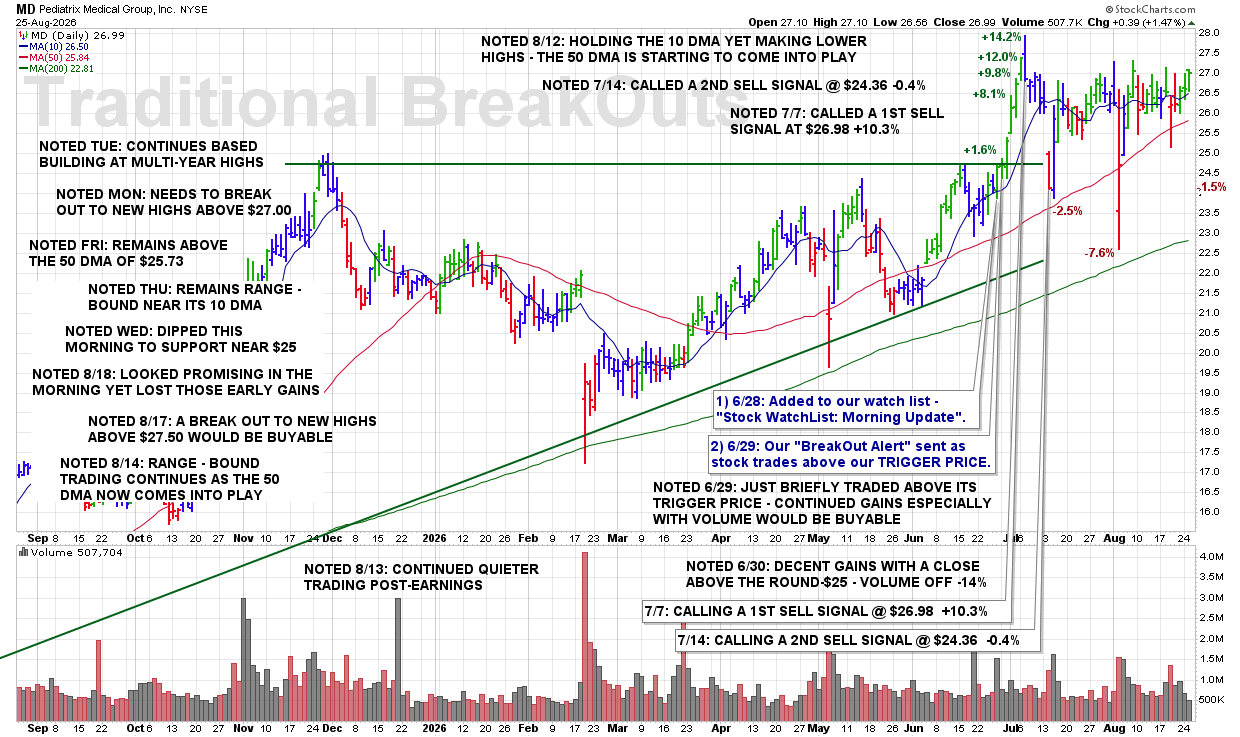
TUE 8/25: MD – Continues Based Building at Multi-Year Highs

8:05 PM – Here is our latest chart update for this recent breakout from our Traditional BreakOuts Watch List.

CLICK/TAP CHART TO ZOOM
Chart services courtesy of stockcharts.com. Annotations by James Taulman.

We are currently reporting on this stock as an active holding and continue to monitor the stock closely for any technical SELL SIGNALS.

The focus always remains on price/volume action around key support levels, including the 10 DMA, 50 DMA, and any nearby trendline or ROUND-$ support.

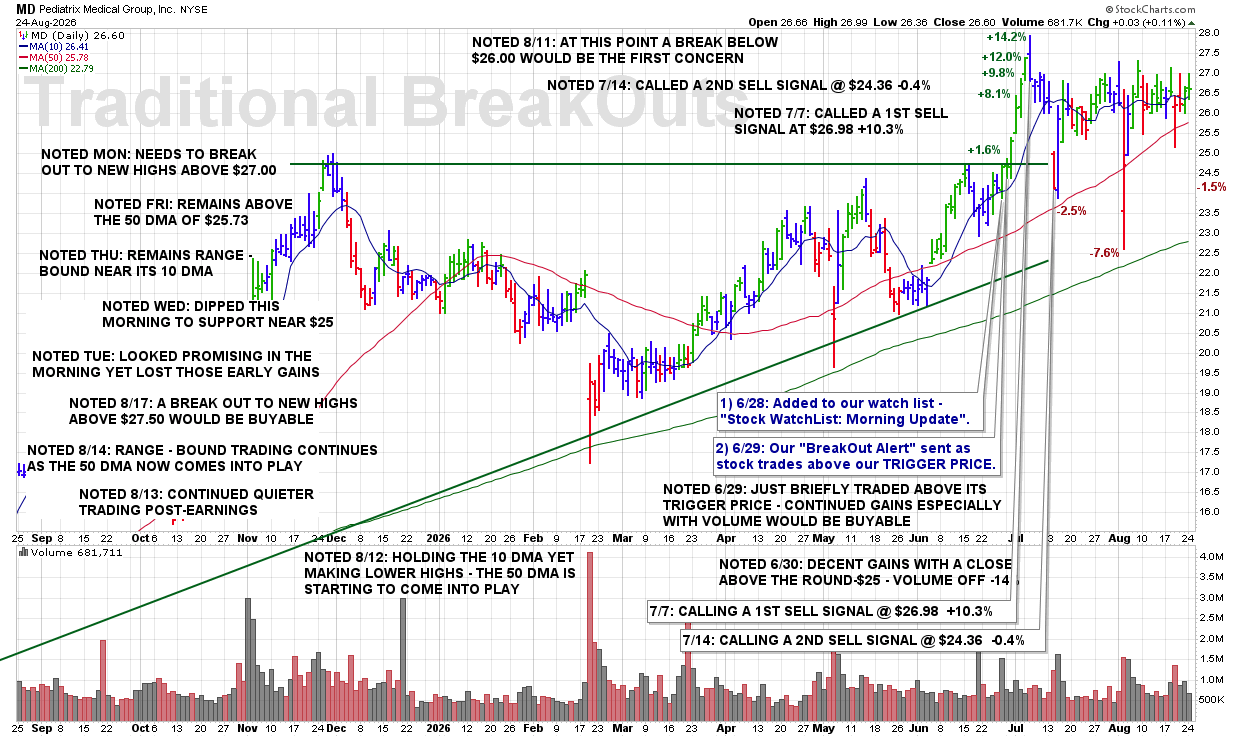
MON 8/24: MD – Needs to Break Out to New Highs Above $27.00

8:05 PM – Here is our latest chart update for this recent breakout from our Traditional BreakOuts Watch List.

CLICK/TAP CHART TO ZOOM
Chart services courtesy of stockcharts.com. Annotations by James Taulman.

We are currently reporting on this stock as an active holding and continue to monitor the stock closely for any technical SELL SIGNALS.

The focus always remains on price/volume action around key support levels, including the 10 DMA, 50 DMA, and any nearby trendline or ROUND-$ support.

FRI 8/21: MD – Remains Above the 50 DMA of $25.73

8:35 PM – Here is our latest chart update for this recent breakout from our Traditional BreakOuts Watch List.

CLICK/TAP CHART TO ZOOM
Chart services courtesy of stockcharts.com. Annotations by James Taulman.

We are currently reporting on this stock as an active holding and continue to monitor the stock closely for any technical SELL SIGNALS.

The focus always remains on price/volume action around key support levels, including the 10 DMA, 50 DMA, and any nearby trendline or ROUND-$ support.

THU 8/20: MD – Remains Range-Bound Near Its 10 DMA

8:05 PM – Here is our latest chart update for this recent breakout from our Traditional BreakOuts Watch List.

CLICK/TAP CHART TO ZOOM
Chart services courtesy of stockcharts.com. Annotations by James Taulman.

We are currently reporting on this stock as an active holding and continue to monitor the stock closely for any technical SELL SIGNALS.

The focus always remains on price/volume action around key support levels, including the 10 DMA, 50 DMA, and any nearby trendline or ROUND-$ support.

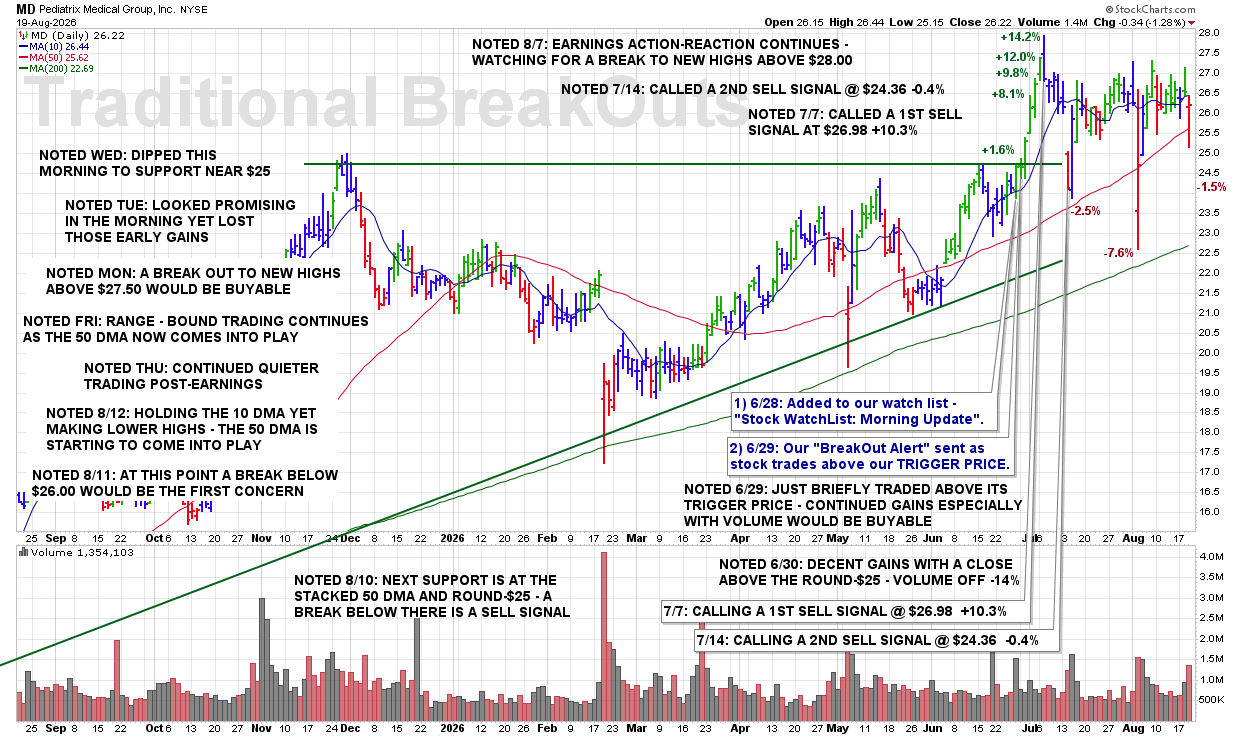
WED 8/19: MD – Dipped This Morning to Support Near $25

9:05 PM – Here is our latest chart update for this recent breakout from our Traditional BreakOuts Watch List.

CLICK/TAP CHART TO ZOOM
Chart services courtesy of stockcharts.com. Annotations by James Taulman.

We are currently reporting on this stock as an active holding and continue to monitor the stock closely for any technical SELL SIGNALS.

The focus always remains on price/volume action around key support levels, including the 10 DMA, 50 DMA, and any nearby trendline or ROUND-$ support.

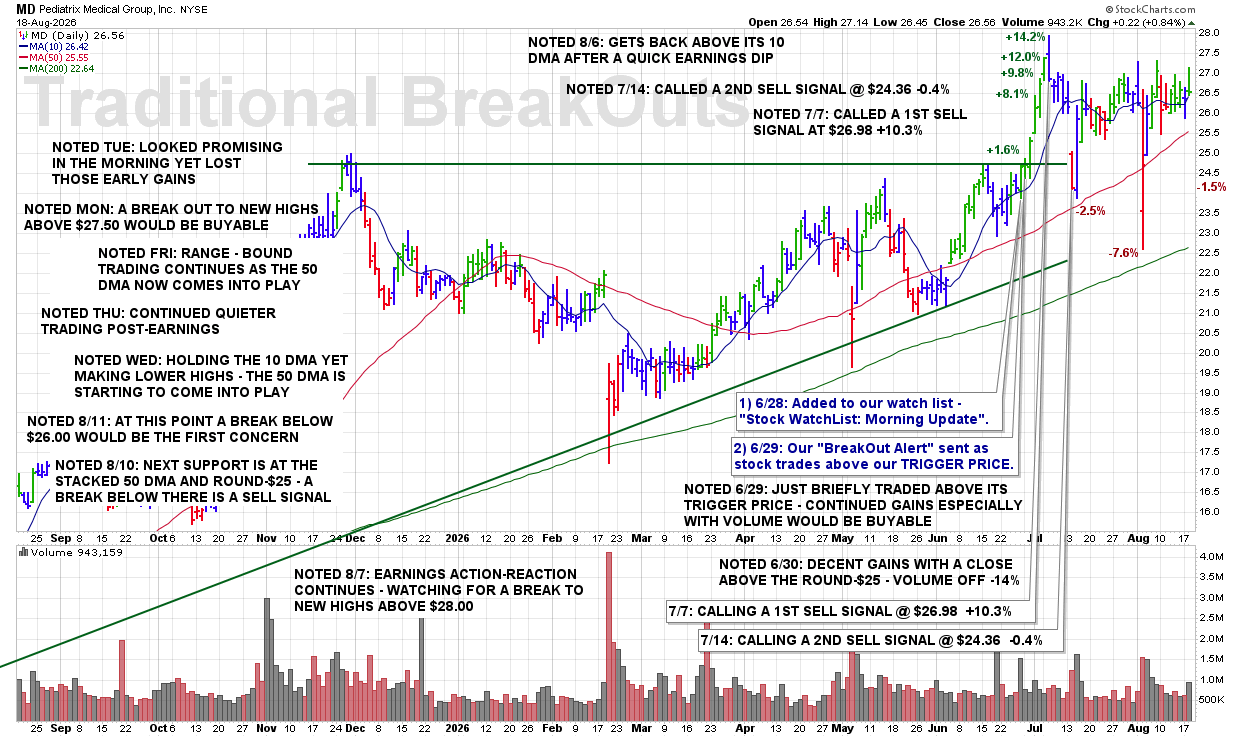
TUE 8/18: MD – Looked Promising in the Morning Yet Lost Those Early Gains

9:05 PM – Here is our latest chart update for this recent breakout from our Traditional BreakOuts Watch List.

CLICK/TAP CHART TO ZOOM
Chart services courtesy of stockcharts.com. Annotations by James Taulman.

We are currently reporting on this stock as an active holding and continue to monitor the stock closely for any technical SELL SIGNALS.

The focus always remains on price/volume action around key support levels, including the 10 DMA, 50 DMA, and any nearby trendline or ROUND-$ support.

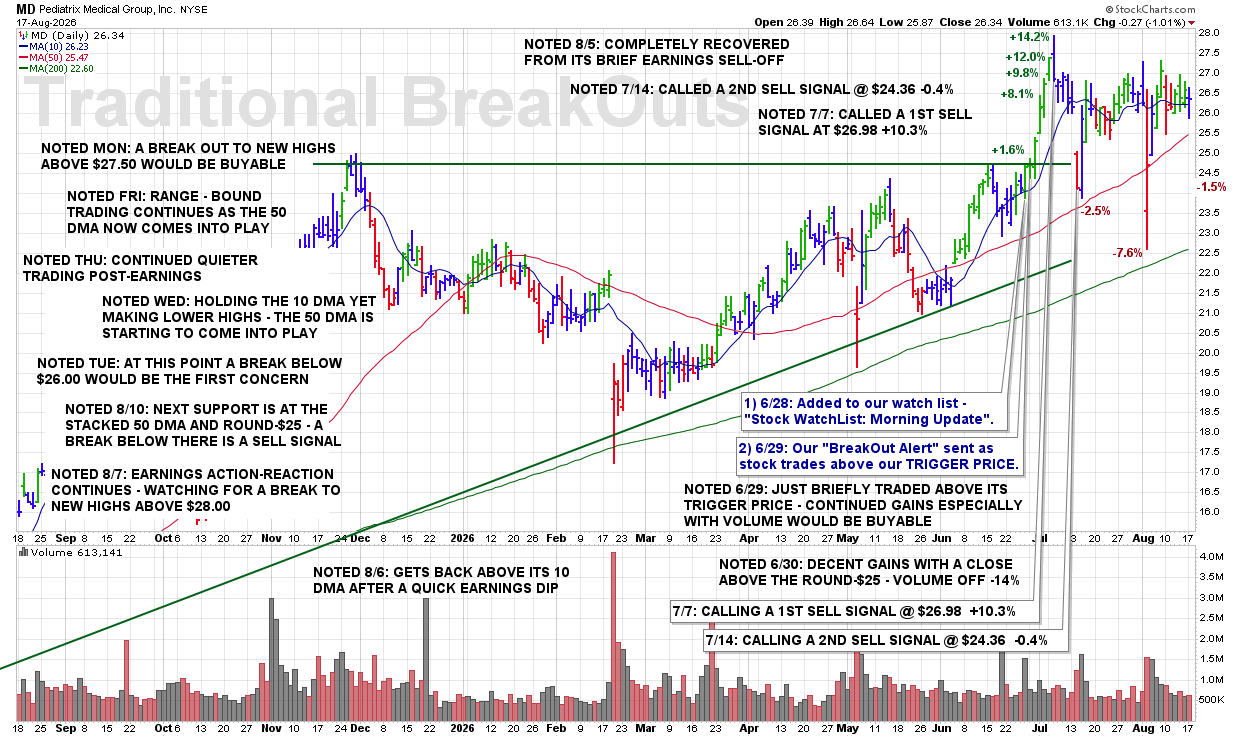
MON 8/17: MD – A Break Out to New Highs Above $27.50 Would Be Buyable

8:40 PM – Here is our latest chart update for this recent breakout from our Traditional BreakOuts Watch List.

CLICK/TAP CHART TO ZOOM
Chart services courtesy of stockcharts.com. Annotations by James Taulman.

We are currently reporting on this stock as an active holding and continue to monitor the stock closely for any technical SELL SIGNALS.

The focus always remains on price/volume action around key support levels, including the 10 DMA, 50 DMA, and any nearby trendline or ROUND-$ support.

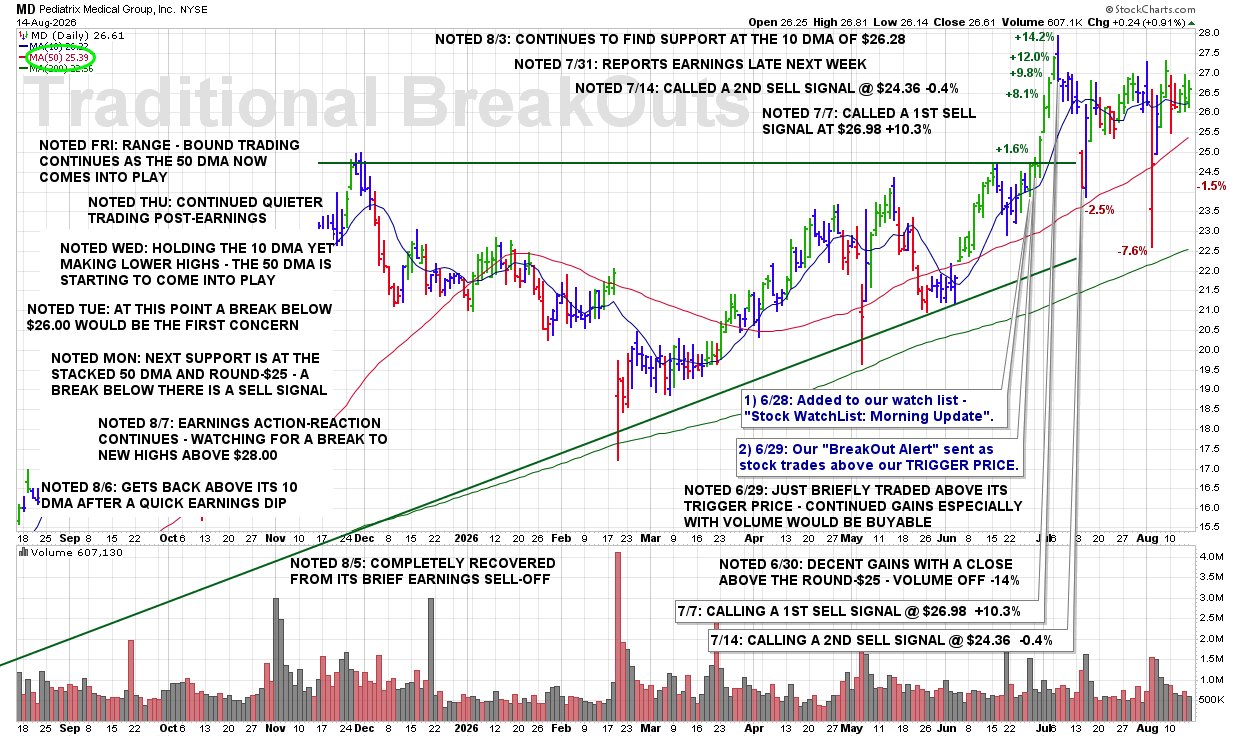
FRI 8/14: MD – Range-Bound Trading Continues as the 50 DMA Now Comes Into Play

8:10 PM – Here is our latest chart update for this recent breakout from our Traditional BreakOuts Watch List.

CLICK/TAP CHART TO ZOOM
Chart services courtesy of stockcharts.com. Annotations by James Taulman.

We are currently reporting on this stock as an active holding and continue to monitor the stock closely for any technical SELL SIGNALS.

The focus always remains on price/volume action around key support levels, including the 10 DMA, 50 DMA, and any nearby trendline or ROUND-$ support.

THU 8/13: MD – Continued Quieter Trading Post-Earnings

8:10 PM – Here is our latest chart update for this recent breakout from our Traditional BreakOuts Watch List.

CLICK/TAP CHART TO ZOOM
Chart services courtesy of stockcharts.com. Annotations by James Taulman.

We are currently reporting on this stock as an active holding and continue to monitor the stock closely for any technical SELL SIGNALS.

The focus always remains on price/volume action around key support levels, including the 10 DMA, 50 DMA, and any nearby trendline or ROUND-$ support.

WED 8/12: MD – Holding the 10 DMA Yet Making Lower Highs – the 50 DMA Is Starting to Come Into Play

10:10 PM – Here is our latest chart update for this recent breakout from our Traditional BreakOuts Watch List.

CLICK/TAP CHART TO ZOOM
Chart services courtesy of stockcharts.com. Annotations by James Taulman.

We are currently reporting on this stock as an active holding and continue to monitor the stock closely for any technical SELL SIGNALS.

The focus always remains on price/volume action around key support levels, including the 10 DMA, 50 DMA, and any nearby trendline or ROUND-$ support.

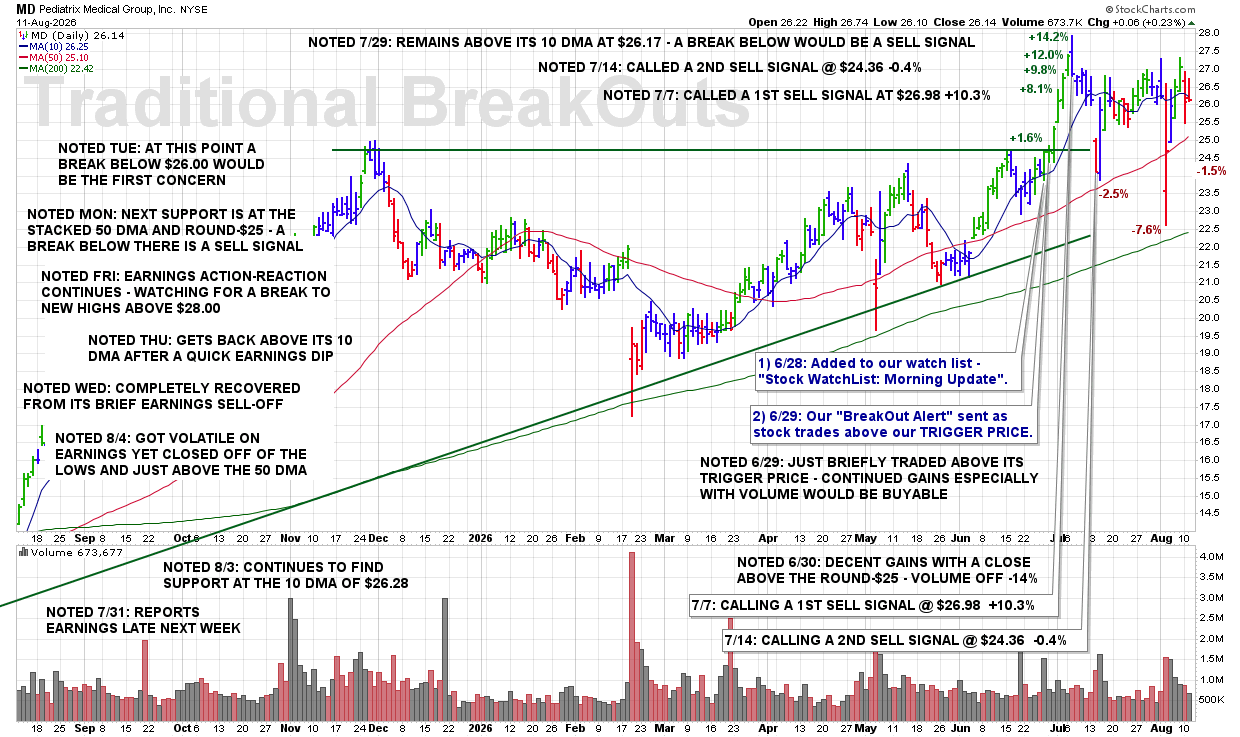
TUE 8/11: MD – At This Point a Break Below $26.00 Would Be the First Concern

8:10 PM – Here is our latest chart update for this recent breakout from our Traditional BreakOuts Watch List.

CLICK/TAP CHART TO ZOOM
Chart services courtesy of stockcharts.com. Annotations by James Taulman.

We are currently reporting on this stock as an active holding and continue to monitor the stock closely for any technical SELL SIGNALS.

The focus always remains on price/volume action around key support levels, including the 10 DMA, 50 DMA, and any nearby trendline or ROUND-$ support.

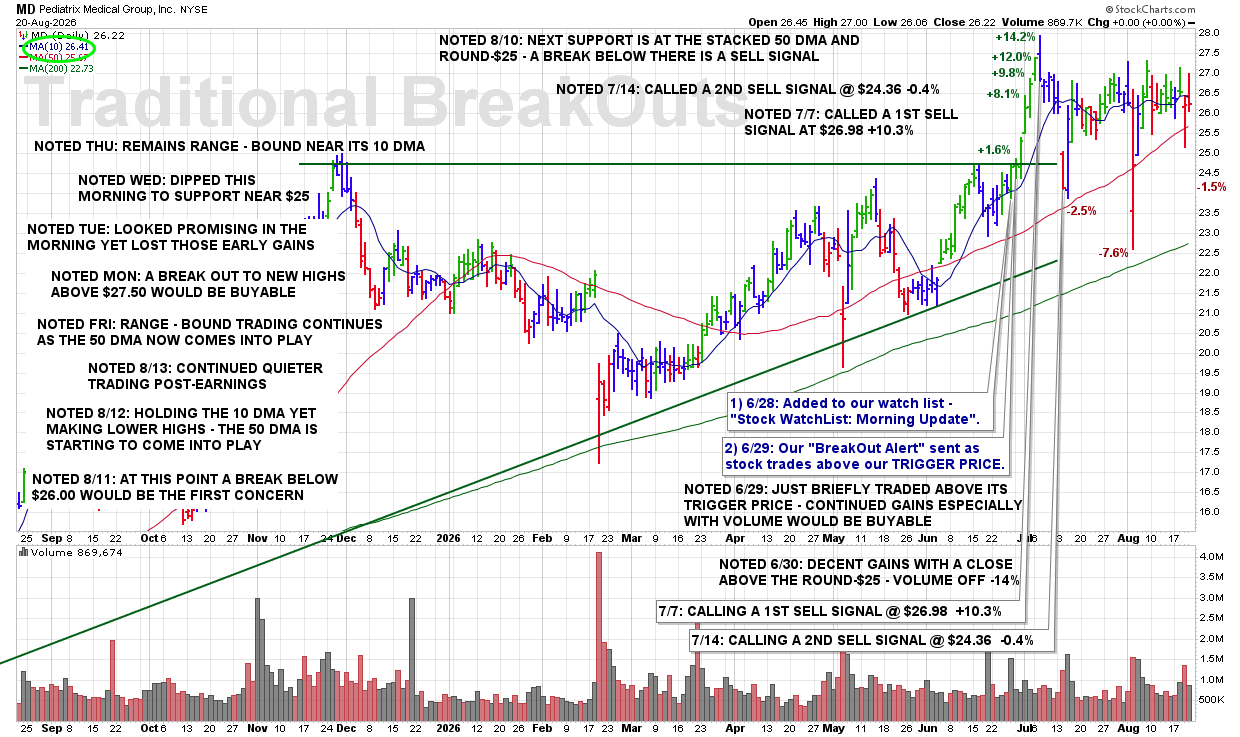
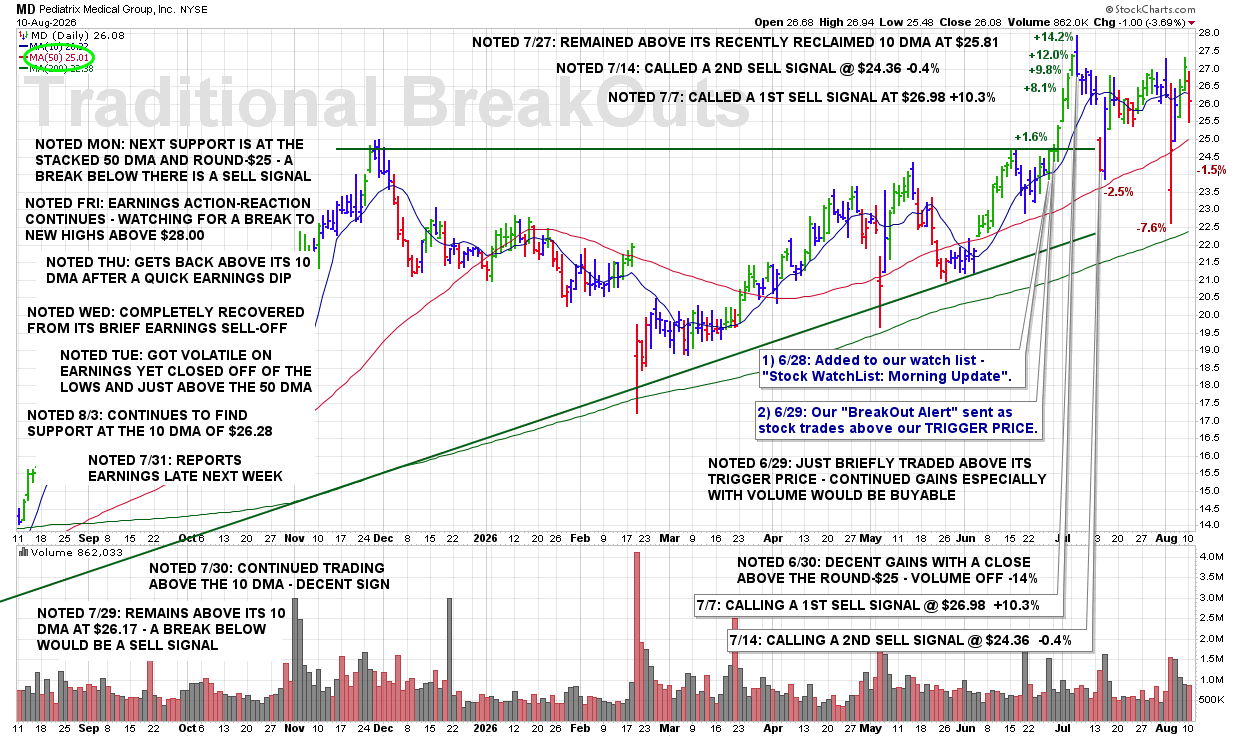
MON 8/10: MD – Next Support Is at the Stacked 50 DMA and Round-$25 – a Break Below There Is a Sell Signal

8:20 PM – Here is our latest chart update for this recent breakout from our Traditional BreakOuts Watch List.

CLICK/TAP CHART TO ZOOM
Chart services courtesy of stockcharts.com. Annotations by James Taulman.

We are currently reporting on this stock as an active holding and continue to monitor the stock closely for any technical SELL SIGNALS.

The focus always remains on price/volume action around key support levels, including the 10 DMA, 50 DMA, and any nearby trendline or ROUND-$ support.

FRI 8/7: MD – Earnings Action-Reaction Continues – Watching for a Break to New Highs Above $28.00

7:20 PM – Here is our latest chart update for this recent breakout from our Traditional BreakOuts Watch List.

CLICK/TAP CHART TO ZOOM
Chart services courtesy of stockcharts.com. Annotations by James Taulman.

We are currently reporting on this stock as an active holding and continue to monitor the stock closely for any technical SELL SIGNALS.

The focus always remains on price/volume action around key support levels, including the 10 DMA, 50 DMA, and any nearby trendline or ROUND-$ support.

THU 8/6: MD – Gets Back Above Its 10 DMA After a Quick Earnings Dip

10:20 PM – Here is our latest chart update for this recent breakout from our Traditional BreakOuts Watch List.

CLICK/TAP CHART TO ZOOM
Chart services courtesy of stockcharts.com. Annotations by James Taulman.

We are currently reporting on this stock as an active holding and continue to monitor the stock closely for any technical SELL SIGNALS.

The focus always remains on price/volume action around key support levels, including the 10 DMA, 50 DMA, and any nearby trendline or ROUND-$ support.

WED 8/5: MD – Completely Recovered From Its Brief Earnings Sell-Off

8:30 PM – Here is our latest chart update for this recent breakout from our Traditional BreakOuts Watch List.

CLICK/TAP CHART TO ZOOM
Chart services courtesy of stockcharts.com. Annotations by James Taulman.

We are currently reporting on this stock as an active holding and continue to monitor the stock closely for any technical SELL SIGNALS.

The focus always remains on price/volume action around key support levels, including the 10 DMA, 50 DMA, and any nearby trendline or ROUND-$ support.

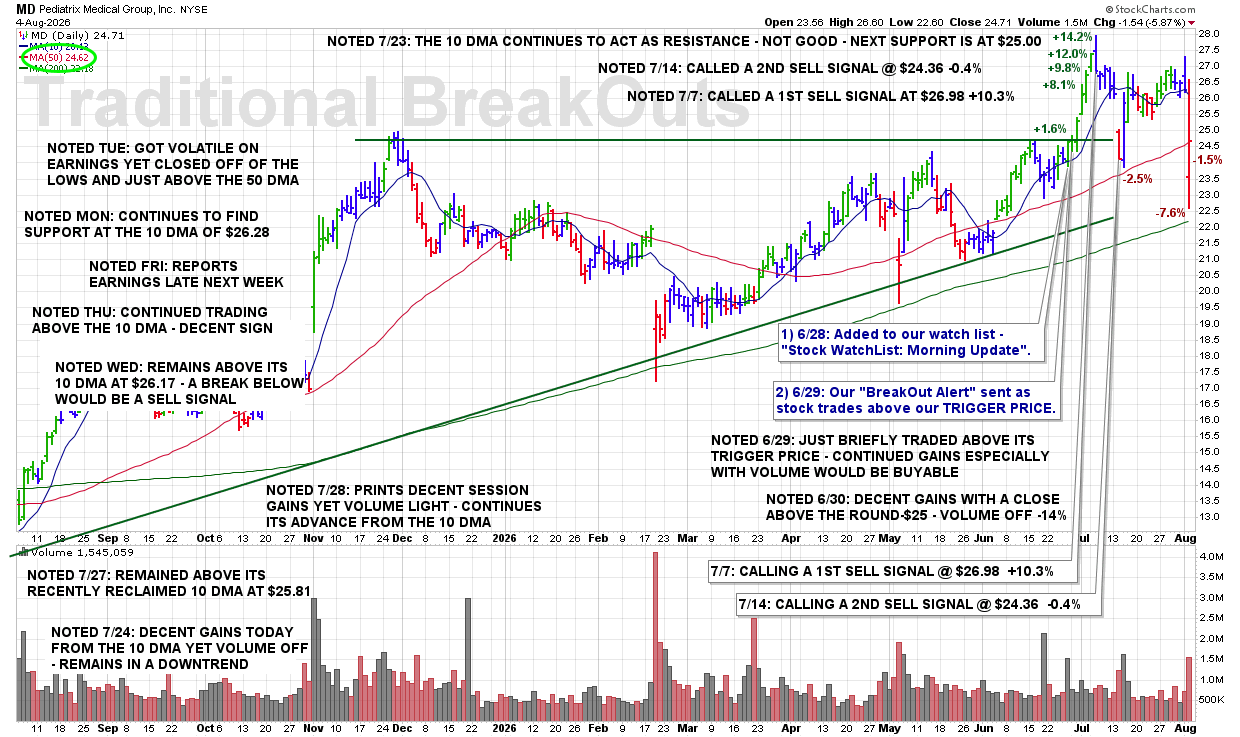
TUE 8/4: MD – Got Volatile on Earnings Yet Closed Off of the Lows and Just Above the 50 DMA

9:05 PM – Here is our latest chart update for this recent breakout from our Traditional BreakOuts Watch List.

CLICK/TAP CHART TO ZOOM
Chart services courtesy of stockcharts.com. Annotations by James Taulman.

We are currently reporting on this stock as an active holding and continue to monitor the stock closely for any technical SELL SIGNALS.

The focus always remains on price/volume action around key support levels, including the 10 DMA, 50 DMA, and any nearby trendline or ROUND-$ support.

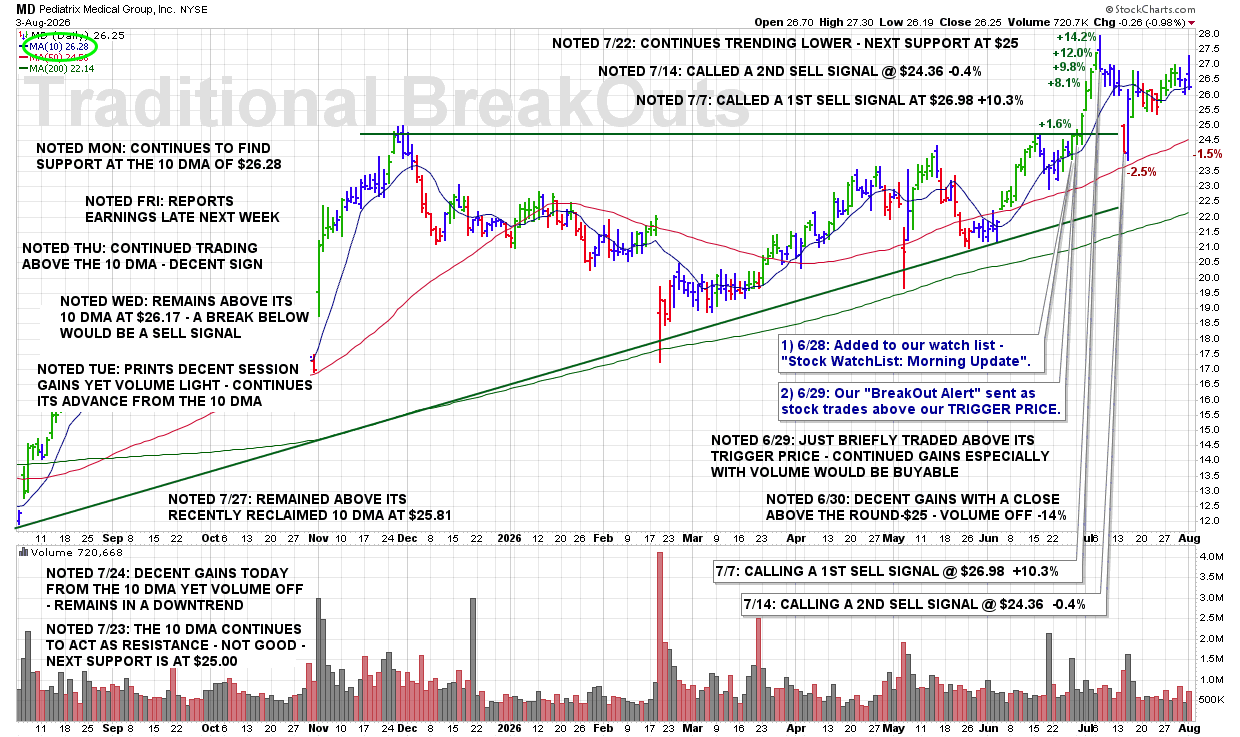
MON 8/3: MD – Continues to Find Support at the 10 DMA of $26.28

9:05 PM – Here is our latest chart update for this recent breakout from our Traditional BreakOuts Watch List.

CLICK/TAP CHART TO ZOOM
Chart services courtesy of stockcharts.com. Annotations by James Taulman.

We are currently reporting on this stock as an active holding and continue to monitor the stock closely for any technical SELL SIGNALS.

The focus always remains on price/volume action around key support levels, including the 10 DMA, 50 DMA, and any nearby trendline or ROUND-$ support.

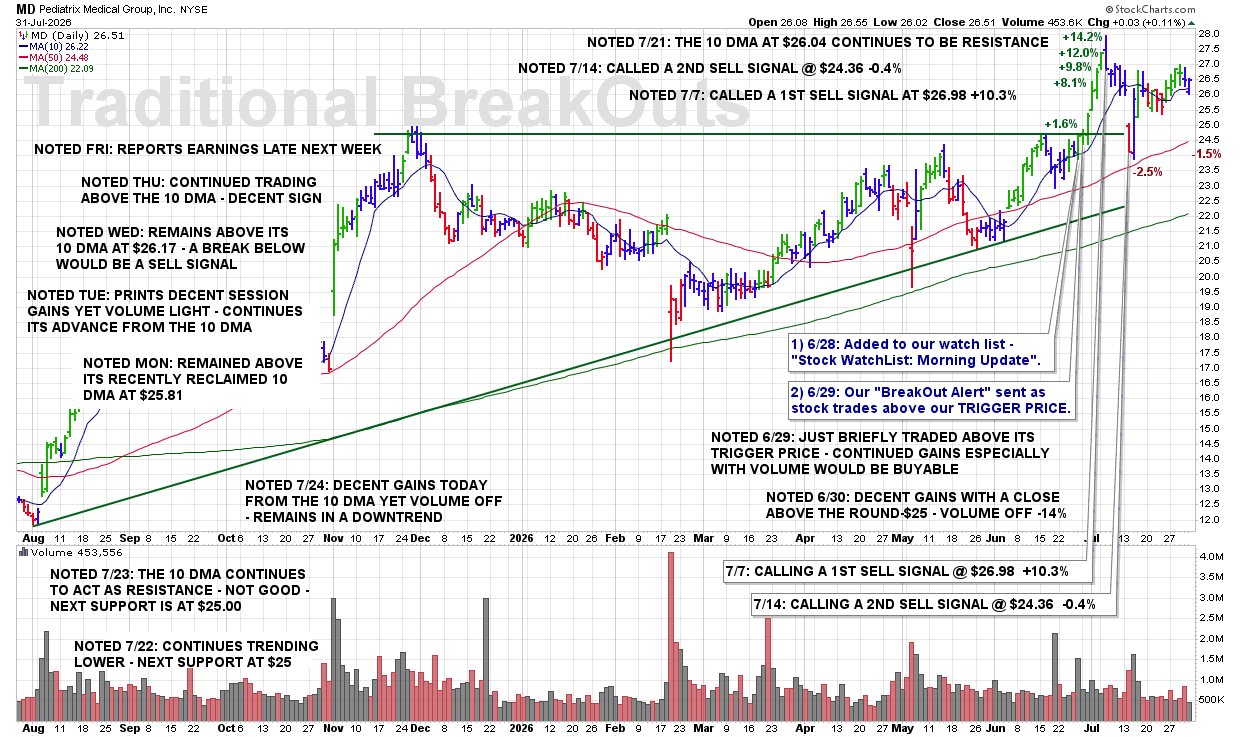
FRI 7/31: MD – Reports Earnings Late Next Week

8:05 PM – Here is our latest chart update for this recent breakout from our Traditional BreakOuts Watch List.

CLICK/TAP CHART TO ZOOM
Chart services courtesy of stockcharts.com. Annotations by James Taulman.

We are currently reporting on this stock as an active holding and continue to monitor the stock closely for any technical SELL SIGNALS.

The focus always remains on price/volume action around key support levels, including the 10 DMA, 50 DMA, and any nearby trendline or ROUND-$ support.

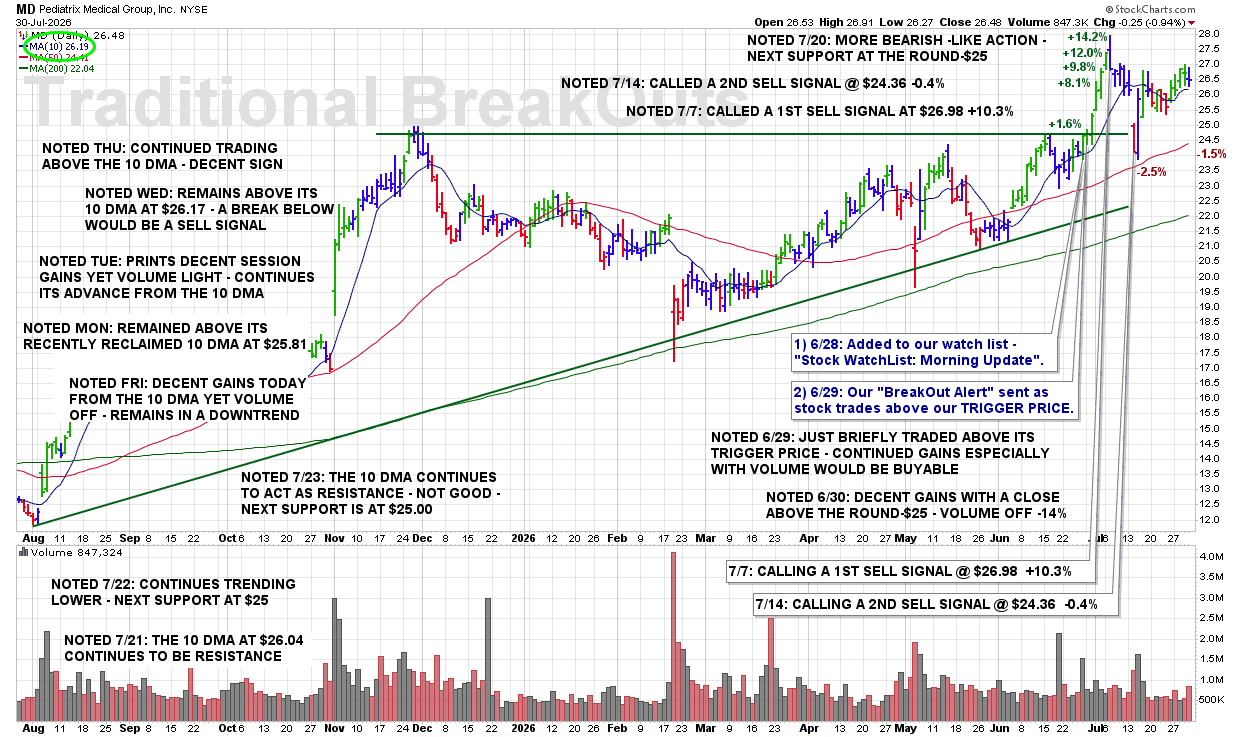
THU 7/30: MD – Continued Trading Above the 10 DMA – Decent Sign

7:35 PM – Here is our latest chart update for this recent breakout from our Traditional BreakOuts Watch List.

CLICK/TAP CHART TO ZOOM
Chart services courtesy of stockcharts.com. Annotations by James Taulman.

We are currently reporting on this stock as an active holding and continue to monitor the stock closely for any technical SELL SIGNALS.

The focus always remains on price/volume action around key support levels, including the 10 DMA, 50 DMA, and any nearby trendline or ROUND-$ support.

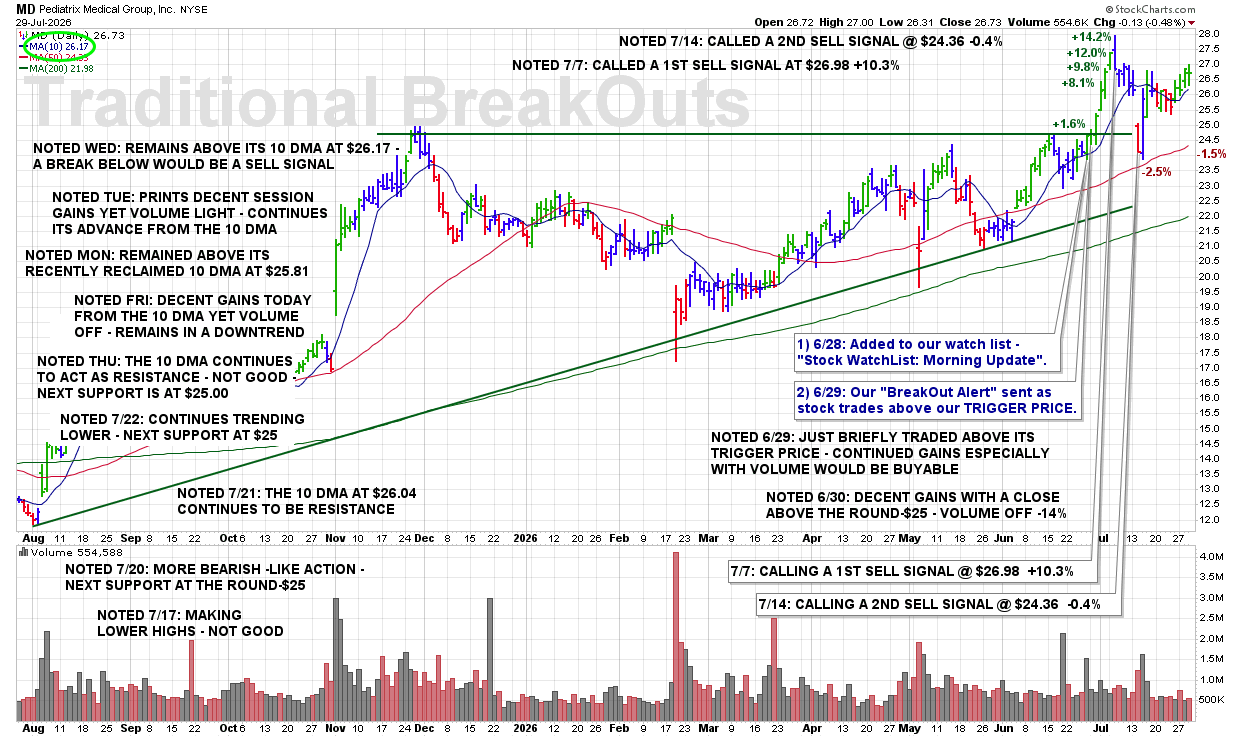
WED 7/29: MD – Remains Above Its 10 DMA at $26.17 – a Break Below Would Be a Sell Signal

8:45 PM – Here is our latest chart update for this recent breakout from our Traditional BreakOuts Watch List.

CLICK/TAP CHART TO ZOOM
Chart services courtesy of stockcharts.com. Annotations by James Taulman.

We are currently reporting on this stock as an active holding and continue to monitor the stock closely for any technical SELL SIGNALS.

The focus always remains on price/volume action around key support levels, including the 10 DMA, 50 DMA, and any nearby trendline or ROUND-$ support.

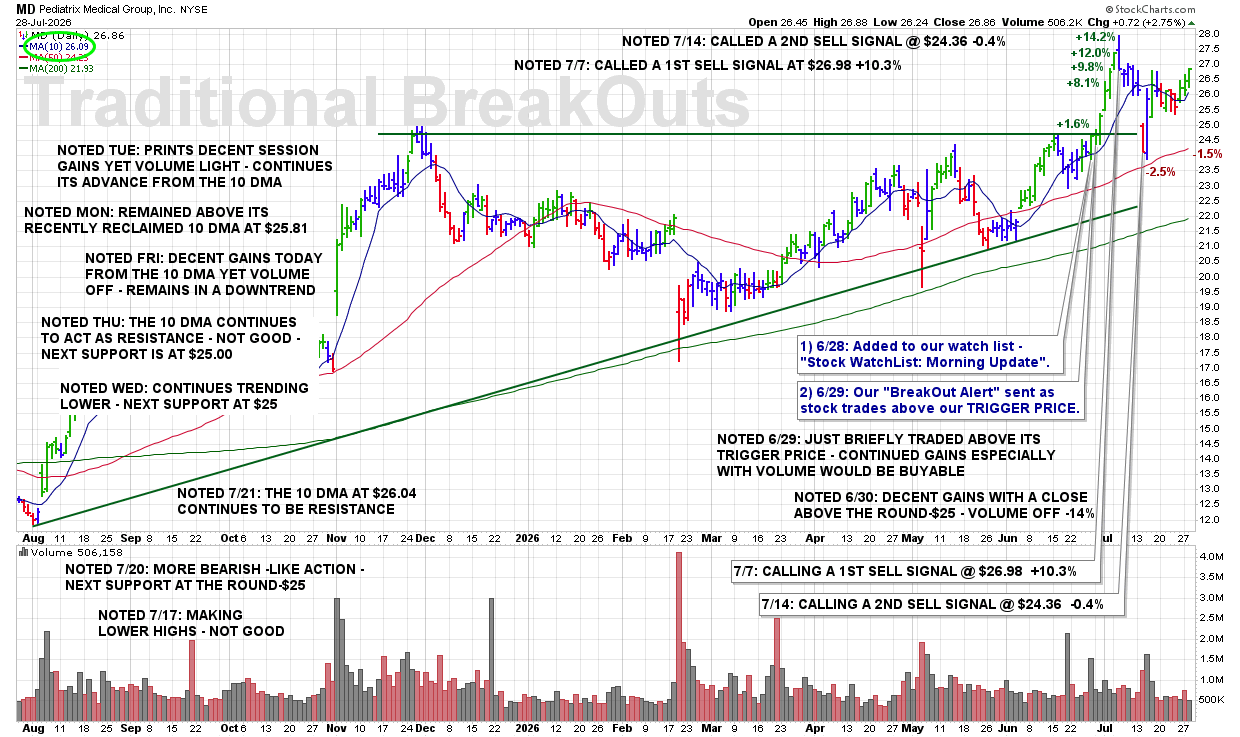
TUE 7/28: MD – Prints Decent Session Gains Yet Volume Light – Continues Its Advance From the 10 DMA

8:45 PM – Here is our latest chart update for this recent breakout from our Traditional BreakOuts Watch List.

CLICK/TAP CHART TO ZOOM
Chart services courtesy of stockcharts.com. Annotations by James Taulman.

We are currently reporting on this stock as an active holding and continue to monitor the stock closely for any technical SELL SIGNALS.

The focus always remains on price/volume action around key support levels, including the 10 DMA, 50 DMA, and any nearby trendline or ROUND-$ support.

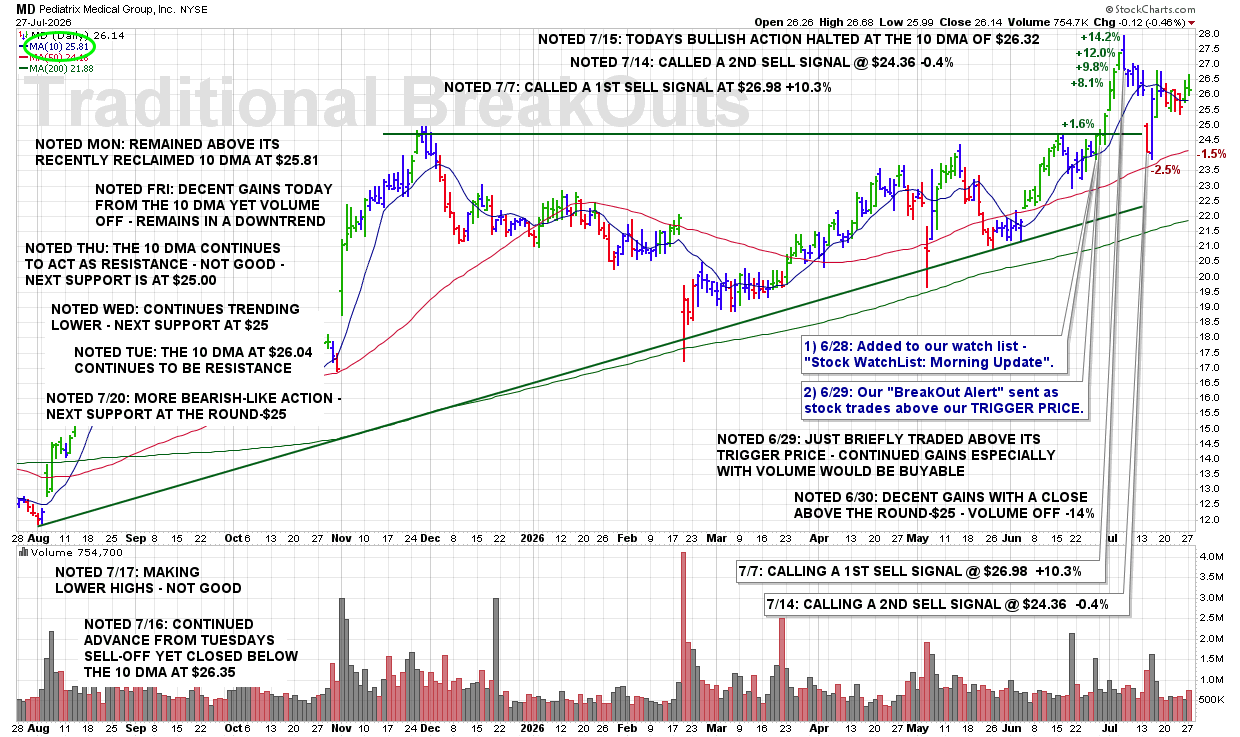
MON 7/27: MD – Remained Above Its Recently Reclaimed 10 DMA at $25.81

8:35 PM – Here is our latest chart update for this recent breakout from our Traditional BreakOuts Watch List.

CLICK/TAP CHART TO ZOOM
Chart services courtesy of stockcharts.com. Annotations by James Taulman.

We are currently reporting on this stock as an active holding and continue to monitor the stock closely for any technical SELL SIGNALS.

The focus always remains on price/volume action around key support levels, including the 10 DMA, 50 DMA, and any nearby trendline or ROUND-$ support.

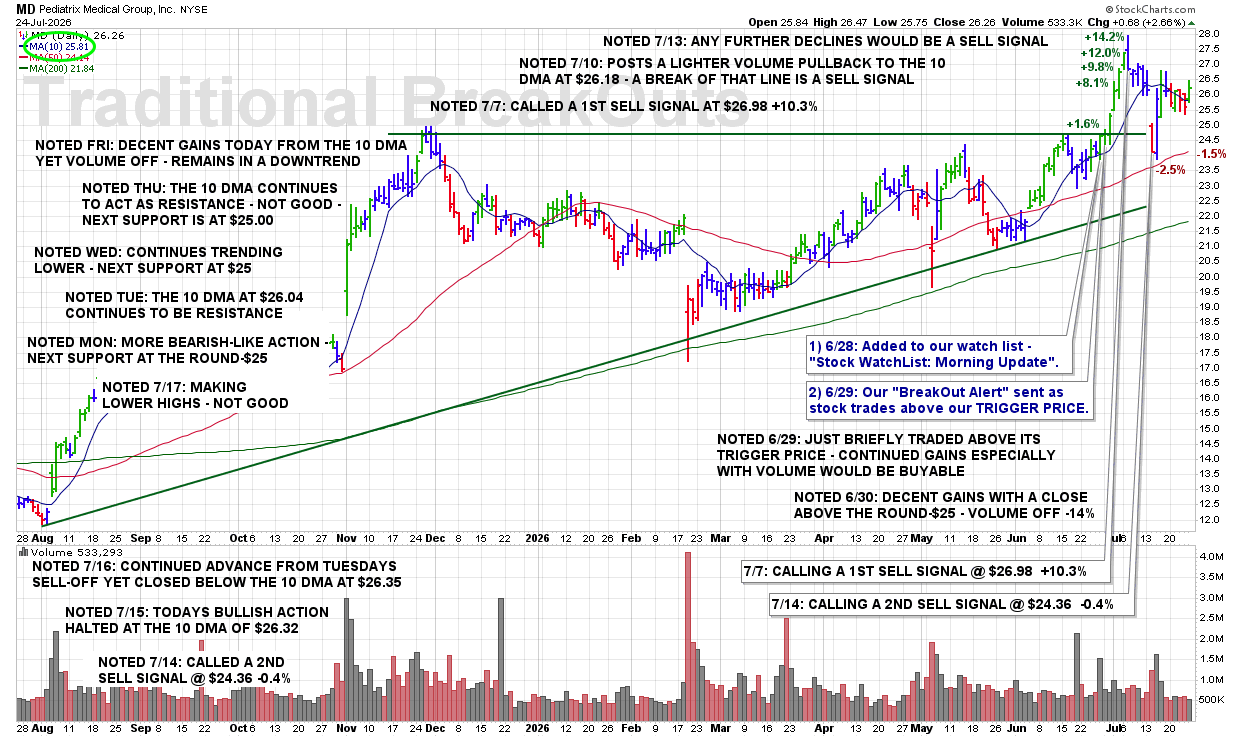
FRI 7/24: MD – Decent Gains Today From the 10 DMA Yet Volume Off – Remains in a Downtrend

8:35 PM – MD posted decent gains today from the 10 DMA, but volume remained below normal. While the bounce is encouraging, the stock remains in a broader downtrend and still has technical repair to do.

CLICK/TAP CHART TO ZOOM
Chart services courtesy of stockcharts.com. Annotations by James Taulman.

We are currently reporting on this stock as an active holding and continue to monitor the stock closely for any technical SELL SIGNALS.

The focus always remains on price/volume action around key support levels, including the 10 DMA, 50 DMA, and any nearby trendline or ROUND-$ support.

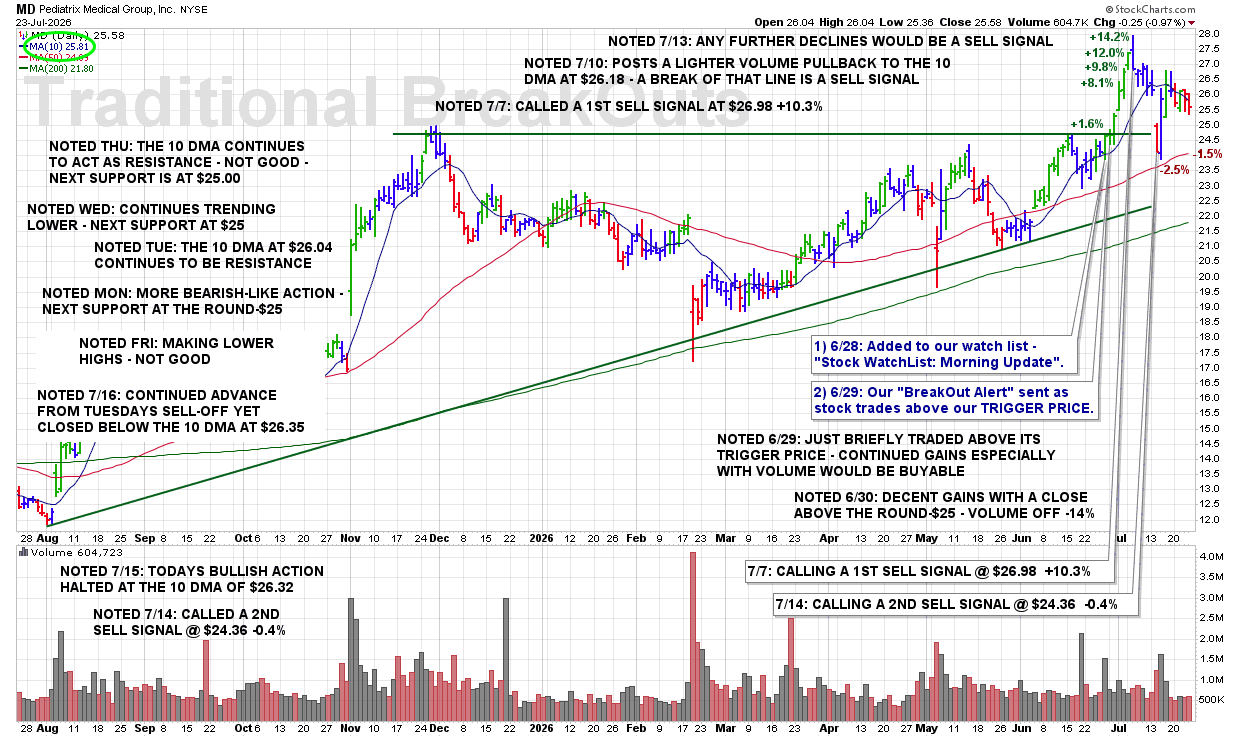
THU 7/23: MD – The 10 DMA Continues to Act as Resistance – Not Good – Next Support Is at $25.00

8:35 PM – Here is our latest chart update for this recent breakout from our Traditional BreakOuts Watch List.

CLICK/TAP CHART TO ZOOM
Chart services courtesy of stockcharts.com. Annotations by James Taulman.

We are currently reporting on this stock as an active holding and continue to monitor the stock closely for any technical SELL SIGNALS.

The focus always remains on price/volume action around key support levels, including the 10 DMA, 50 DMA, and any nearby trendline or ROUND-$ support.

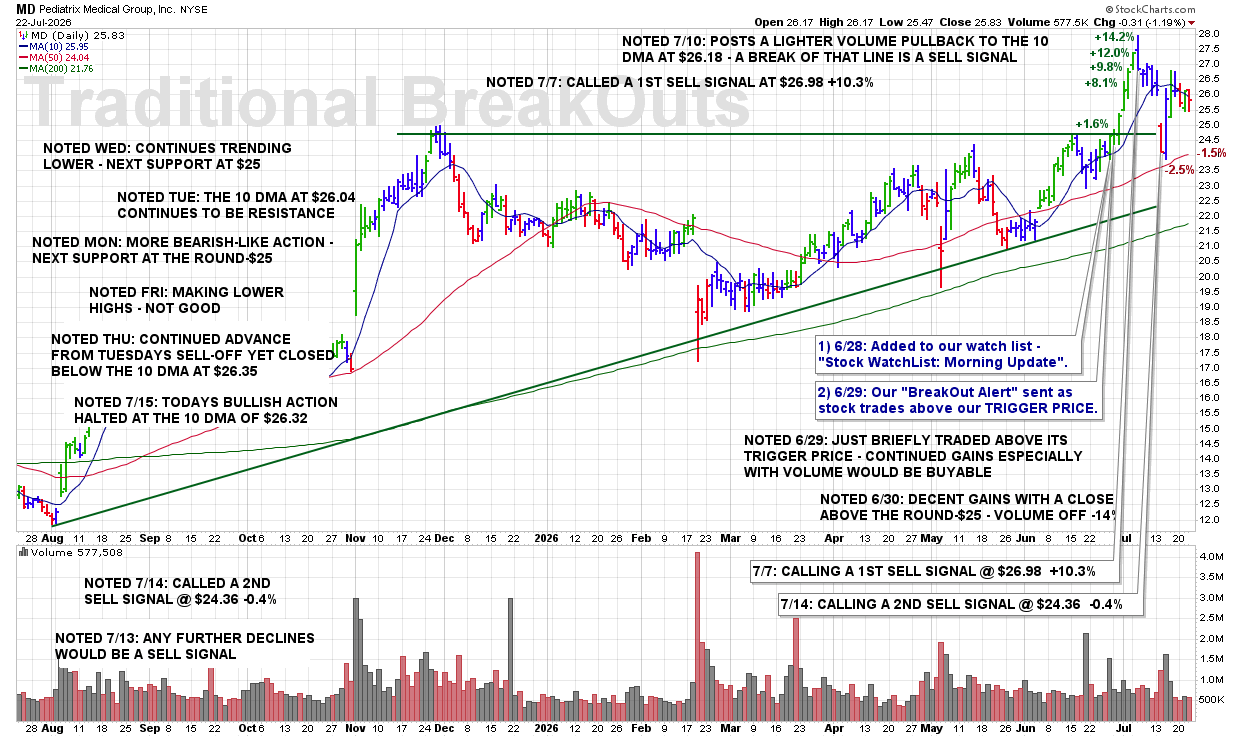
WED 7/22: MD – Continues Trending Lower – Next Support at $25

9:35 PM – Here is our latest chart update for this recent breakout from our Traditional BreakOuts Watch List.

CLICK/TAP CHART TO ZOOM
Chart services courtesy of stockcharts.com. Annotations by James Taulman.

We are currently reporting on this stock as an active holding and continue to monitor the stock closely for any technical SELL SIGNALS.

The focus always remains on price/volume action around key support levels, including the 10 DMA, 50 DMA, and any nearby trendline or ROUND-$ support.

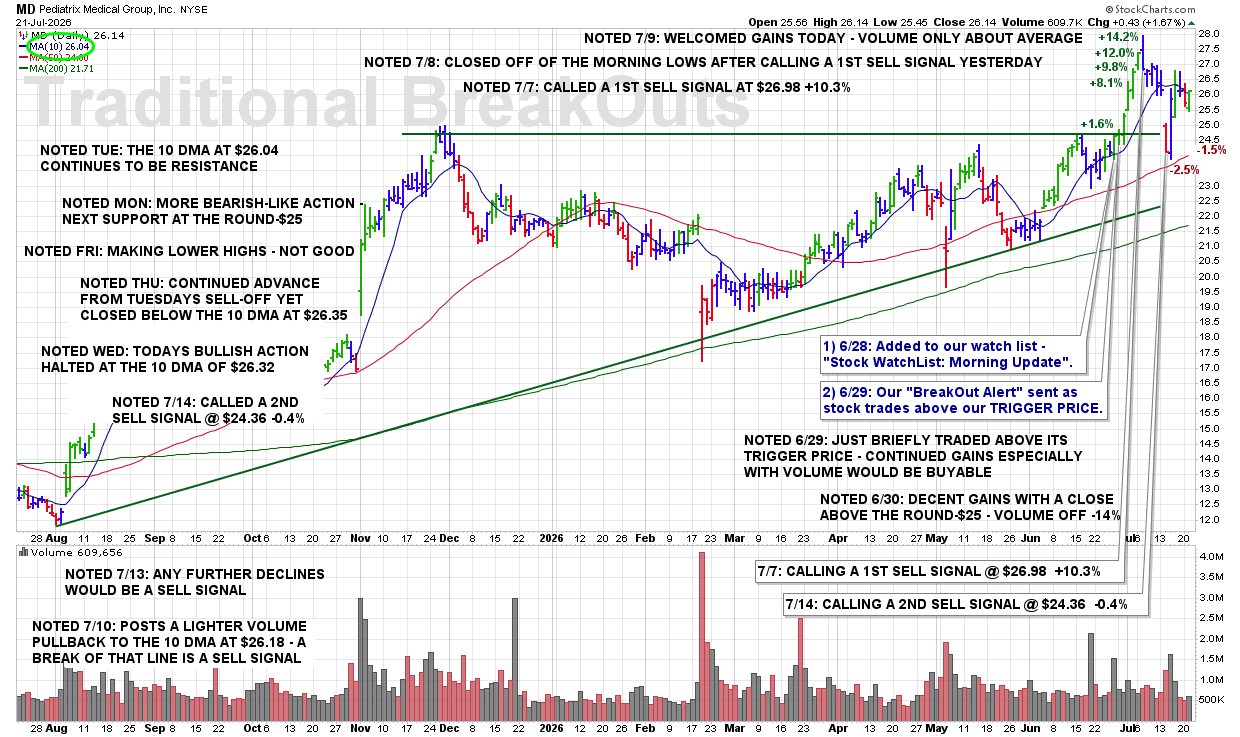
TUE 7/21: MD – The 10 DMA at $26.04 Continues to Be Resistance

9:40 PM – Here is our latest chart update for this recent breakout from our Traditional BreakOuts Watch List.

CLICK/TAP CHART TO ZOOM
Chart services courtesy of stockcharts.com. Annotations by James Taulman.

We are currently reporting on this stock as an active holding and continue to monitor the stock closely for any technical SELL SIGNALS.

The focus always remains on price/volume action around key support levels, including the 10 DMA, 50 DMA, and any nearby trendline or ROUND-$ support.

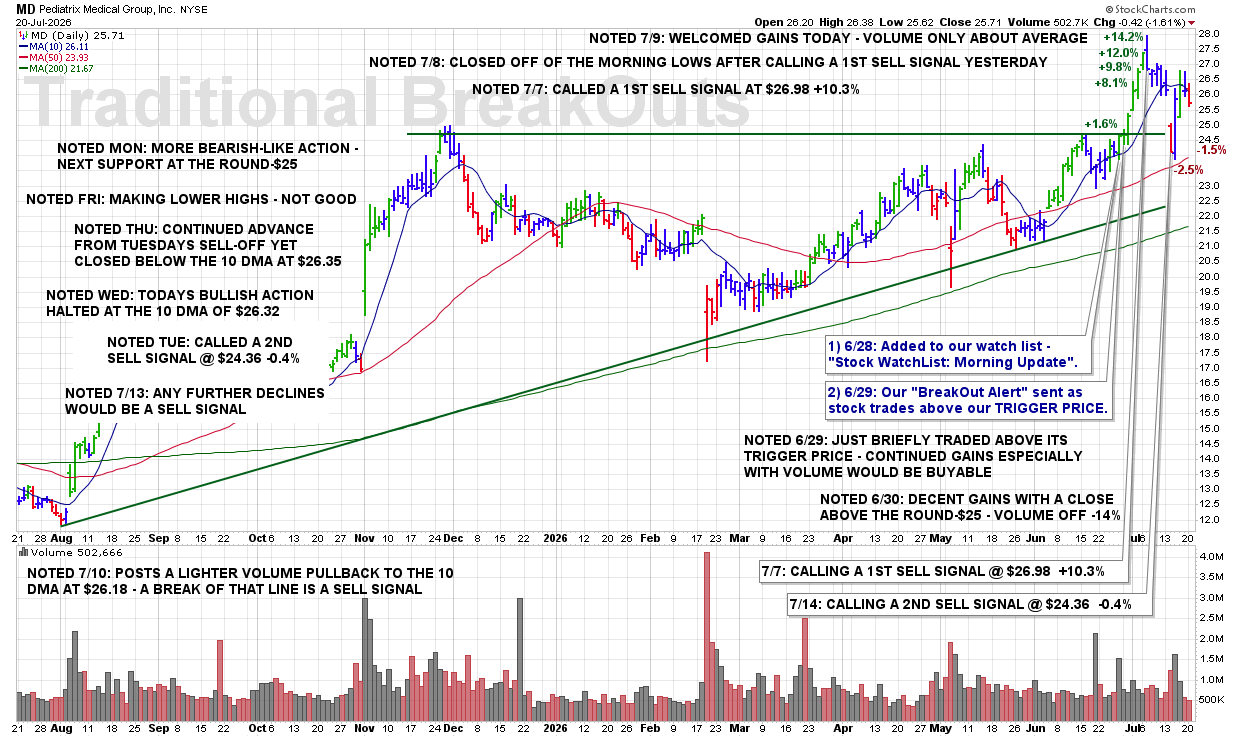
MON 7/20: MD – More Bearish-Like Action – Next Support at the Round-$25

8:15 PM – Here is our latest chart update for this recent breakout from our Traditional BreakOuts Watch List.

CLICK/TAP CHART TO ZOOM
Chart services courtesy of stockcharts.com. Annotations by James Taulman.

We are currently reporting on this stock as an active holding and continue to monitor the stock closely for any technical SELL SIGNALS.

The focus always remains on price/volume action around key support levels, including the 10 DMA, 50 DMA, and any nearby trendline or ROUND-$ support.

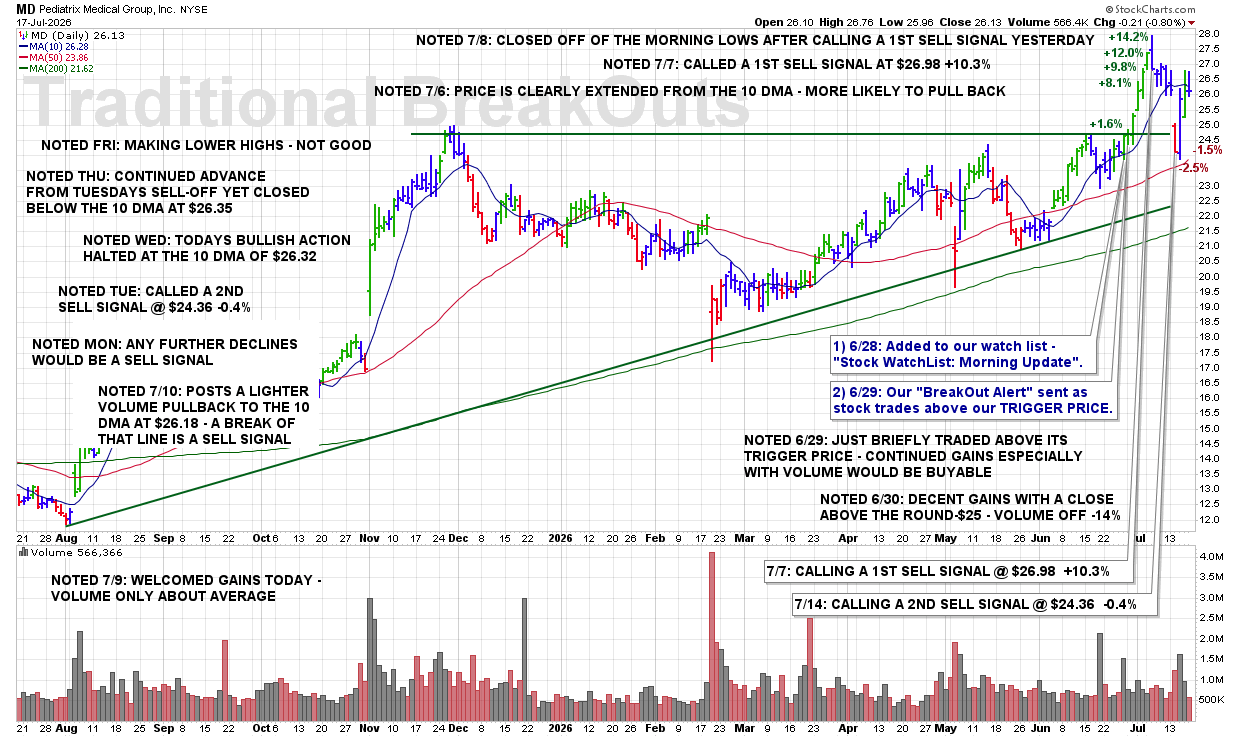
FRI 7/17: MD – Making Lower Highs – Not Good

9:15 PM – Here is our latest chart update for this recent breakout from our Traditional BreakOuts Watch List.

CLICK/TAP CHART TO ZOOM
Chart services courtesy of stockcharts.com. Annotations by James Taulman.

We are currently reporting on this stock as an active holding and continue to monitor the stock closely for any technical SELL SIGNALS.

The focus always remains on price/volume action around key support levels, including the 10 DMA, 50 DMA, and any nearby trendline or ROUND-$ support.

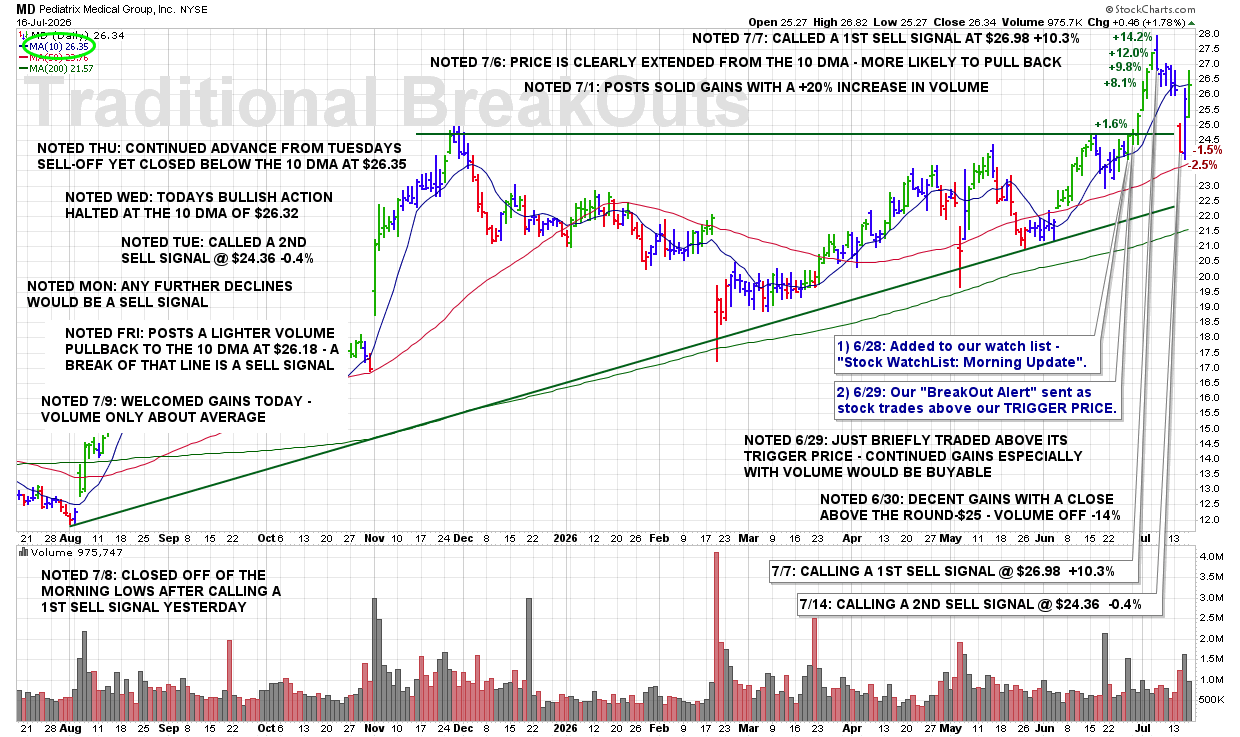
THU 7/16: MD – Continued Advance From Tuesdays Sell-Off Yet Closed Below the 10 DMA at $26.35

11:15 PM – Here is our latest chart update for this recent breakout from our Traditional BreakOuts Watch List.

CLICK/TAP CHART TO ZOOM
Chart services courtesy of stockcharts.com. Annotations by James Taulman.

We are currently reporting on this stock as an active holding and continue to monitor the stock closely for any technical SELL SIGNALS.

The focus always remains on price/volume action around key support levels, including the 10 DMA, 50 DMA, and any nearby trendline or ROUND-$ support.

WED 7/15: MD – Todays Bullish Action Halted at the 10 DMA of $26.32

8:15 PM – Here is our latest chart update for this recent breakout from our Traditional BreakOuts Watch List.

CLICK/TAP CHART TO ZOOM
Chart services courtesy of stockcharts.com. Annotations by James Taulman.

We are currently reporting on this stock as an active holding and continue to monitor the stock closely for any technical SELL SIGNALS.

The focus always remains on price/volume action around key support levels, including the 10 DMA, 50 DMA, and any nearby trendline or ROUND-$ support.

TUE 7/14: MD – Called a 2nd Sell Signal @ $24.36 -0.4%

9:15 PM – Here is our latest chart update for this recent breakout from our Traditional BreakOuts Watch List.

CLICK/TAP CHART TO ZOOM
Chart services courtesy of stockcharts.com. Annotations by James Taulman.

We are currently reporting on this stock as an active holding and continue to monitor the stock closely for any technical SELL SIGNALS.

The focus always remains on price/volume action around key support levels, including the 10 DMA, 50 DMA, and any nearby trendline or ROUND-$ support.

TUE 7/14: MD – CALLING A 2ND SELL SIGNAL @ $24.36 -0.4%

3:35 PM – Calling a 2ND SELL SIGNAL this afternoon as shares gapped down this morning, failed to recover, and appear set to close near the session lows. That inability to rebound reinforces the stock’s ongoing technical weakness.

ULTRA Trader’s Tip: Weak Closes Deserve Attention

  • A stock closing near its session lows shows that sellers remained in control throughout the day.

  • Failure to recover after a gap down often confirms that buying support is weakening.

  • Respect persistent weakness when a stock cannot regain lost ground.

CLICK/TAP CHART TO ZOOM
Chart services courtesy of stockcharts.com. Annotations by James Taulman.

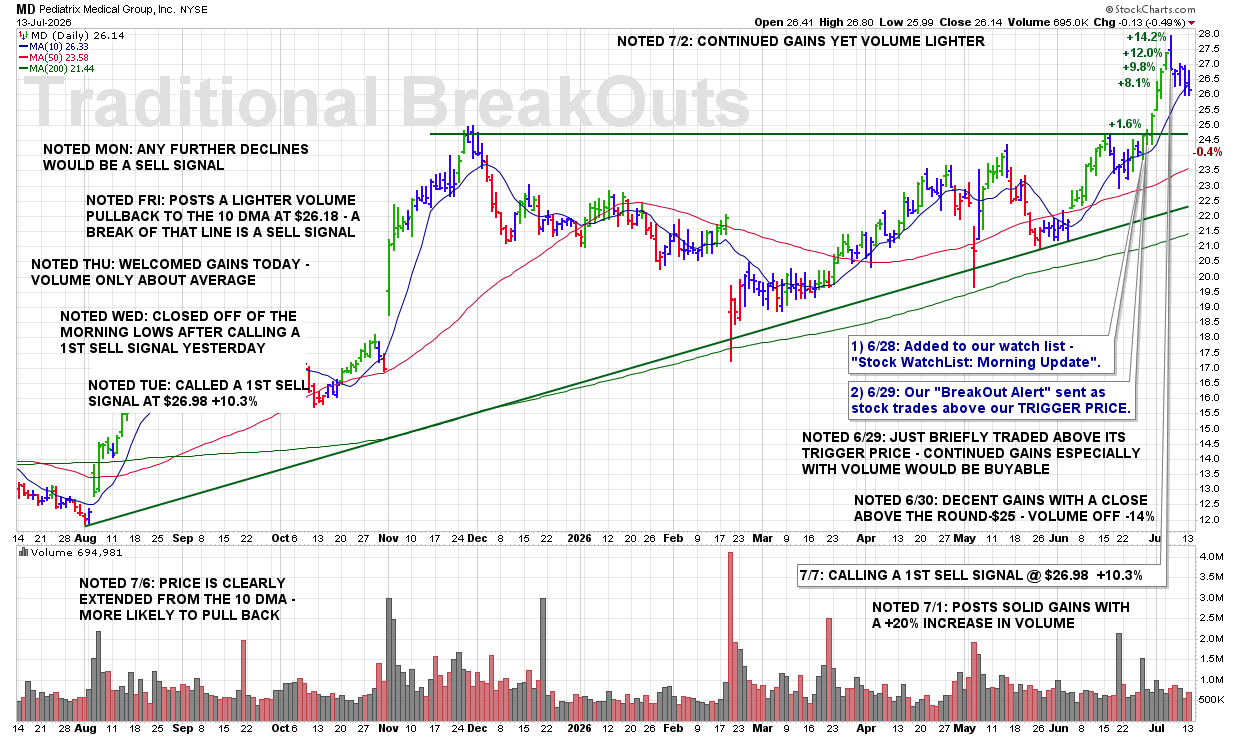
MON 7/13: MD – Any Further Declines Would Be a Sell Signal

9:15 PM – Here is our latest chart update for this recent breakout from our Traditional BreakOuts Watch List.

CLICK/TAP CHART TO ZOOM
Chart services courtesy of stockcharts.com. Annotations by James Taulman.

We are currently reporting on this stock as an active holding and continue to monitor the stock closely for any technical SELL SIGNALS.

The focus always remains on price/volume action around key support levels, including the 10 DMA, 50 DMA, and any nearby trendline or ROUND-$ support.

FRI 7/10: MD – Posts a Lighter Volume Pullback to the 10 DMA at $26.18 – a Break of That Line Is a Sell Signal

8:15 PM – Here is our latest chart update for this recent breakout from our Traditional BreakOuts Watch List.

CLICK/TAP CHART TO ZOOM
Chart services courtesy of stockcharts.com. Annotations by James Taulman.

We are currently reporting on this stock as an active holding and continue to monitor the stock closely for any technical SELL SIGNALS.

The focus always remains on price/volume action around key support levels, including the 10 DMA, 50 DMA, and any nearby trendline or ROUND-$ support.

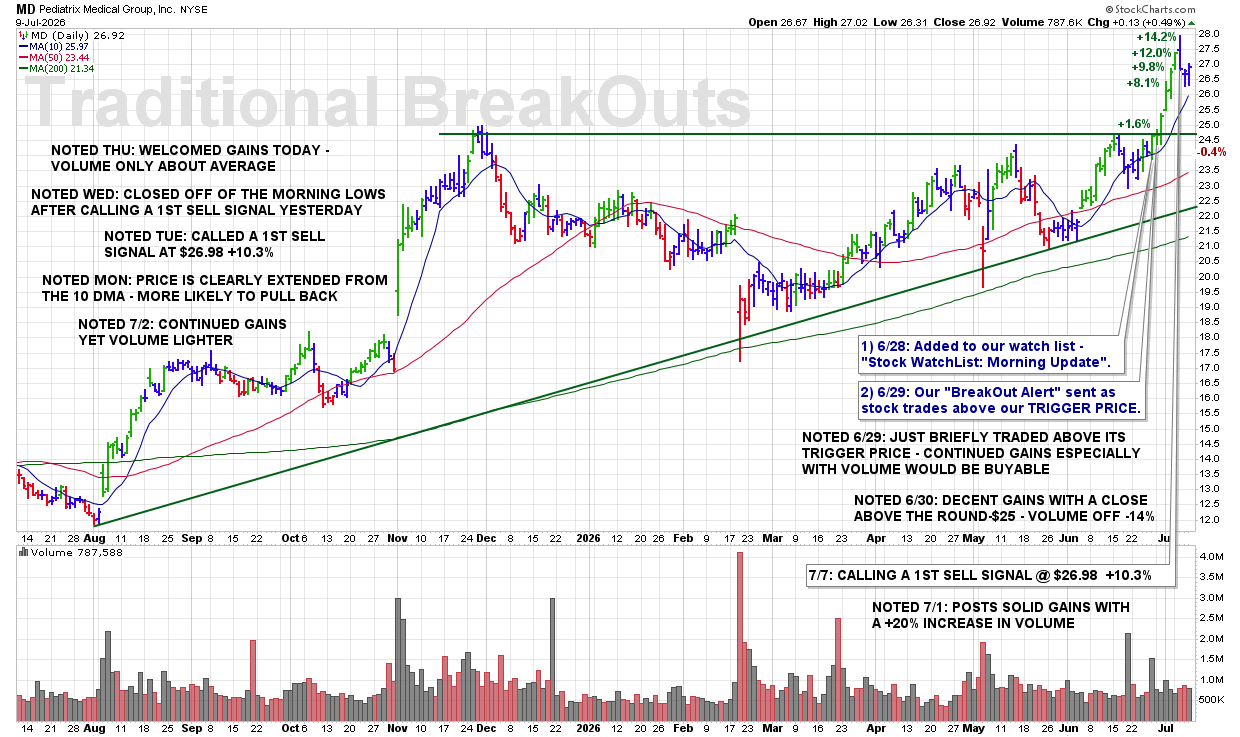
THU 7/9: MD – Welcomed Gains Today – Volume Only About Average

10:15 PM – Here is our latest chart update for this recent breakout from our Traditional BreakOuts Watch List.

CLICK/TAP CHART TO ZOOM
Chart services courtesy of stockcharts.com. Annotations by James Taulman.

We are currently reporting on this stock as an active holding and continue to monitor the stock closely for any technical SELL SIGNALS.

The focus always remains on price/volume action around key support levels, including the 10 DMA, 50 DMA, and any nearby trendline or ROUND-$ support.

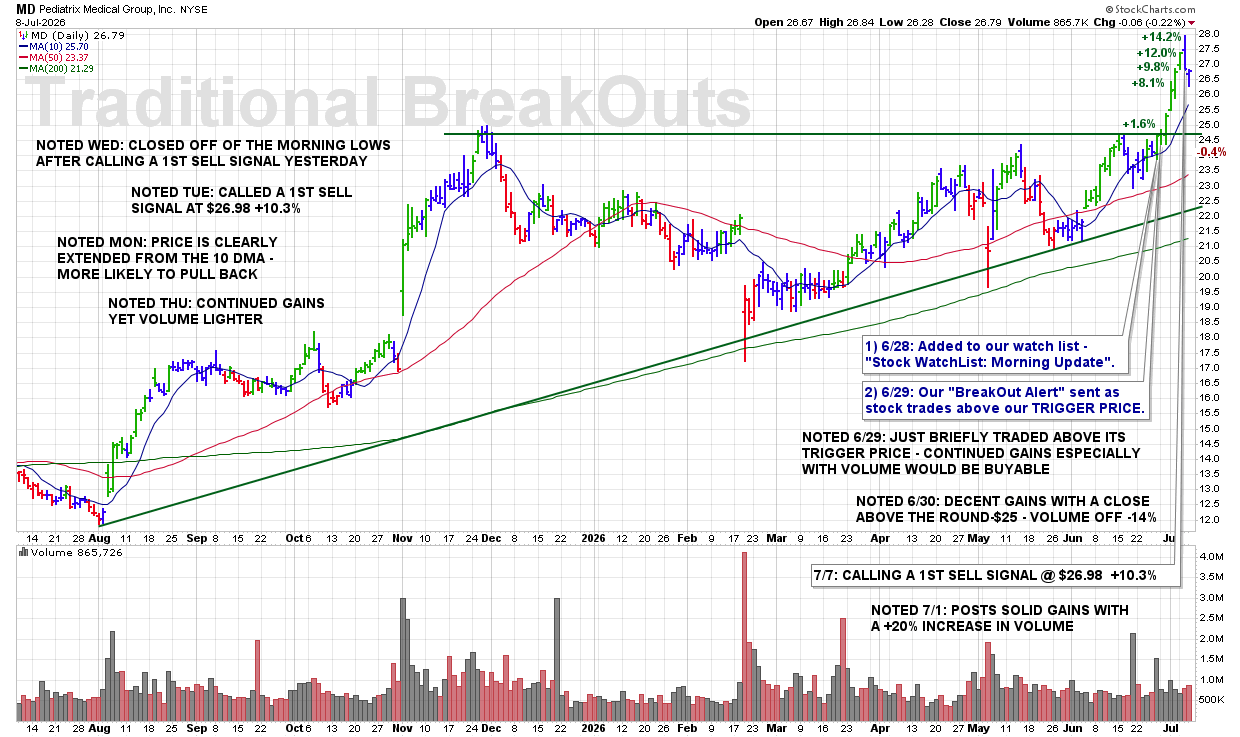
WED 7/8: MD – Closed Off of the Morning Lows After Calling a 1st Sell Signal Yesterday

9:30 PM – Here is our latest chart update for this recent breakout from our Traditional BreakOuts Watch List.

CLICK/TAP CHART TO ZOOM
Chart services courtesy of stockcharts.com. Annotations by James Taulman.

We are currently reporting on this stock as an active holding and continue to monitor the stock closely for any technical SELL SIGNALS.

The focus always remains on price/volume action around key support levels, including the 10 DMA, 50 DMA, and any nearby trendline or ROUND-$ support.

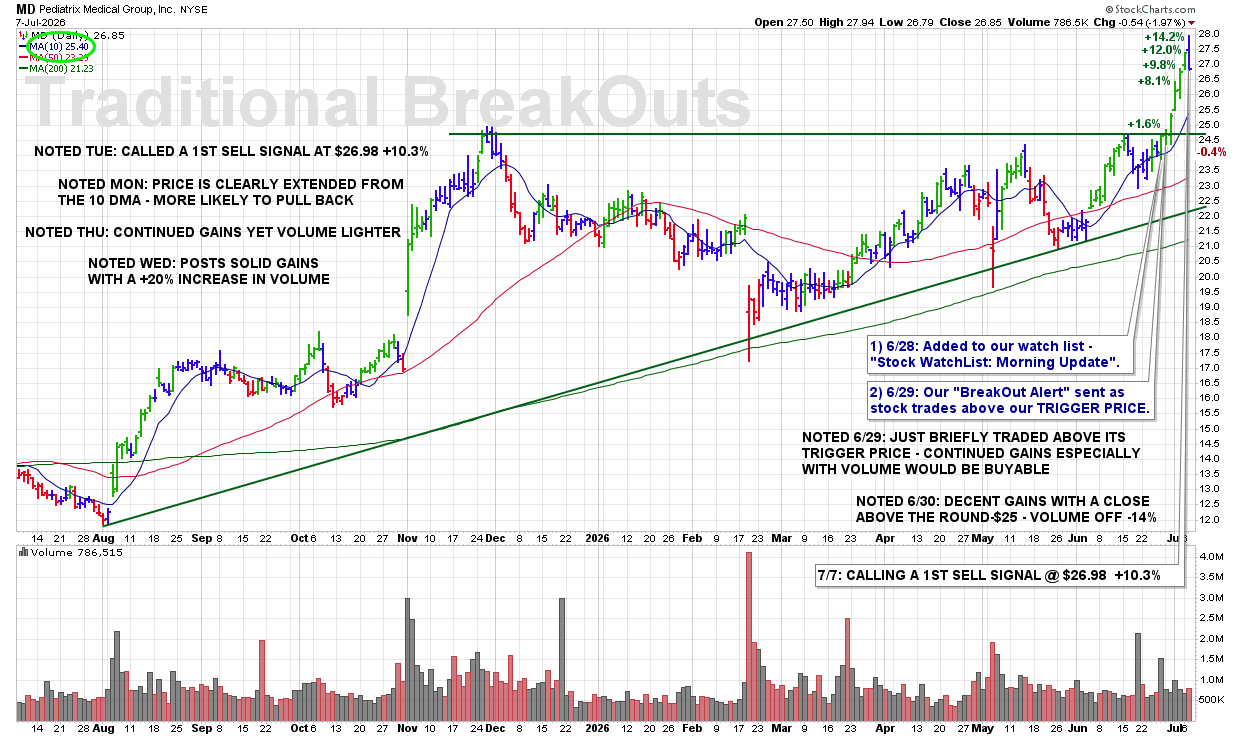
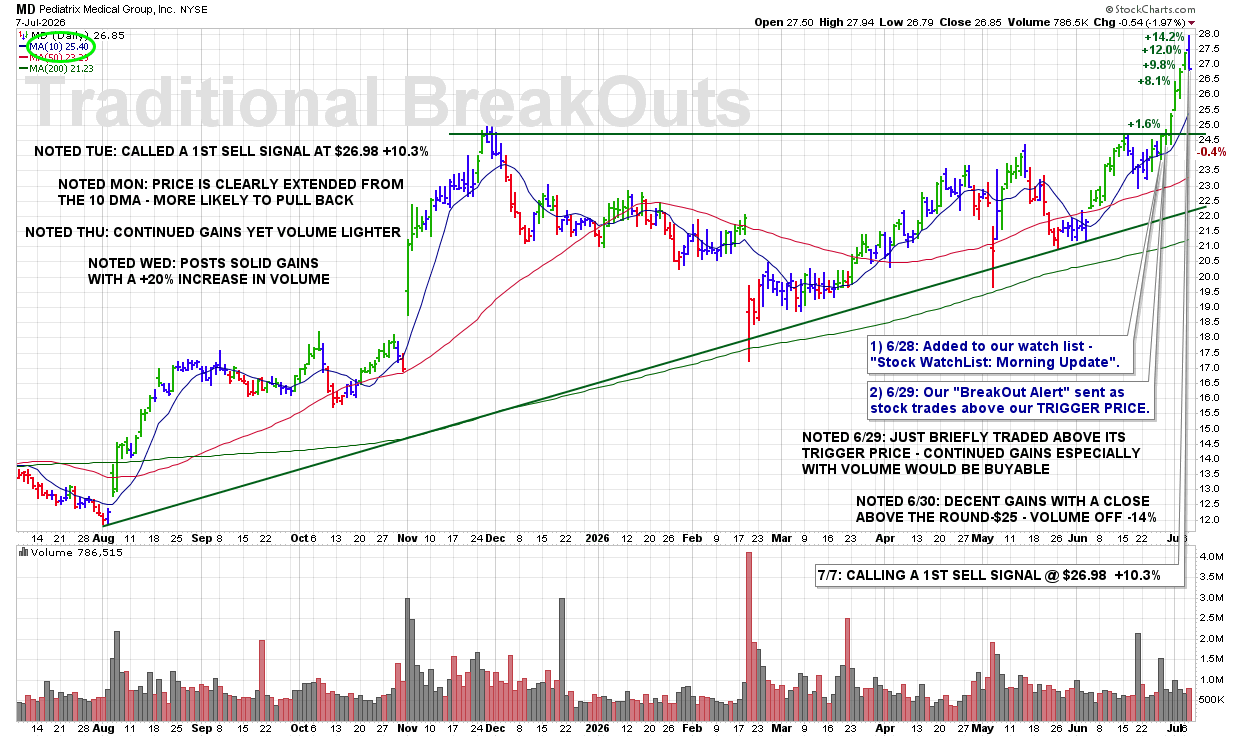
TUE 7/7: MD – Called a 1st Sell Signal @ $26.98 +10.3%

10:30 PM – Here is our latest chart update for this recent breakout from our Traditional BreakOuts Watch List.

CLICK/TAP CHART TO ZOOM
Chart services courtesy of stockcharts.com. Annotations by James Taulman.

We are currently reporting on this stock as an active holding and continue to monitor the stock closely for any technical SELL SIGNALS.

The focus always remains on price/volume action around key support levels, including the 10 DMA, 50 DMA, and any nearby trendline or ROUND-$ support.

TUE 7/7: MD – CALLING A 1ST PROFIT-TAKING SELL SIGNAL @ $26.98 +10.3%

10:05 AM – The stock is trading lower this morning after recently being noted as EXTENDED, meaning it was trading +7% or more above its 10 DMA. This condition becomes more concerning when the advance is not supported by above-average volume. Today’s weakness provides a good opportunity to take some profits and reduce exposure.

ULTRA Trader’s Tip: Extension Raises Pullback Risk

  • Stocks trading too far above their 10 DMA often need time to consolidate or pull back.

  • Light-volume advances carry less conviction and can leave gains vulnerable.

  • Taking partial profits into extended strength protects gains while preserving continued upside

CLICK/TAP CHART TO ZOOM
Chart services courtesy of stockcharts.com. Annotations by James Taulman.

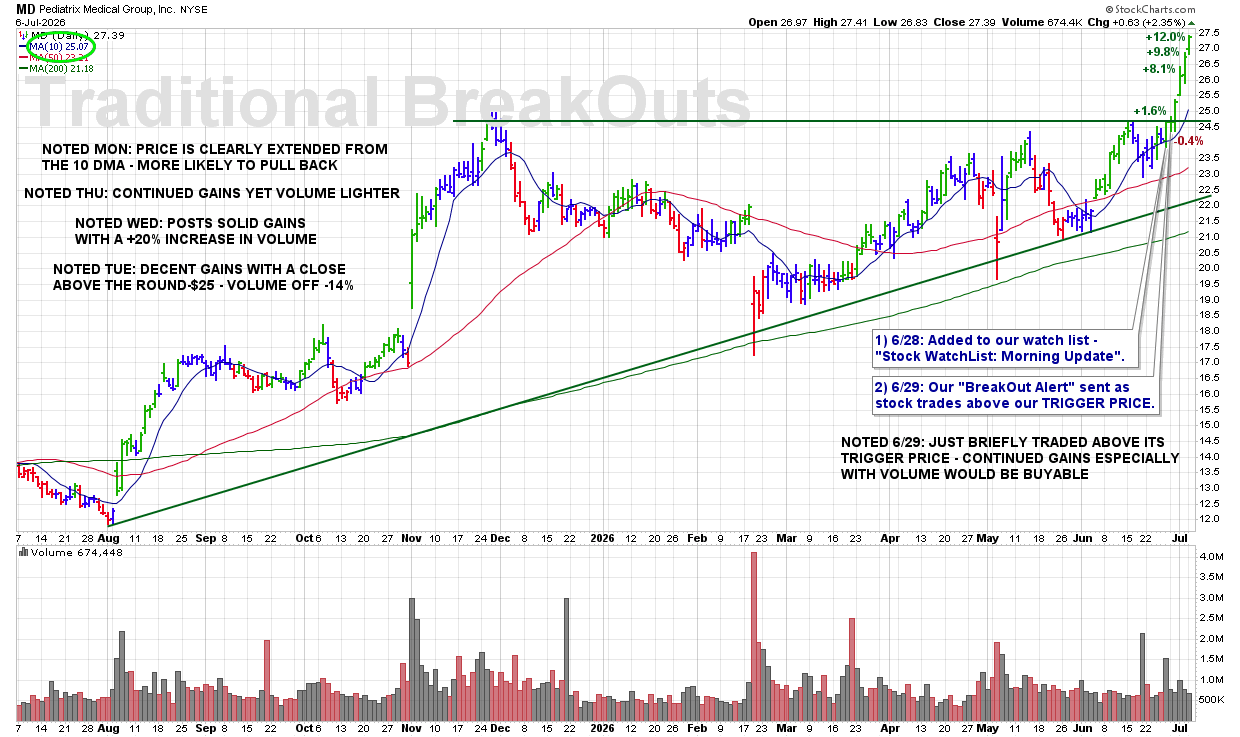
MON 7/6: MD – Price Is Clearly Extended From the 10 DMA – More Likely to Pull Back

8:30 PM – Here is our latest chart update for this recent breakout from our Traditional BreakOuts Watch List.

CLICK/TAP CHART TO ZOOM
Chart services courtesy of stockcharts.com. Annotations by James Taulman.

We are currently reporting on this stock as an active holding and continue to monitor the stock closely for any technical SELL SIGNALS.

The focus always remains on price/volume action around key support levels, including the 10 DMA, 50 DMA, and any nearby trendline or ROUND-$ support.

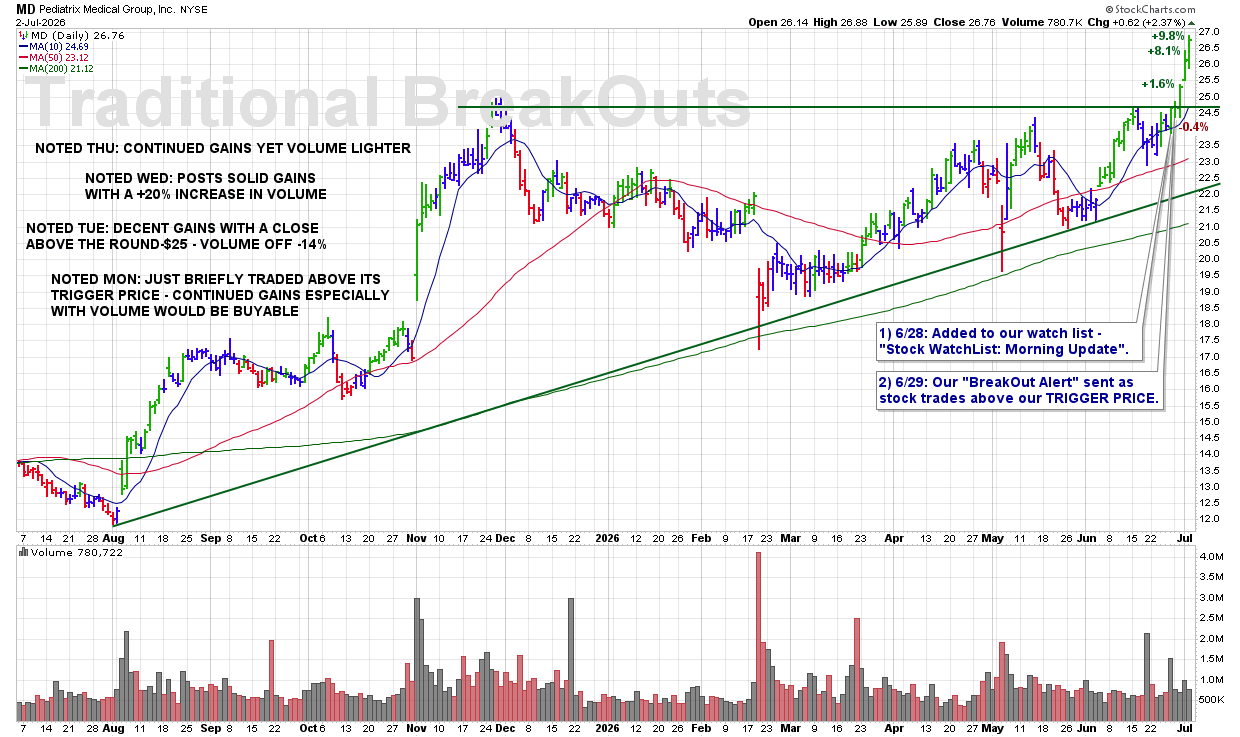
THU 7/2: MD – Continued Gains Yet Volume Lighter

9:30 PM – Here is our latest chart update for this recent breakout from our Traditional BreakOuts Watch List.

CLICK/TAP CHART TO ZOOM
Chart services courtesy of stockcharts.com. Annotations by James Taulman.

We are currently reporting on this stock as an active holding and continue to monitor the stock closely for any technical SELL SIGNALS.

The focus always remains on price/volume action around key support levels, including the 10 DMA, 50 DMA, and any nearby trendline or ROUND-$ support.

WED 7/1: MD – Posts Solid Gains With a +20% Increase in Volume

11:30 PM – Here is our latest chart update for this recent breakout from our Traditional BreakOuts Watch List.

CLICK/TAP CHART TO ZOOM
Chart services courtesy of stockcharts.com. Annotations by James Taulman.

We are currently reporting on this stock as an active holding and continue to monitor the stock closely for any technical SELL SIGNALS.

The focus always remains on price/volume action around key support levels, including the 10 DMA, 50 DMA, and any nearby trendline or ROUND-$ support.

TUE 6/30: MD – Decent Gains With a Close Above the Round-$25 – Volume Off -14%

10:30 PM – Here is our latest chart update for this recent breakout from our Traditional BreakOuts Watch List.

CLICK/TAP CHART TO ZOOM
Chart services courtesy of stockcharts.com. Annotations by James Taulman.

We are currently reporting on this stock as an active holding and continue to monitor the stock closely for any technical SELL SIGNALS.

The focus always remains on price/volume action around key support levels, including the 10 DMA, 50 DMA, and any nearby trendline or ROUND-$ support.

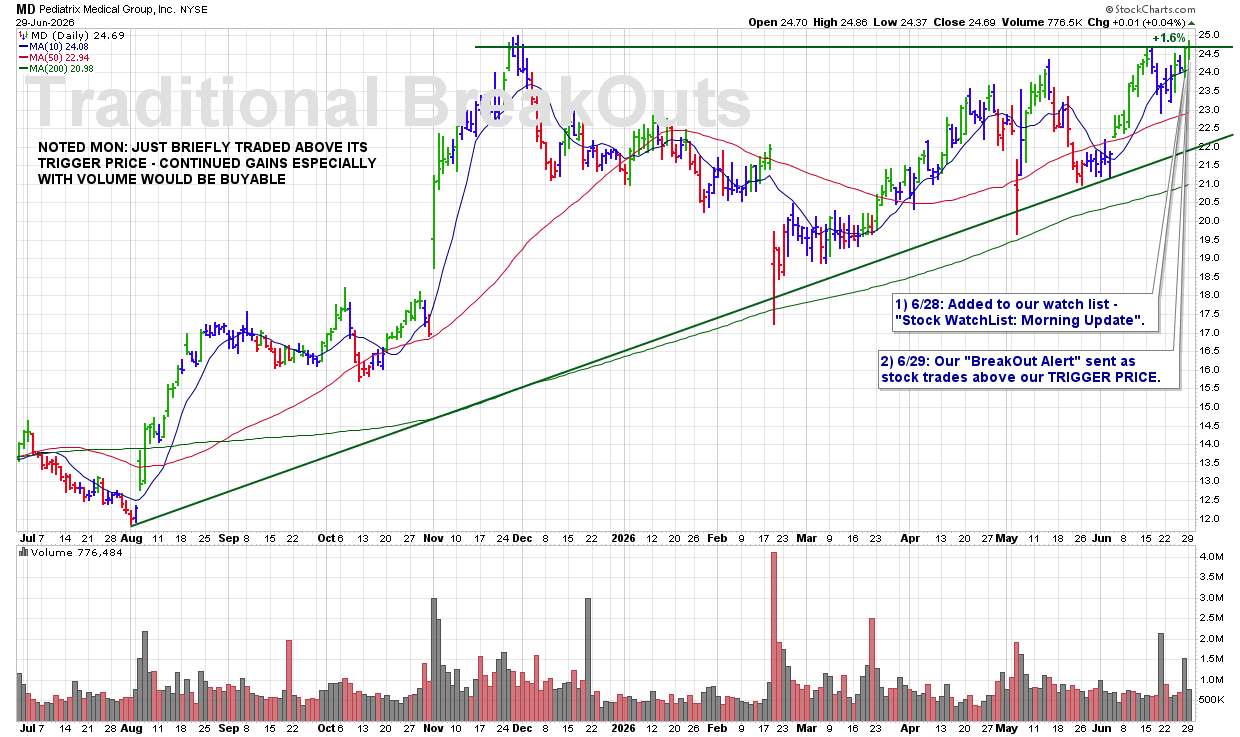
MON 6/29: MD – Just Briefly Traded Above Its Trigger Price – Continued Gains Especially With Volume Would Be Buyable

9:30 PM – Here is our latest chart update for this recent breakout from our Traditional BreakOuts Watch List.

CLICK/TAP CHART TO ZOOM
Chart services courtesy of stockcharts.com. Annotations by James Taulman.

We are currently reporting on this stock as an active holding and continue to monitor the stock closely for any technical SELL SIGNALS.

The focus always remains on price/volume action around key support levels, including the 10 DMA, 50 DMA, and any nearby trendline or ROUND-$ support.

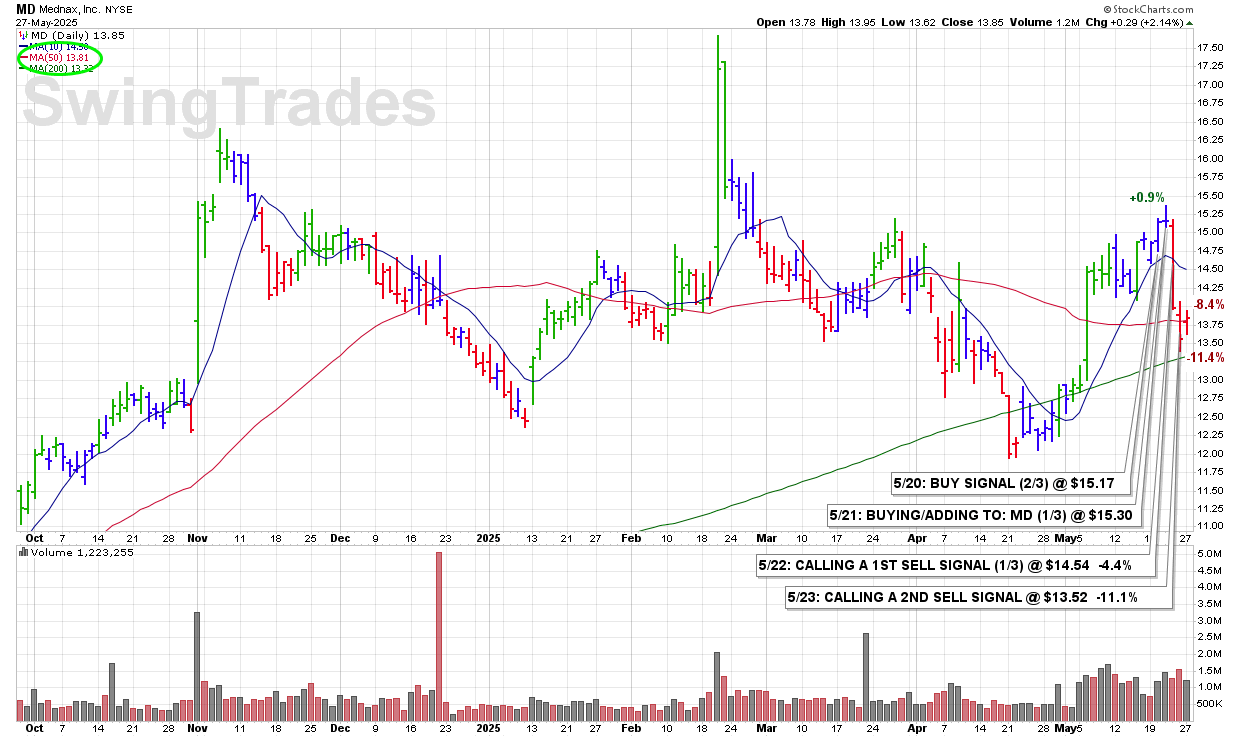
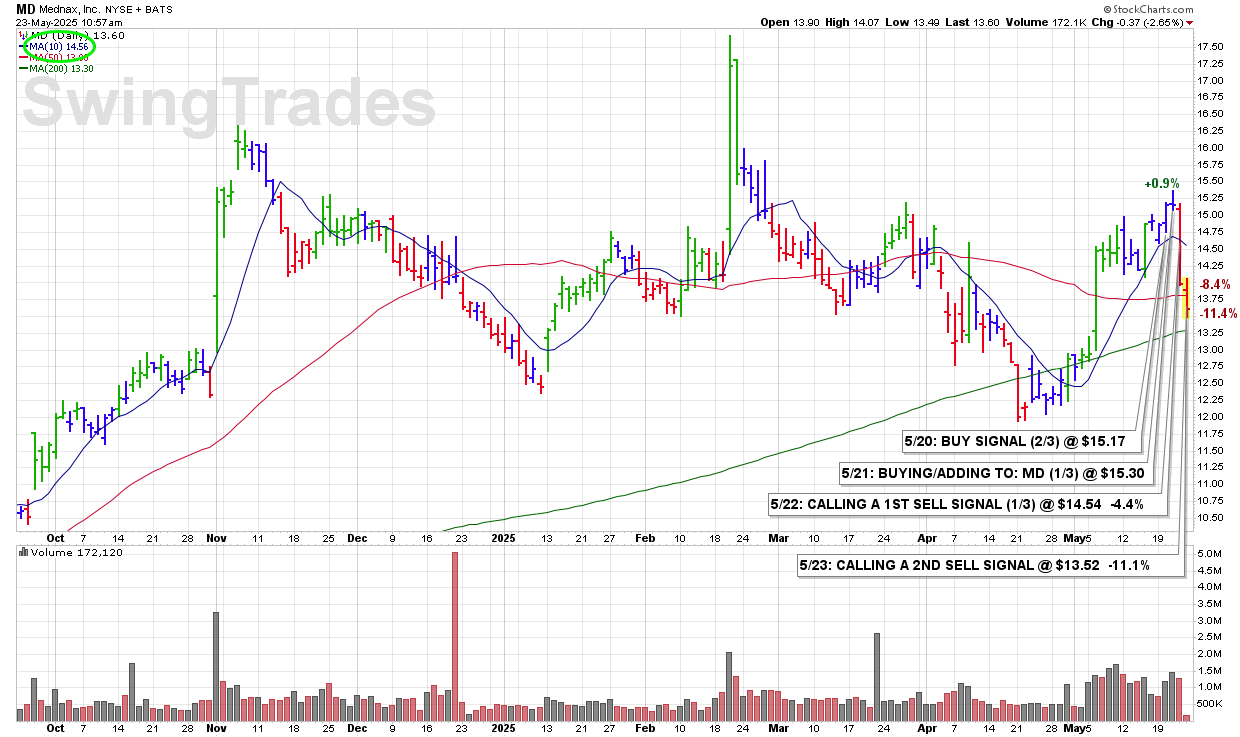
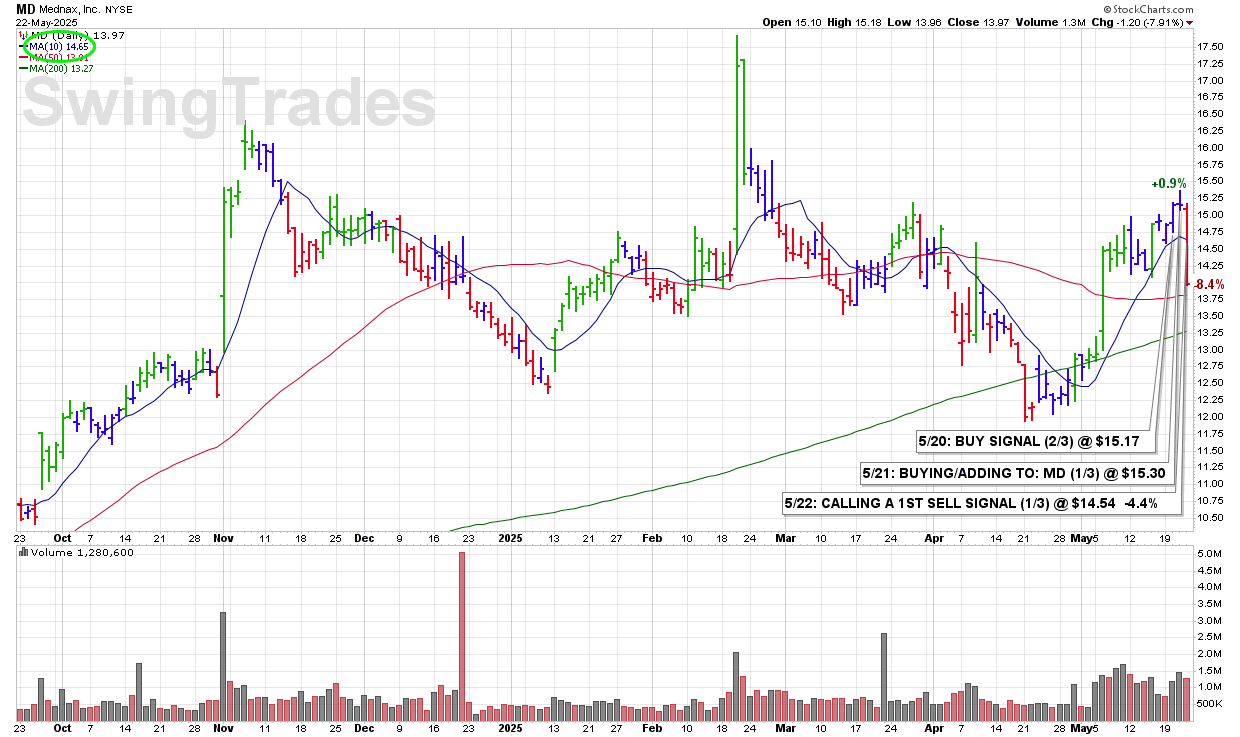
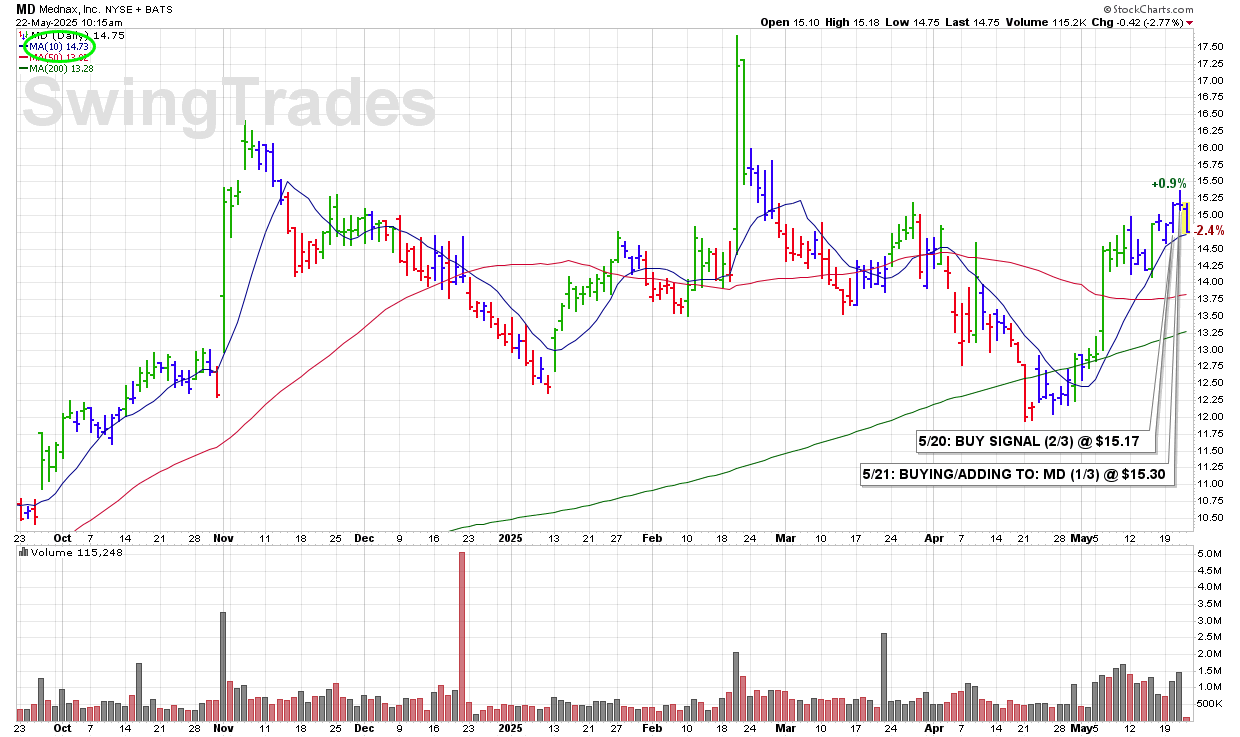
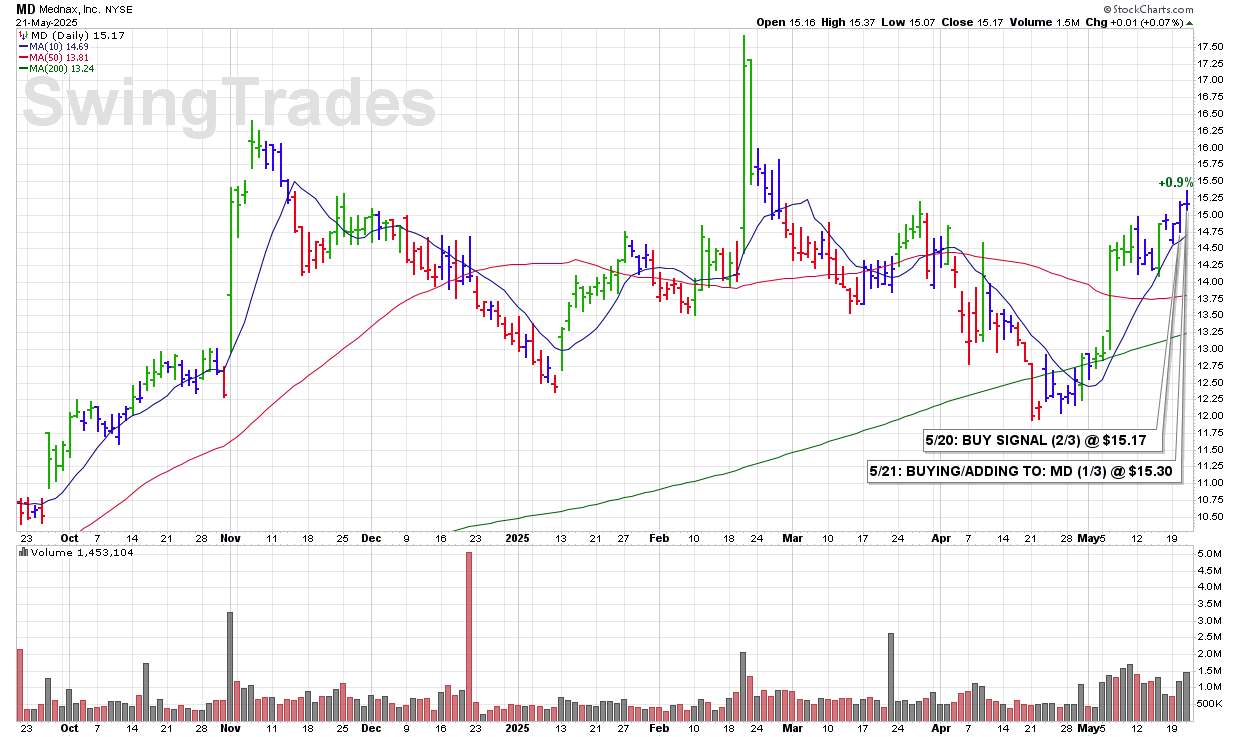
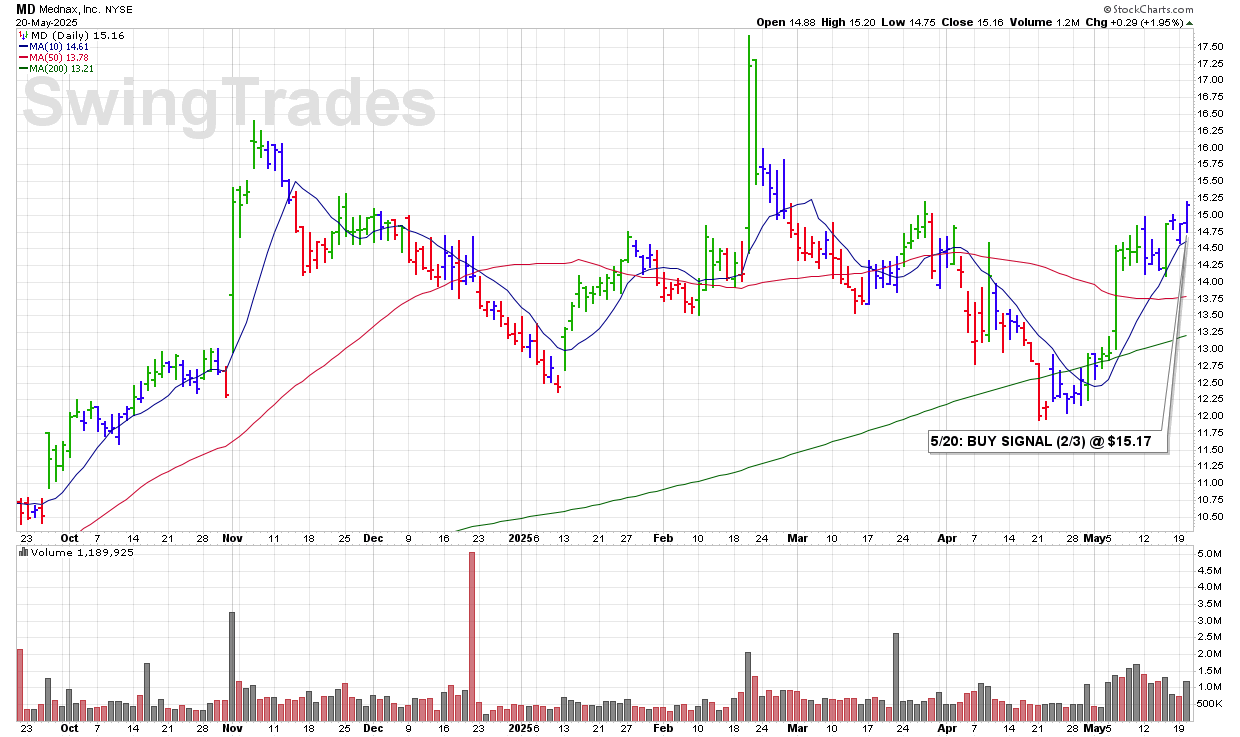
WED 5/28: MD – A Break of the 200 DMA ($13.34) Would be the Final Sell Signal

9:49 AM – MD has been weak lately, and it’s now testing critical long-term support at the 200 DMA — currently sitting at $13.34.

A clean break below this level would trigger a FINAL SELL SIGNAL under our system rules, signaling a full exit from the trade. For now, we’re watching closely — but any close beneath that 200-day line would likely force our hand.

CLICK/TAP CHART TO ZOOM
Chart services courtesy of stockcharts.com. Annotations by James Taulman.