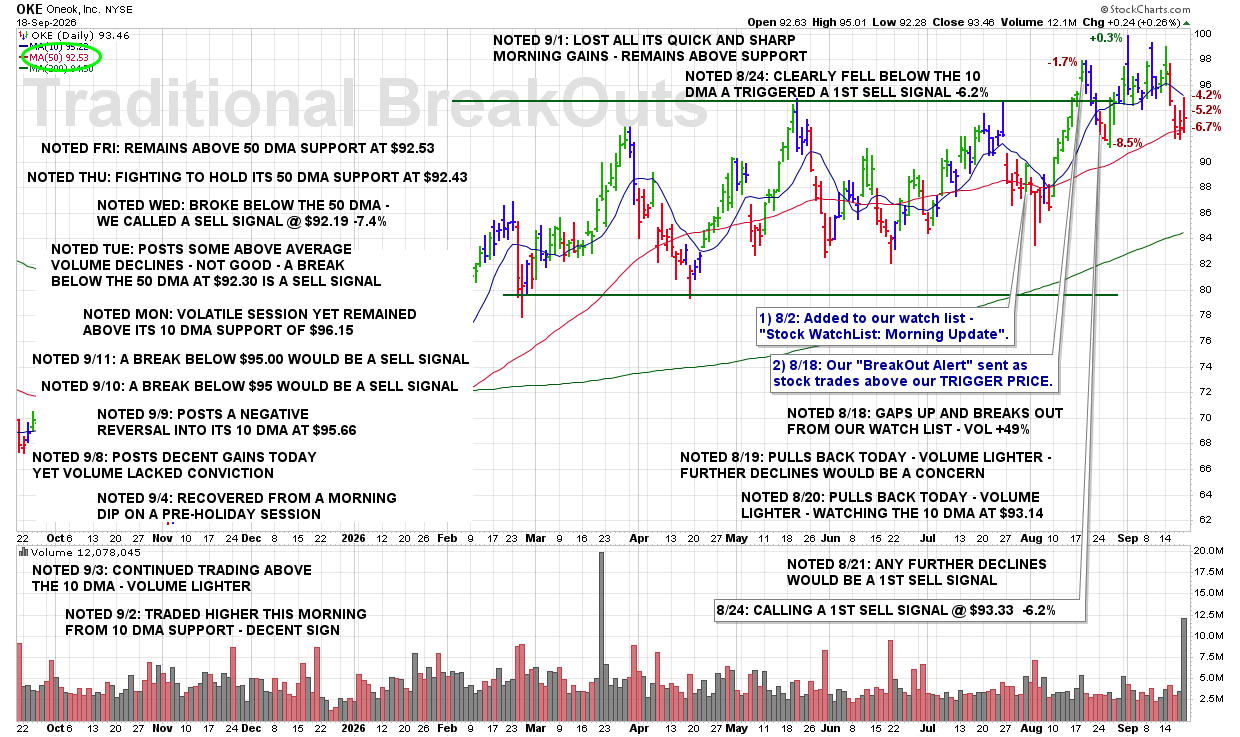
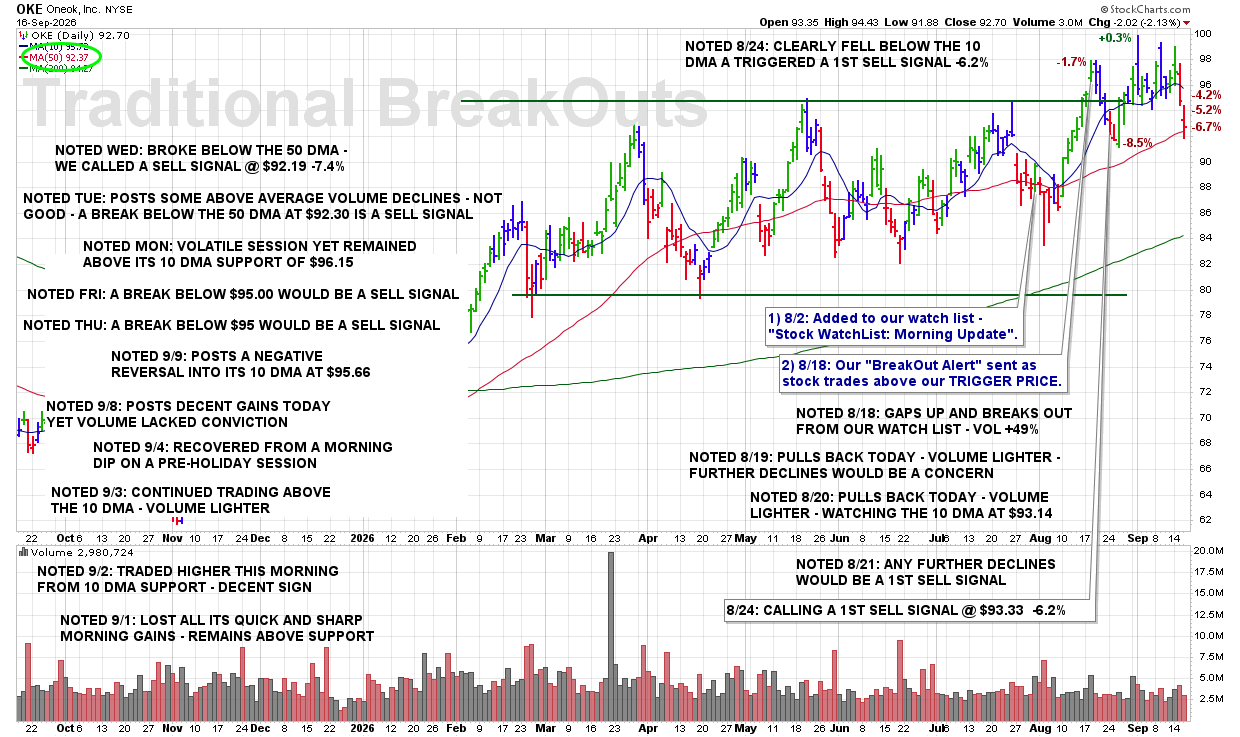
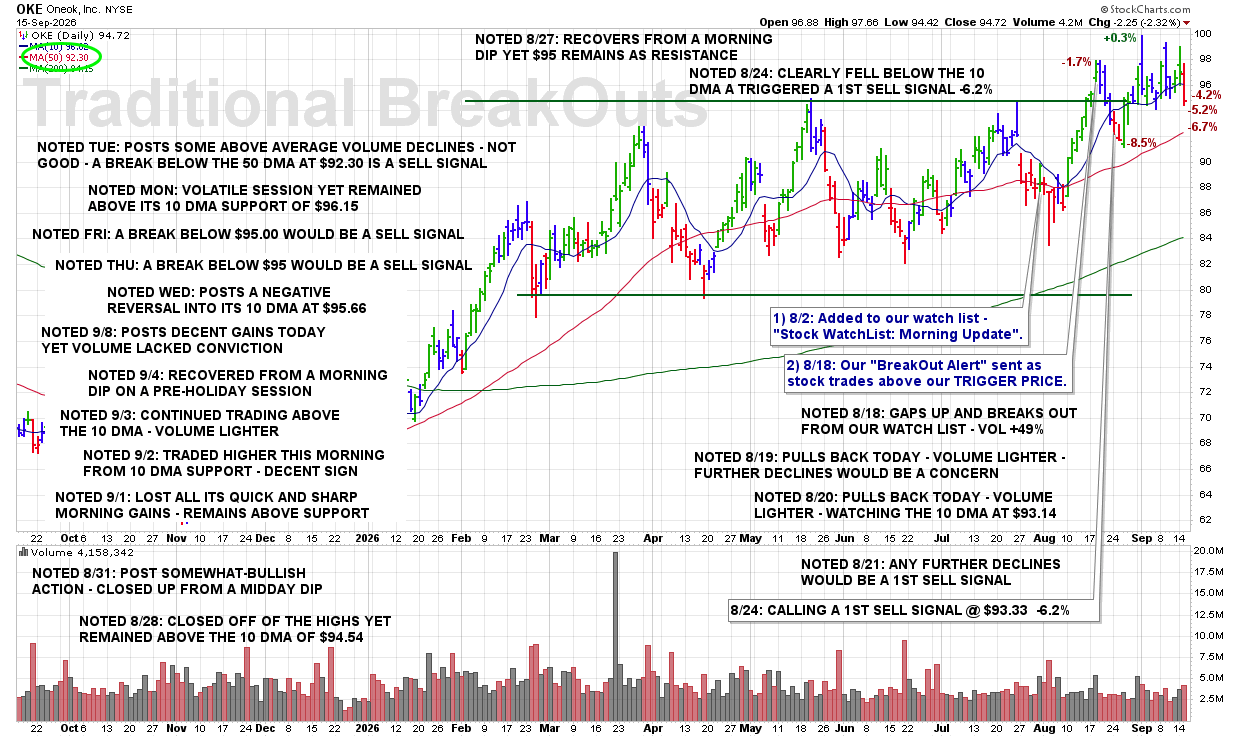
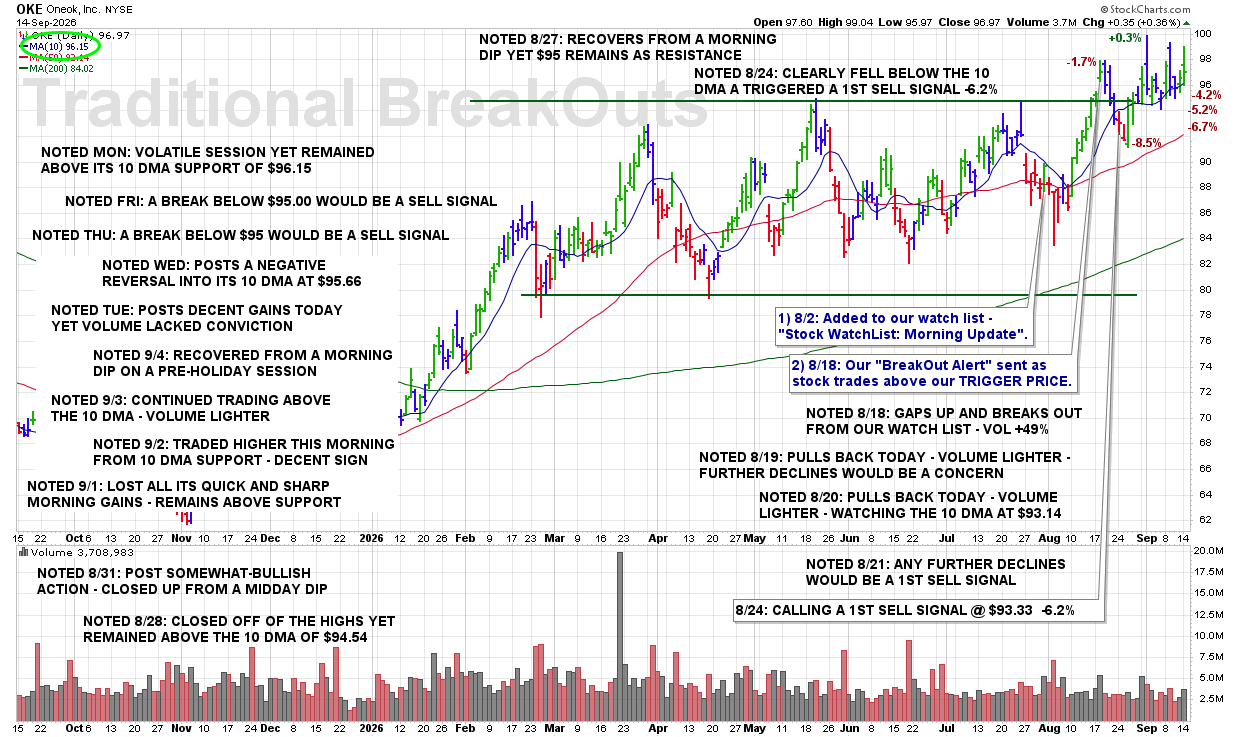
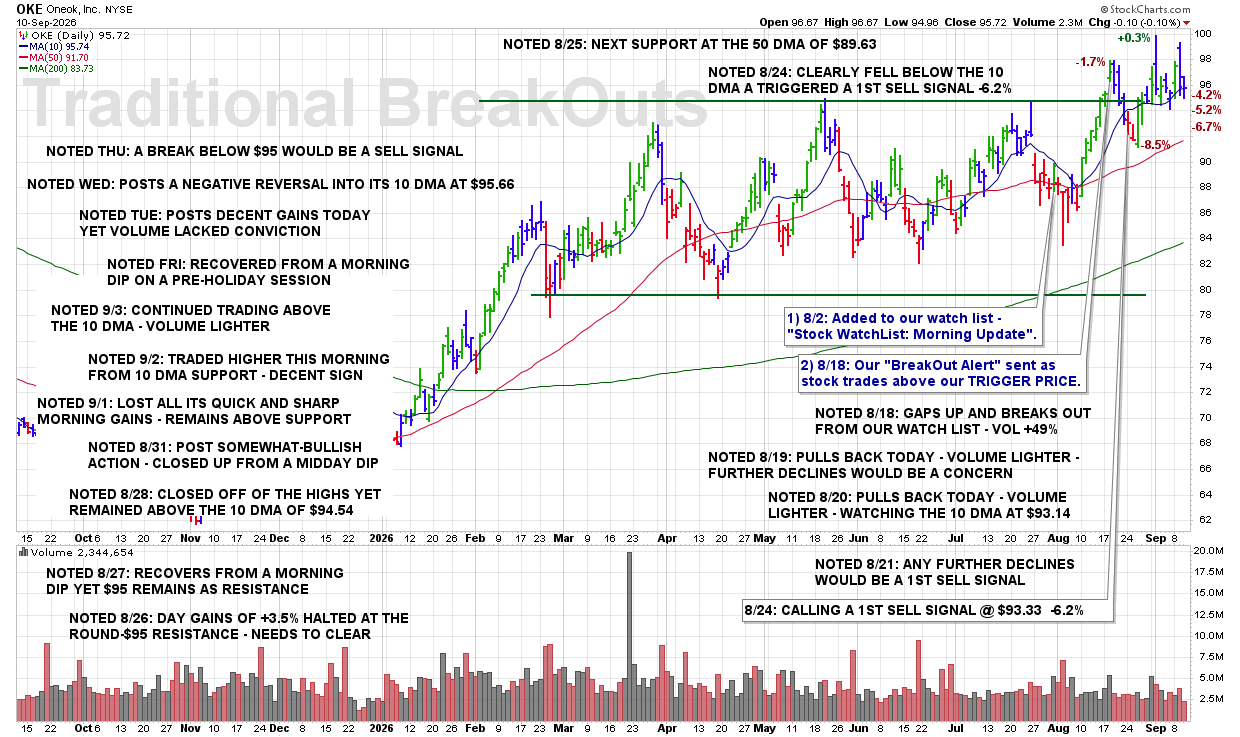
FRI 9/18 – OKE – Remains Above 50 DMA Support at $92.53

8:10 PM – Here is our latest chart update for this recent breakout from our Traditional BreakOuts Watch List.
CLICK/TAP CHART TO ZOOM
Chart services courtesy of stockcharts.com. Annotations by James Taulman.

We are currently reporting on this stock as an active holding and continue to monitor the stock closely for any technical SELL SIGNALS.

The focus always remains on price/volume action around key support levels, including the 10 DMA, 50 DMA, and any nearby trendline or ROUND-$ support.

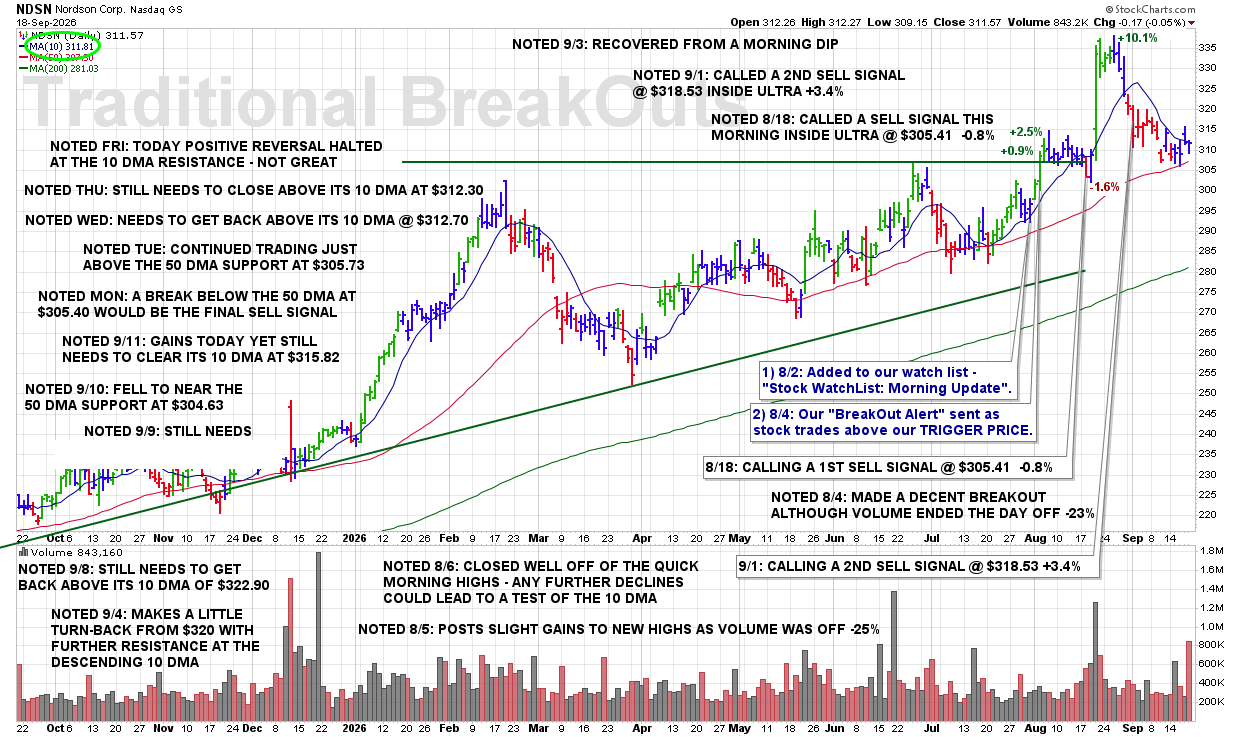
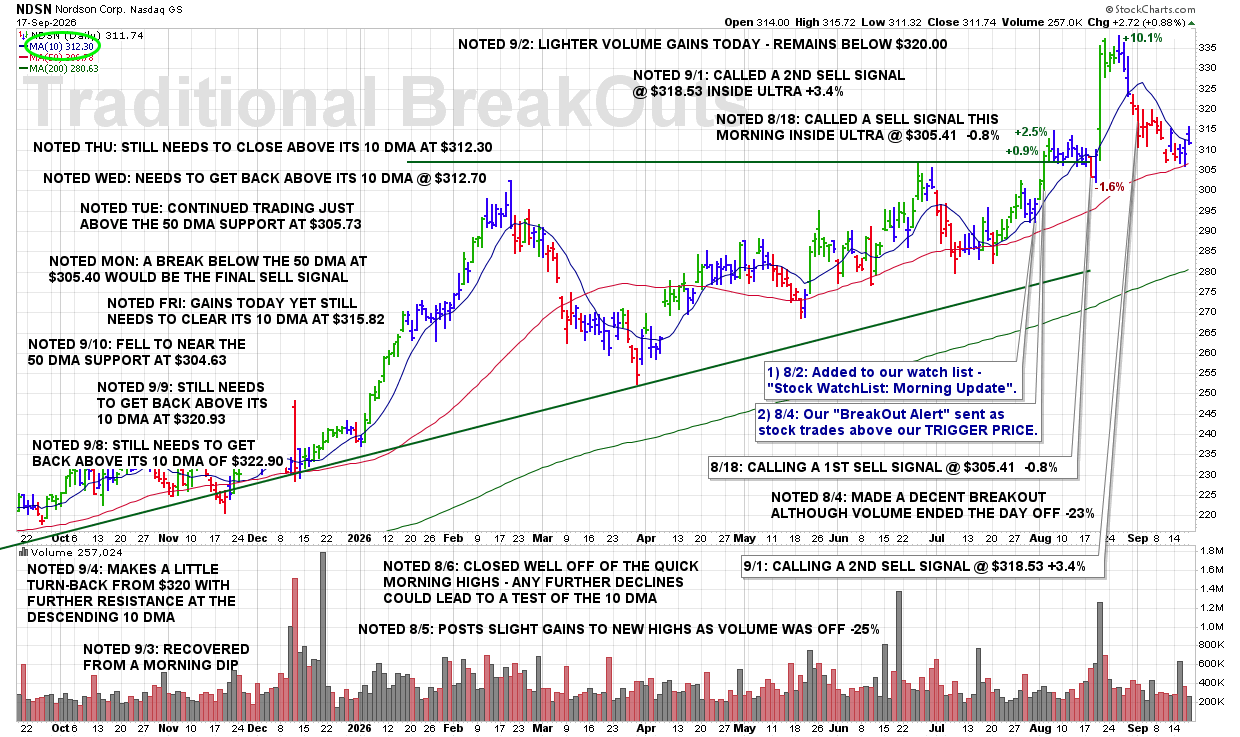
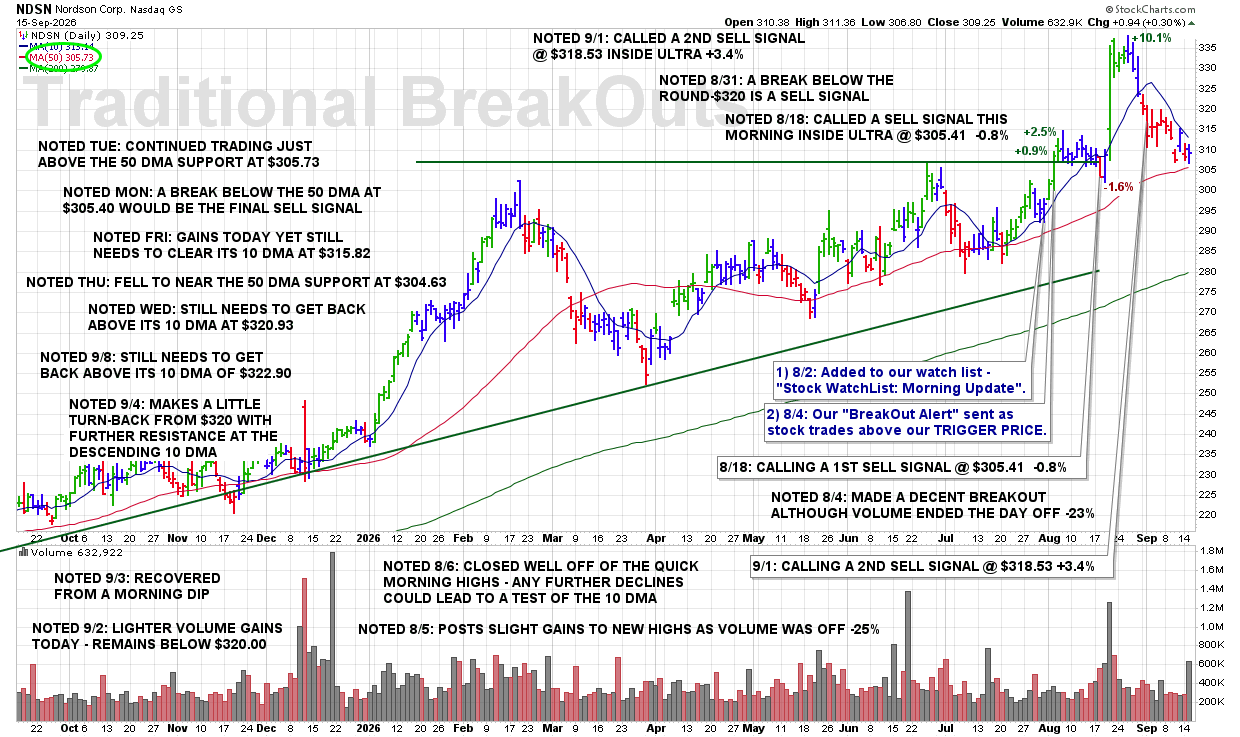
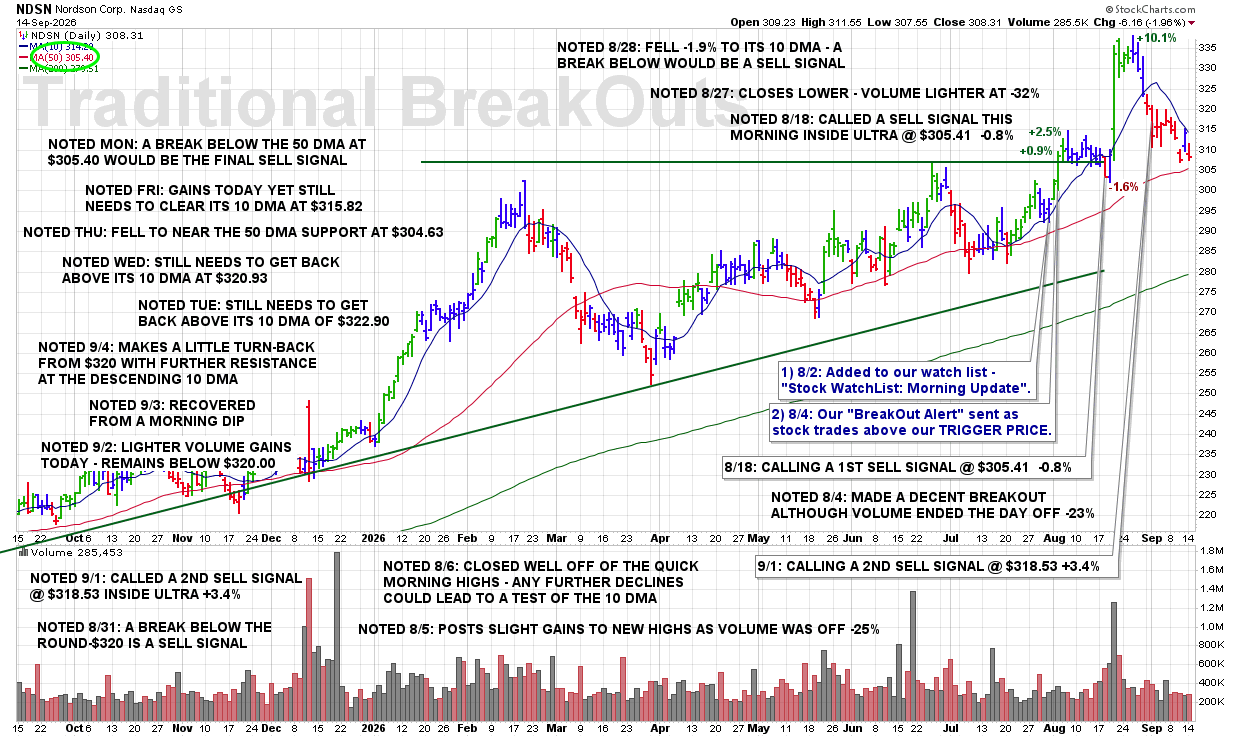
FRI 9/18 – NDSN – Today Positive Reversal Halted at the 10 DMA Resistance – Not Great

8:05 PM – Here is our latest chart update for this recent breakout from our Traditional BreakOuts Watch List

CLICK/TAP CHART TO ZOOM
Chart services courtesy of stockcharts.com. Annotations by James Taulman.

We are currently reporting on this stock as an active holding and continue to monitor the stock closely for any technical SELL SIGNALS.

The focus always remains on price/volume action around key support levels, including the 10 DMA, 50 DMA, and any nearby trendline or ROUND-$ support.

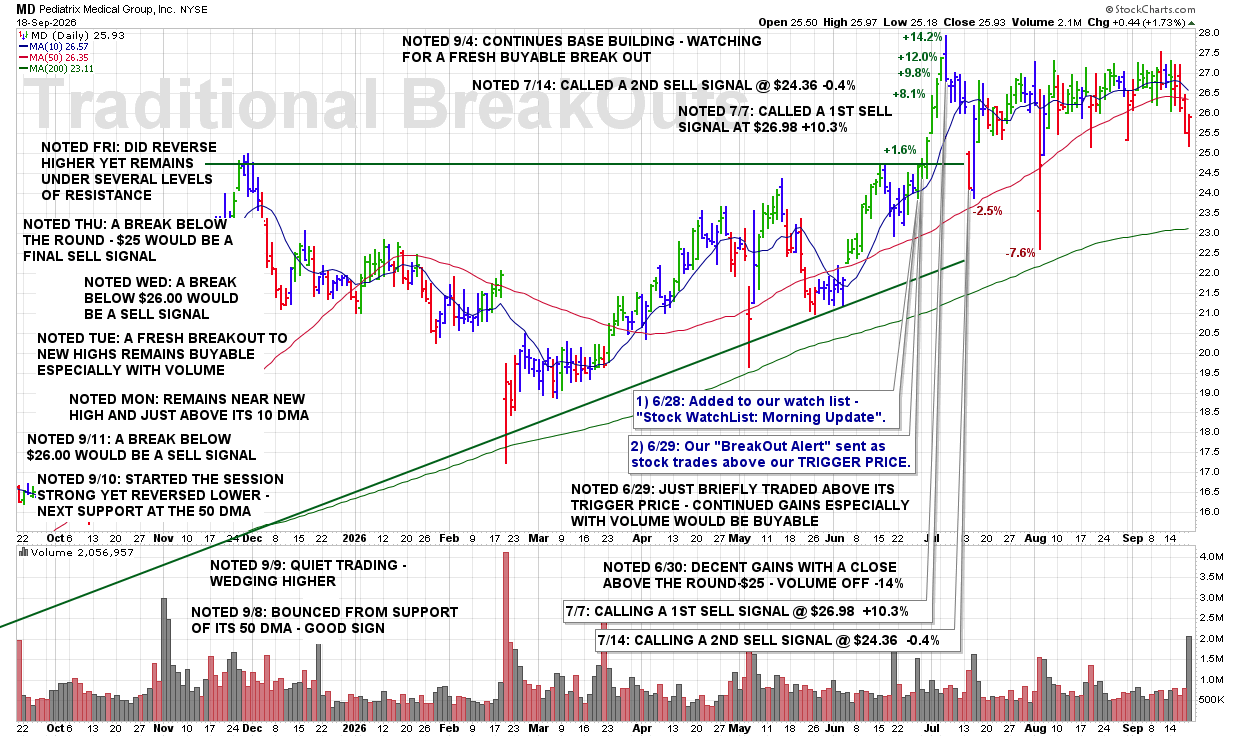
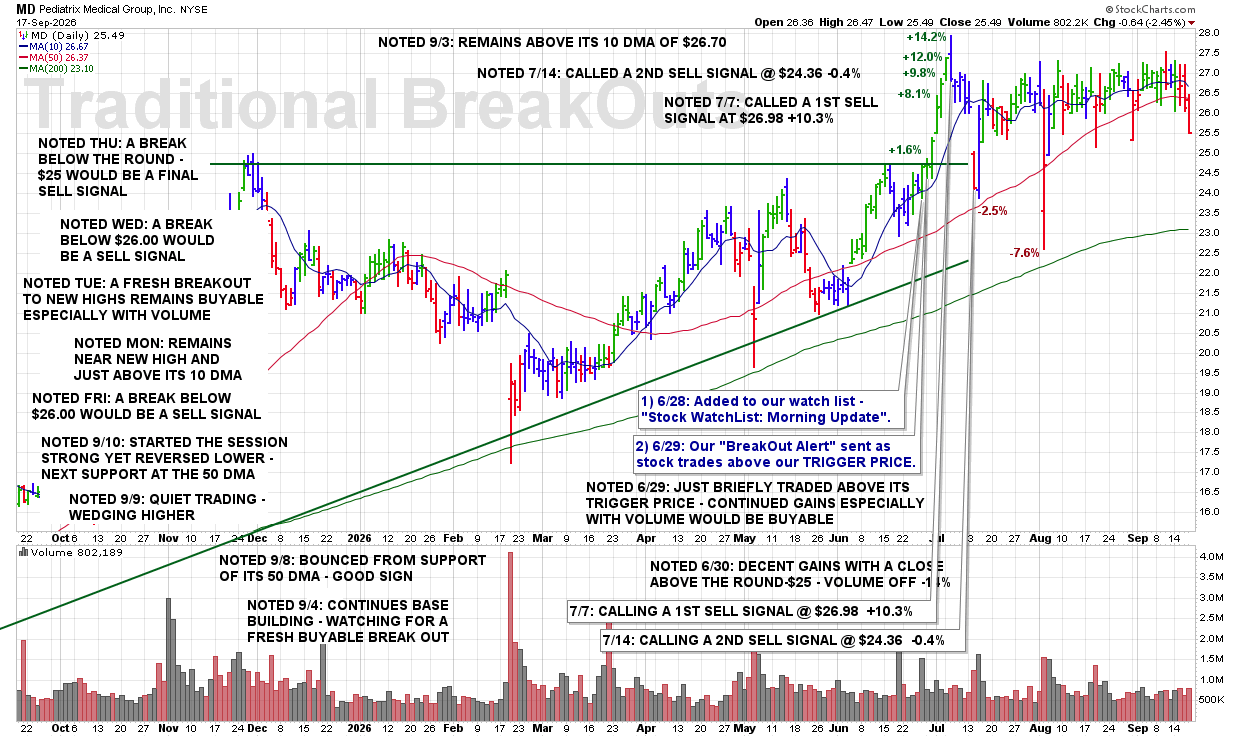
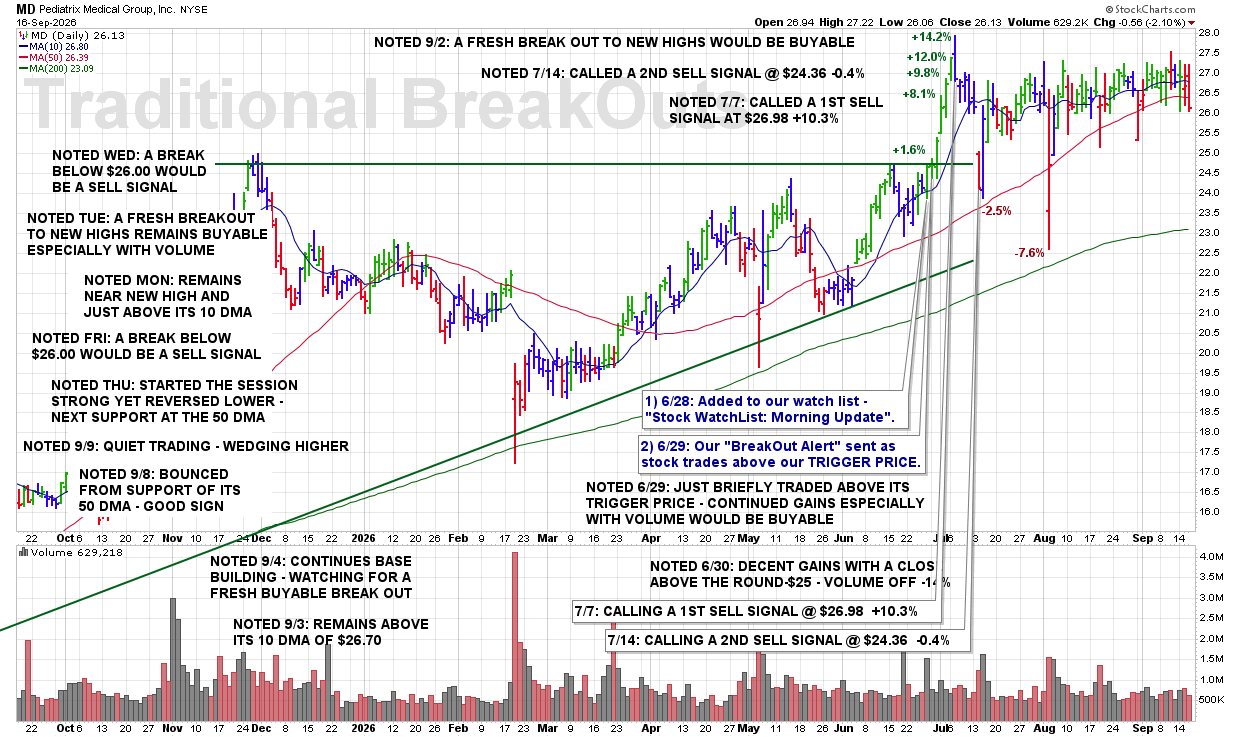
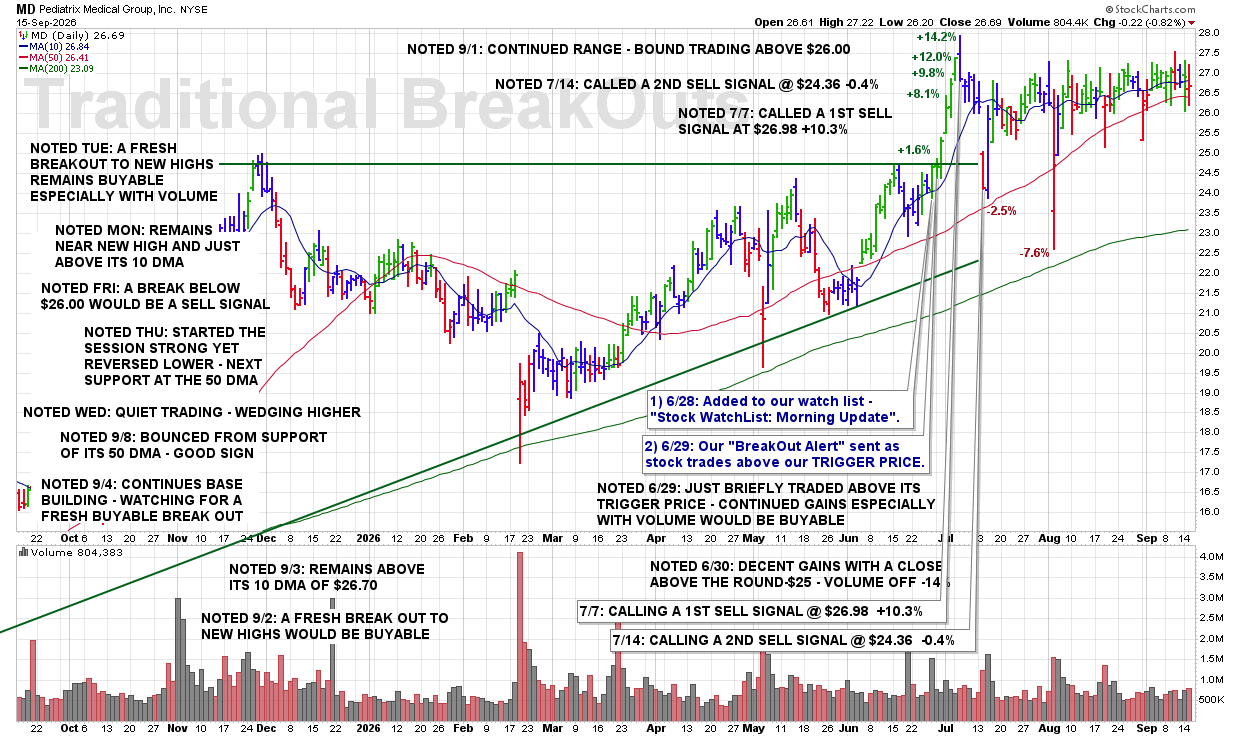
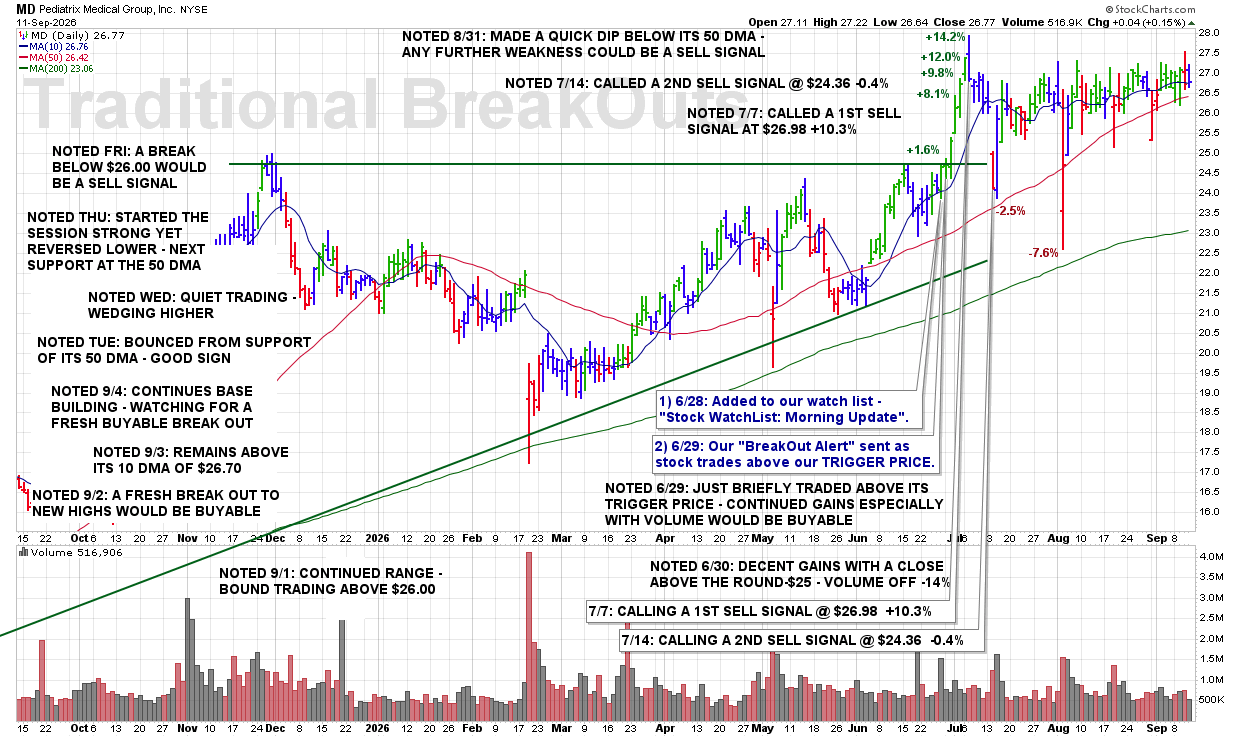
FRI 9/18 – MD – Did Reverse Higher Yet Remains Under Several Levels of Resistance

8:00 PM – Here is our latest chart update for this recent breakout from our Traditional BreakOuts Watch List.

CLICK/TAP CHART TO ZOOM
Chart services courtesy of stockcharts.com. Annotations by James Taulman.

We are currently reporting on this stock as an active holding and continue to monitor the stock closely for any technical SELL SIGNALS.

The focus always remains on price/volume action around key support levels, including the 10 DMA, 50 DMA, and any nearby trendline or ROUND-$ support.

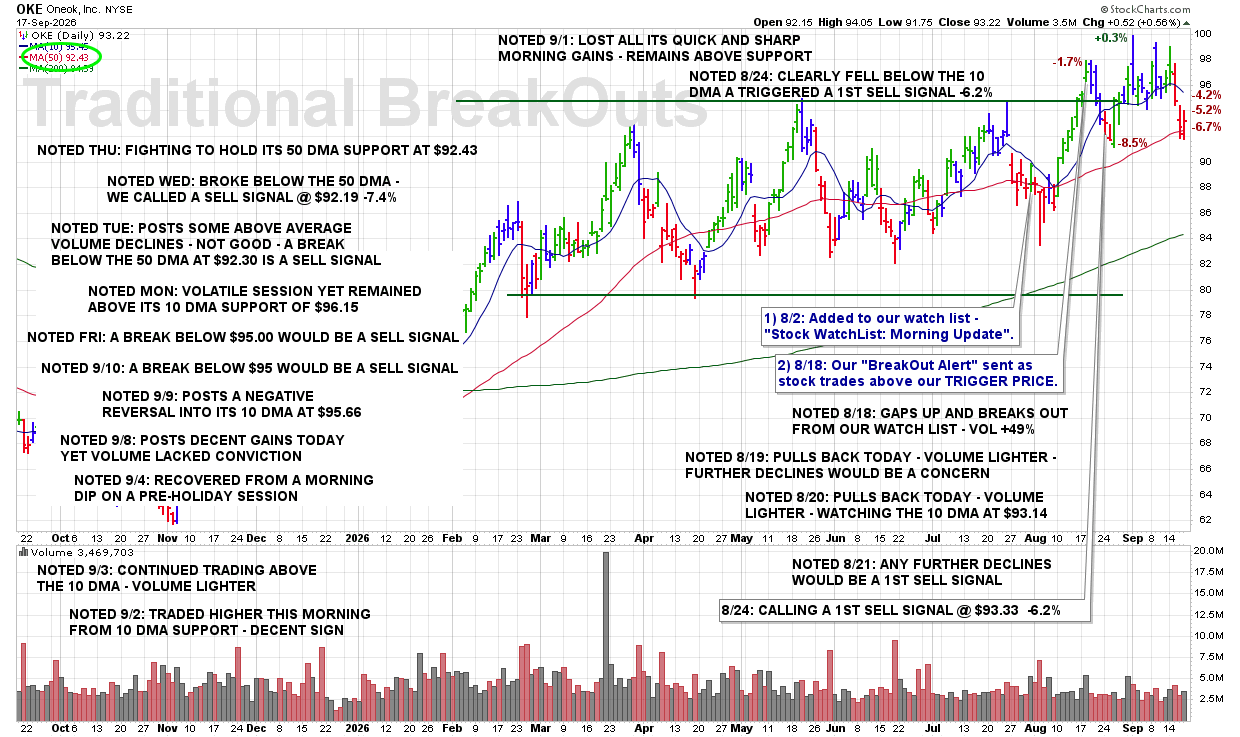
THU 9/17: OKE – Fighting to Hold Its 50 DMA Support at $92.43

8:40 PM – Here is our latest chart update for this recent breakout from our Traditional BreakOuts Watch List.

CLICK/TAP CHART TO ZOOM
Chart services courtesy of stockcharts.com. Annotations by James Taulman.

We are currently reporting on this stock as an active holding and continue to monitor the stock closely for any technical SELL SIGNALS.

The focus always remains on price/volume action around key support levels, including the 10 DMA, 50 DMA, and any nearby trendline or ROUND-$ support.

THU 9/17: NDSN – Still Needs to Close Above Its 10 DMA at $312.30

8:35 PM – Here is our latest chart update for this recent breakout from our Traditional BreakOuts Watch List

CLICK/TAP CHART TO ZOOM
Chart services courtesy of stockcharts.com. Annotations by James Taulman.

We are currently reporting on this stock as an active holding and continue to monitor the stock closely for any technical SELL SIGNALS.

The focus always remains on price/volume action around key support levels, including the 10 DMA, 50 DMA, and any nearby trendline or ROUND-$ support.

THU 9/17: MD – A Break Below the Round-$25 Would Be a Final Sell Signal

8:30 PM – Here is our latest chart update for this recent breakout from our Traditional BreakOuts Watch List.

CLICK/TAP CHART TO ZOOM
Chart services courtesy of stockcharts.com. Annotations by James Taulman.

We are currently reporting on this stock as an active holding and continue to monitor the stock closely for any technical SELL SIGNALS.

The focus always remains on price/volume action around key support levels, including the 10 DMA, 50 DMA, and any nearby trendline or ROUND-$ support.

WED 9/16: OKE – Broke Below The 50 DMA – We Called A Sell Signal @ $92.19 -7.4%

8:25 PM – Here is our latest chart update for this recent breakout from our Traditional BreakOuts Watch List.

CLICK/TAP CHART TO ZOOM
Chart services courtesy of stockcharts.com. Annotations by James Taulman.

We are currently reporting on this stock as an active holding and continue to monitor the stock closely for any technical SELL SIGNALS.

The focus always remains on price/volume action around key support levels, including the 10 DMA, 50 DMA, and any nearby trendline or ROUND-$ support.

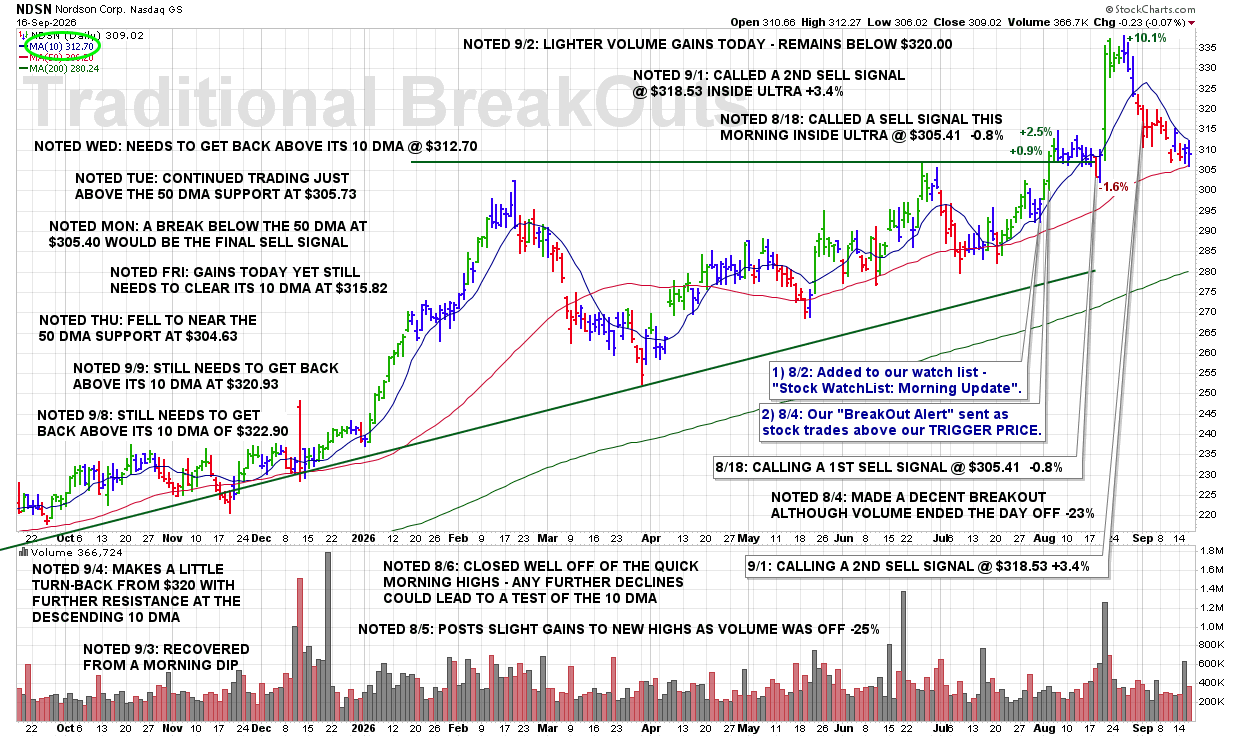
WED 9/16: NDSN – Needs to Get Back Above Its 10 DMA @ $312.70

8:20 PM – Here is our latest chart update for this recent breakout from our Traditional BreakOuts Watch List

CLICK/TAP CHART TO ZOOM
Chart services courtesy of stockcharts.com. Annotations by James Taulman.

We are currently reporting on this stock as an active holding and continue to monitor the stock closely for any technical SELL SIGNALS.

The focus always remains on price/volume action around key support levels, including the 10 DMA, 50 DMA, and any nearby trendline or ROUND-$ support.

WED 9/16: MD – A Break Below $26.00 Would Be a Sell Signal

8:15 PM – Here is our latest chart update for this recent breakout from our Traditional BreakOuts Watch List.

CLICK/TAP CHART TO ZOOM
Chart services courtesy of stockcharts.com. Annotations by James Taulman.

We are currently reporting on this stock as an active holding and continue to monitor the stock closely for any technical SELL SIGNALS.

The focus always remains on price/volume action around key support levels, including the 10 DMA, 50 DMA, and any nearby trendline or ROUND-$ support.

TUE 9/15: OKE- Posts Some Above Average Volume Declines – Not Good – a Break Below the 50 DMA at $92.30 Is a Sell Signal

8:30 PM – Here is our latest chart update for this recent breakout from our Traditional BreakOuts Watch List.

CLICK/TAP CHART TO ZOOM
Chart services courtesy of stockcharts.com. Annotations by James Taulman.

We are currently reporting on this stock as an active holding and continue to monitor the stock closely for any technical SELL SIGNALS.

The focus always remains on price/volume action around key support levels, including the 10 DMA, 50 DMA, and any nearby trendline or ROUND-$ support.

TUE 9/15: NDSN – Continued Trading Just Above the 50 DMA Support at $305.73

8:25 PM – Here is our latest chart update for this recent breakout from our Traditional BreakOuts Watch List

CLICK/TAP CHART TO ZOOM
Chart services courtesy of stockcharts.com. Annotations by James Taulman.

We are currently reporting on this stock as an active holding and continue to monitor the stock closely for any technical SELL SIGNALS.

The focus always remains on price/volume action around key support levels, including the 10 DMA, 50 DMA, and any nearby trendline or ROUND-$ support.

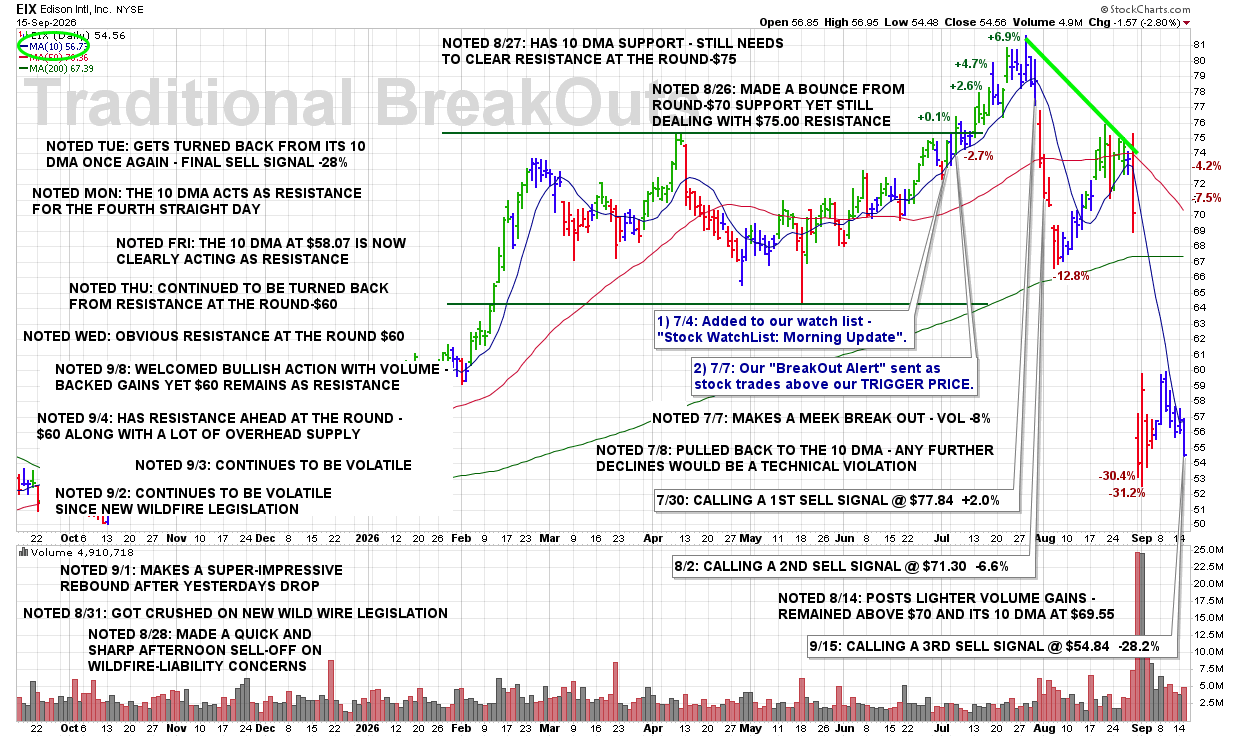
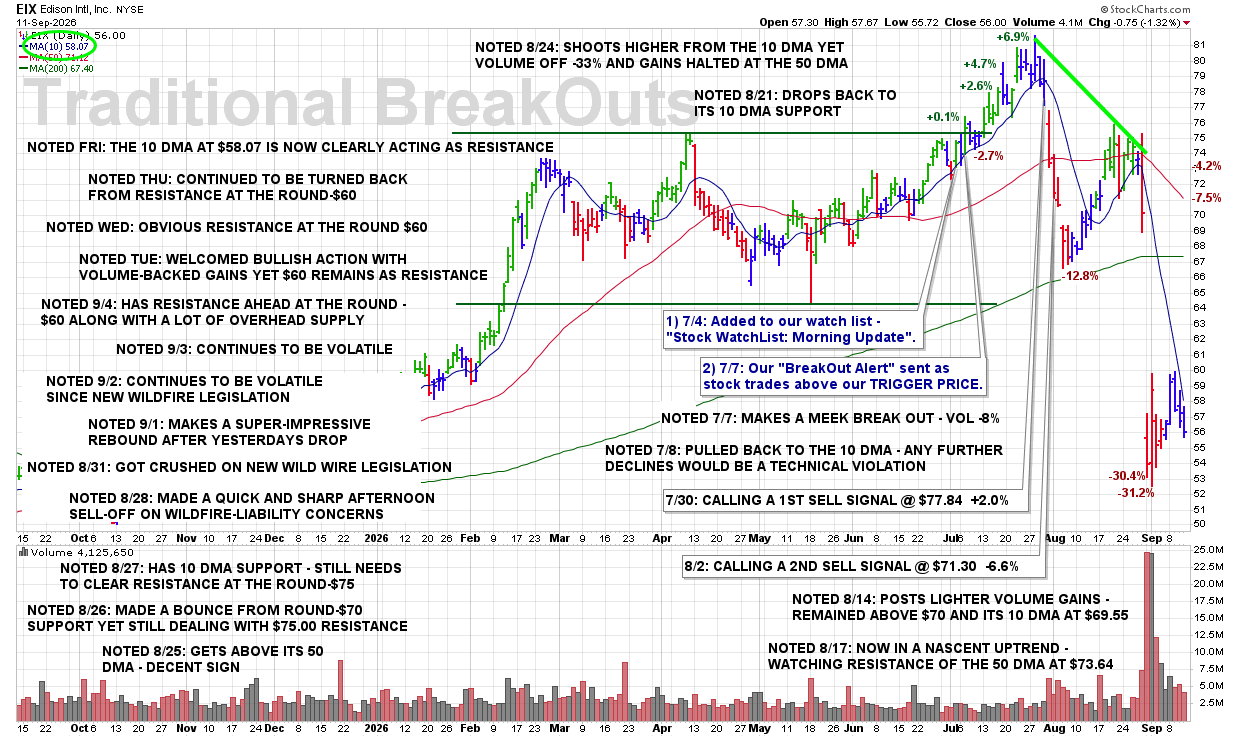
TUE 9/15: EIX – Gets Turned Back From Its 10 DMA Once Again – Final Sell Signal -28%

8:20 PM – Here is our latest chart update for this recent breakout from our Traditional BreakOuts Watch List.

CLICK/TAP CHART TO ZOOM
Chart services courtesy of stockcharts.com. Annotations by James Taulman.

We are currently reporting on this stock as an active holding and continue to monitor the stock closely for any technical SELL SIGNALS.

The focus always remains on price/volume action around key support levels, including the 10 DMA, 50 DMA, and any nearby trendline or ROUND-$ support.

TUE 9/15: MD – A Fresh Breakout to New Highs Remains Buyable Especially With Volume

8:15 PM – Here is our latest chart update for this recent breakout from our Traditional BreakOuts Watch List.

CLICK/TAP CHART TO ZOOM
Chart services courtesy of stockcharts.com. Annotations by James Taulman.

We are currently reporting on this stock as an active holding and continue to monitor the stock closely for any technical SELL SIGNALS.

The focus always remains on price/volume action around key support levels, including the 10 DMA, 50 DMA, and any nearby trendline or ROUND-$ support.

TUE 9/15: OII – Todays Gains Halted At The 10 DMA – Not Great

8:10 PM – Here is our latest chart update for this recent breakout from our Traditional BreakOuts Watch List.

CLICK/TAP CHART TO ZOOM
Chart services courtesy of stockcharts.com. Annotations by James Taulman.

We are currently reporting on this stock as an active holding and continue to monitor the stock closely for any technical SELL SIGNALS.

The focus always remains on price/volume action around key support levels, including the 10 DMA, 50 DMA, and any nearby trendline or ROUND-$ support.

MON 9/14: OKE – Volatile Session Yet Remained Above Its 10 DMA Support of $96.15

8:59 PM – Here is our latest chart update for this recent breakout from our Traditional BreakOuts Watch List.

CLICK/TAP CHART TO ZOOM
Chart services courtesy of stockcharts.com. Annotations by James Taulman.

We are currently reporting on this stock as an active holding and continue to monitor the stock closely for any technical SELL SIGNALS.

The focus always remains on price/volume action around key support levels, including the 10 DMA, 50 DMA, and any nearby trendline or ROUND-$ support.

MON 9/14: NDSN – A Break Below the 50 DMA at $305.40 Would Be the Final Sell Signal

8:55 PM – Here is our latest chart update for this recent breakout from our Traditional BreakOuts Watch List

CLICK/TAP CHART TO ZOOM
Chart services courtesy of stockcharts.com. Annotations by James Taulman.

We are currently reporting on this stock as an active holding and continue to monitor the stock closely for any technical SELL SIGNALS.

The focus always remains on price/volume action around key support levels, including the 10 DMA, 50 DMA, and any nearby trendline or ROUND-$ support.

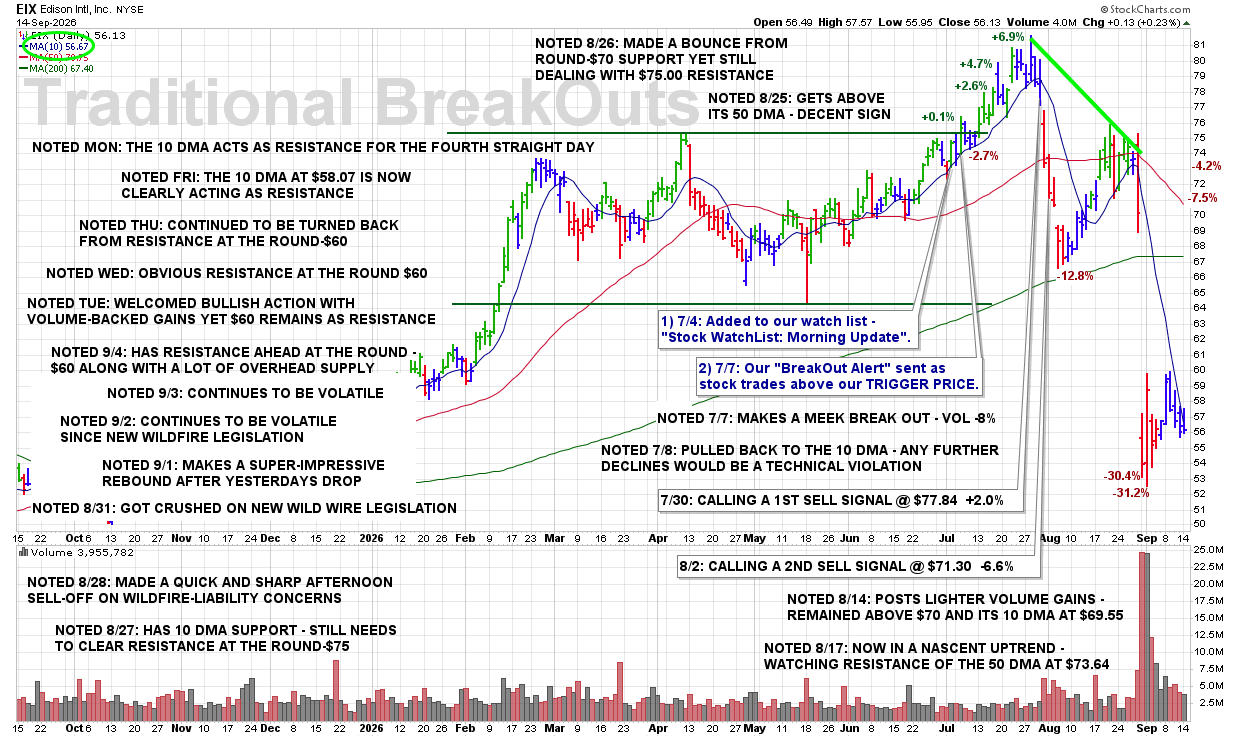
MON 9/14: EIX – The 10 DMA Acts as Resistance for the Fourth Straight Day

8:50 PM – Here is our latest chart update for this recent breakout from our Traditional BreakOuts Watch List.

CLICK/TAP CHART TO ZOOM
Chart services courtesy of stockcharts.com. Annotations by James Taulman.

We are currently reporting on this stock as an active holding and continue to monitor the stock closely for any technical SELL SIGNALS.

The focus always remains on price/volume action around key support levels, including the 10 DMA, 50 DMA, and any nearby trendline or ROUND-$ support.

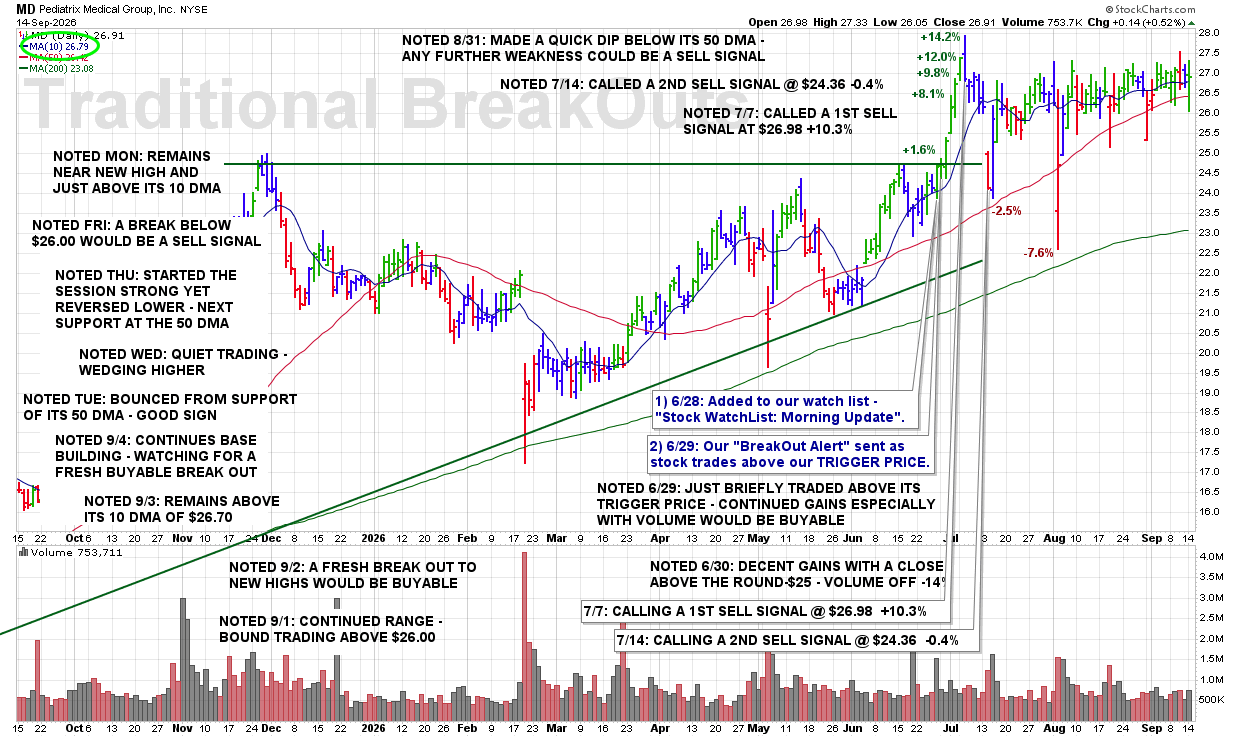
MON 9/14: MD – Remains Near New High and Just Above Its 10 DMA

8:45 PM – Here is our latest chart update for this recent breakout from our Traditional BreakOuts Watch List.

CLICK/TAP CHART TO ZOOM
Chart services courtesy of stockcharts.com. Annotations by James Taulman.

We are currently reporting on this stock as an active holding and continue to monitor the stock closely for any technical SELL SIGNALS.

The focus always remains on price/volume action around key support levels, including the 10 DMA, 50 DMA, and any nearby trendline or ROUND-$ support.

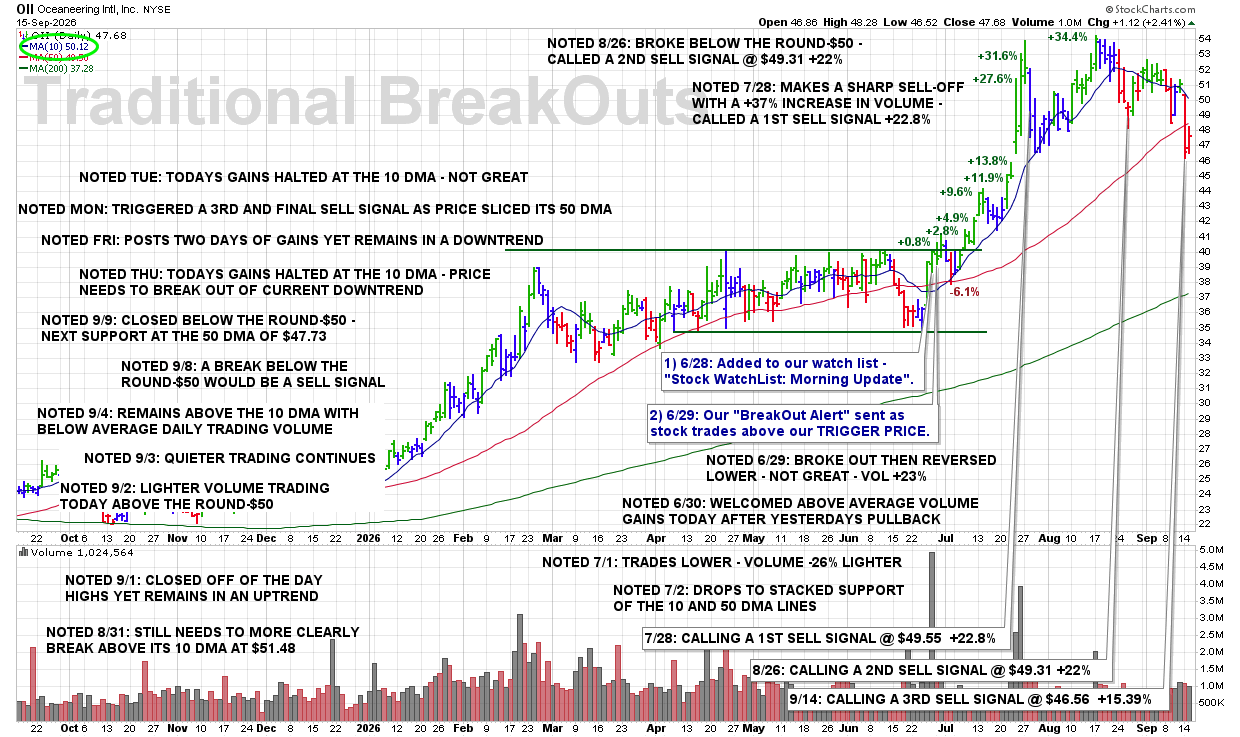
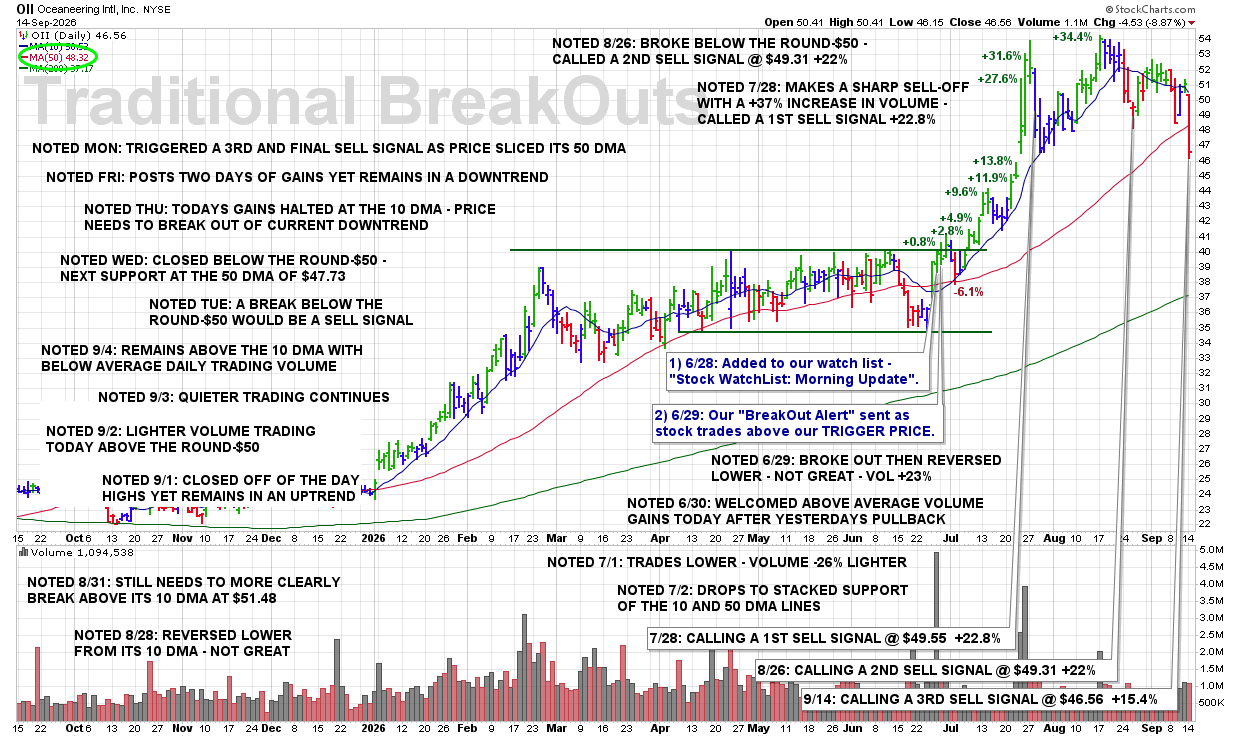
MON 9/14: OII – Triggered a 3rd and Final Sell Signal as Price Sliced Its 50 DMA

8:40 PM – Here is our latest chart update for this recent breakout from our Traditional BreakOuts Watch List.

CLICK/TAP CHART TO ZOOM
Chart services courtesy of stockcharts.com. Annotations by James Taulman.

We are currently reporting on this stock as an active holding and continue to monitor the stock closely for any technical SELL SIGNALS.

The focus always remains on price/volume action around key support levels, including the 10 DMA, 50 DMA, and any nearby trendline or ROUND-$ support.

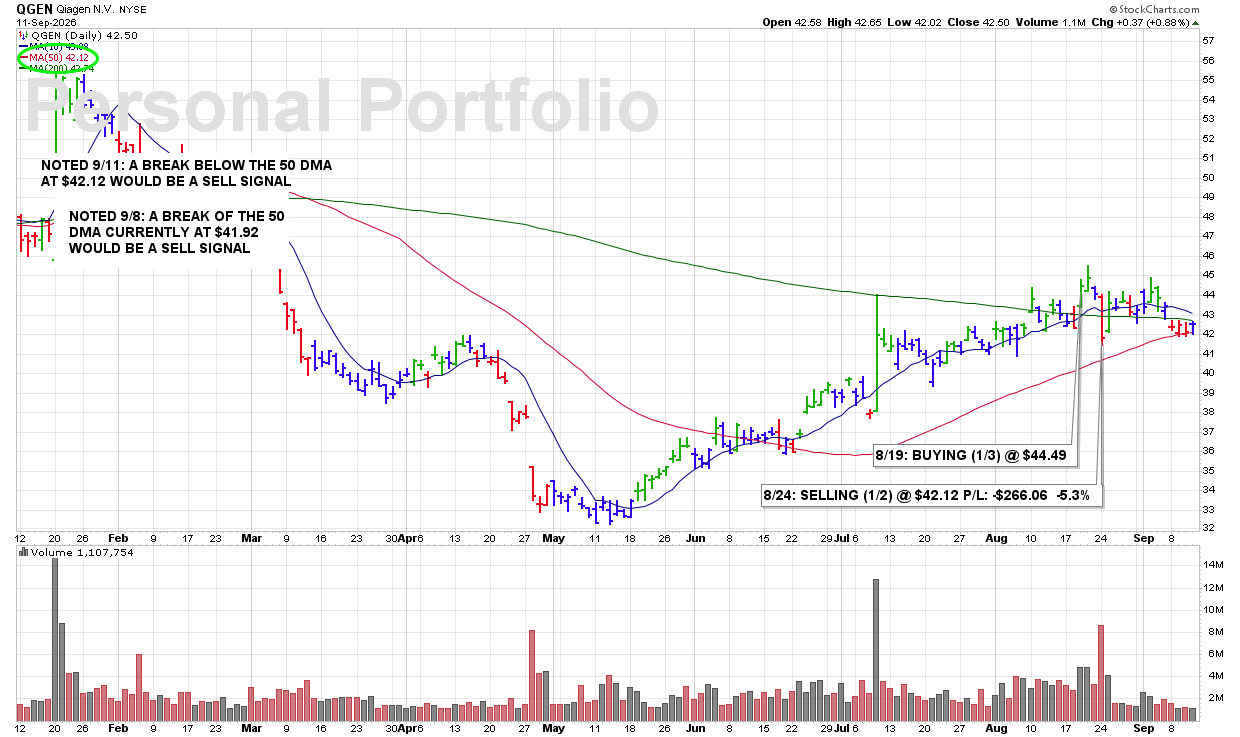
FRI 9/11: QGEN – A Break Below the 50 DMA at $42.12 Would Be a Sell Signal

9:20 PM – We are currently reporting on this stock as an active holding and continue to monitor the stock closely for any technical SELL SIGNALS.

The focus always remains on price/volume action around key support levels, including the 10 DMA, 50 DMA, and any nearby trendline or ROUND-$ support.

CLICK/TAP CHART TO ZOOM
Chart services courtesy of stockcharts.com. Annotations by James Taulman.

FRI 9/11: HTGC – Starting to Make Lower Highs – Not Good

9:15 PM – We are currently reporting on this stock as an active holding and continue to monitor the stock closely for any technical SELL SIGNALS.

The focus always remains on price/volume action around key support levels, including the 10 DMA, 50 DMA, and any nearby trendline or ROUND-$ support.

CLICK/TAP CHART TO ZOOM
Chart services courtesy of stockcharts.com. Annotations by James Taulman.

FRI 9/11: HIPO – Got Turned Back From Its 10 DMA Today – Not Good

9:10 PM – We are currently reporting on this stock as an active holding and continue to monitor the stock closely for any technical SELL SIGNALS.

The focus always remains on price/volume action around key support levels, including the 10 DMA, 50 DMA, and any nearby trendline or ROUND-$ support.

CLICK/TAP CHART TO ZOOM
Chart services courtesy of stockcharts.com. Annotations by James Taulman.

FRI 9/11: GLAD – Trading Just Above Support of the 200 DMA at $18.55 – a Break Below There Is a Sell Signal

9:05 PM – We are currently reporting on this stock as an active holding and continue to monitor the stock closely for any technical SELL SIGNALS.

The focus always remains on price/volume action around key support levels, including the 10 DMA, 50 DMA, and any nearby trendline or ROUND-$ support.

CLICK/TAP CHART TO ZOOM
Chart services courtesy of stockcharts.com. Annotations by James Taulman.

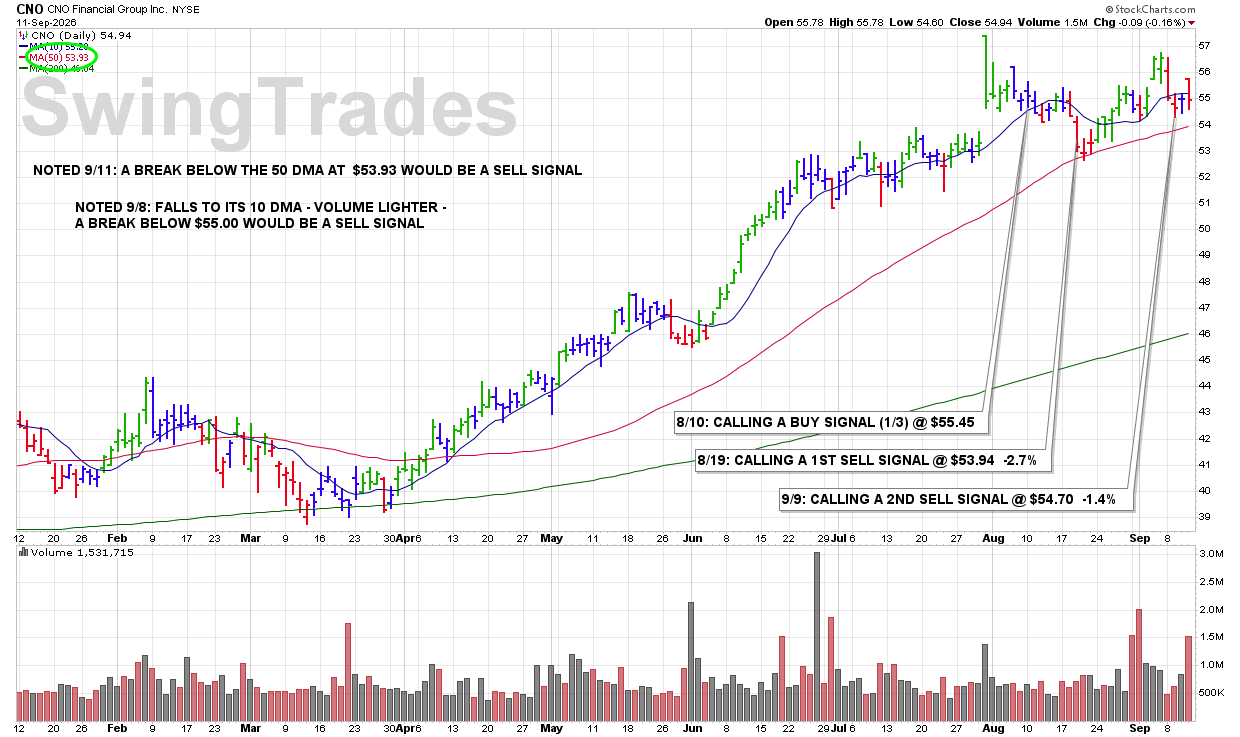
FRI 9/11: CNO – A Break Below the 50 DMA at $53.93 Would Be a Sell Signal

9:00 PM – We are currently reporting on this stock as an active holding and continue to monitor the stock closely for any technical SELL SIGNALS.

The focus always remains on price/volume action around key support levels, including the 10 DMA, 50 DMA, and any nearby trendline or ROUND-$ support.

CLICK/TAP CHART TO ZOOM
Chart services courtesy of stockcharts.com. Annotations by James Taulman.

FRI 9/11: OKE – A Break Below $95.00 Would Be a Sell Signal

8:50 PM – Here is our latest chart update for this recent breakout from our Traditional BreakOuts Watch List.

CLICK/TAP CHART TO ZOOM
Chart services courtesy of stockcharts.com. Annotations by James Taulman.

We are currently reporting on this stock as an active holding and continue to monitor the stock closely for any technical SELL SIGNALS.

The focus always remains on price/volume action around key support levels, including the 10 DMA, 50 DMA, and any nearby trendline or ROUND-$ support.

FRI 9/11: NDSN – Gains Today Yet Still Needs to Clear Its 10 DMA at $315.82

8:45 PM – Here is our latest chart update for this recent breakout from our Traditional BreakOuts Watch List

CLICK/TAP CHART TO ZOOM
Chart services courtesy of stockcharts.com. Annotations by James Taulman.

We are currently reporting on this stock as an active holding and continue to monitor the stock closely for any technical SELL SIGNALS.

The focus always remains on price/volume action around key support levels, including the 10 DMA, 50 DMA, and any nearby trendline or ROUND-$ support.

FRI 9/11: EIX – The 10 DMA at $58.07 Is Now Clearly Acting as Resistance

8:40 PM – Here is our latest chart update for this recent breakout from our Traditional BreakOuts Watch List.

CLICK/TAP CHART TO ZOOM
Chart services courtesy of stockcharts.com. Annotations by James Taulman.

We are currently reporting on this stock as an active holding and continue to monitor the stock closely for any technical SELL SIGNALS.

The focus always remains on price/volume action around key support levels, including the 10 DMA, 50 DMA, and any nearby trendline or ROUND-$ support.

FRI 9/11: MD – A Break Below $26.00 Would Be a Sell Signal

8:35 PM – Here is our latest chart update for this recent breakout from our Traditional BreakOuts Watch List.

CLICK/TAP CHART TO ZOOM
Chart services courtesy of stockcharts.com. Annotations by James Taulman.

We are currently reporting on this stock as an active holding and continue to monitor the stock closely for any technical SELL SIGNALS.

The focus always remains on price/volume action around key support levels, including the 10 DMA, 50 DMA, and any nearby trendline or ROUND-$ support.

FRI 9/11: OII – Posts Two Days of Gains Yet Remains in a Downtrend

8:30 PM – Here is our latest chart update for this recent breakout from our Traditional BreakOuts Watch List.

CLICK/TAP CHART TO ZOOM
Chart services courtesy of stockcharts.com. Annotations by James Taulman.

We are currently reporting on this stock as an active holding and continue to monitor the stock closely for any technical SELL SIGNALS.

The focus always remains on price/volume action around key support levels, including the 10 DMA, 50 DMA, and any nearby trendline or ROUND-$ support.

THU 9/10: OKE – A Break Below $95 Would Be a Sell Signal

8:50 PM – Here is our latest chart update for this recent breakout from our Traditional BreakOuts Watch List.

CLICK/TAP CHART TO ZOOM
Chart services courtesy of stockcharts.com. Annotations by James Taulman.

We are currently reporting on this stock as an active holding and continue to monitor the stock closely for any technical SELL SIGNALS.

The focus always remains on price/volume action around key support levels, including the 10 DMA, 50 DMA, and any nearby trendline or ROUND-$ support.

THU 9/10: NDSN – Fell to Near the 50 DMA Support at $304.63

8:45 PM – Here is our latest chart update for this recent breakout from our Traditional BreakOuts Watch List

CLICK/TAP CHART TO ZOOM
Chart services courtesy of stockcharts.com. Annotations by James Taulman.

We are currently reporting on this stock as an active holding and continue to monitor the stock closely for any technical SELL SIGNALS.

The focus always remains on price/volume action around key support levels, including the 10 DMA, 50 DMA, and any nearby trendline or ROUND-$ support.

THU 9/10: EIX – Continued to Be Turned Back From Resistance at the Round-$60

8:40 PM – Here is our latest chart update for this recent breakout from our Traditional BreakOuts Watch List.

CLICK/TAP CHART TO ZOOM
Chart services courtesy of stockcharts.com. Annotations by James Taulman.

We are currently reporting on this stock as an active holding and continue to monitor the stock closely for any technical SELL SIGNALS.

The focus always remains on price/volume action around key support levels, including the 10 DMA, 50 DMA, and any nearby trendline or ROUND-$ support.

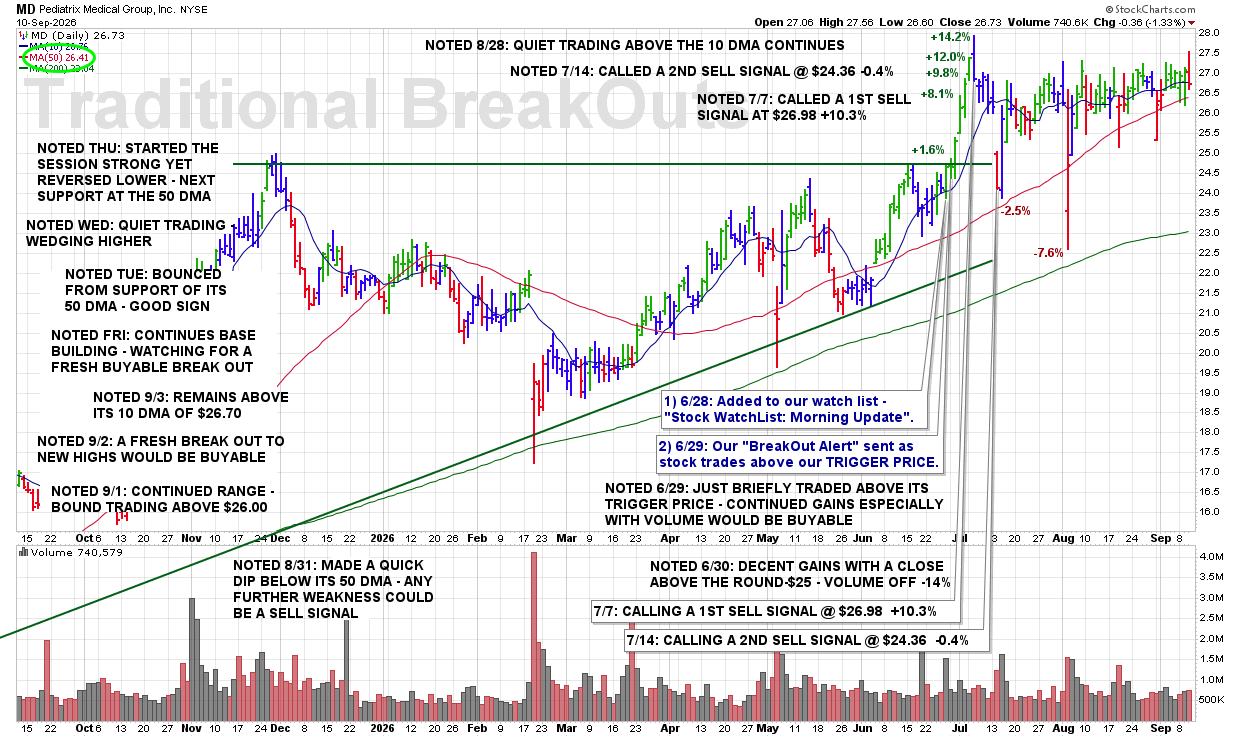
THU 9/10: MD – Started the Session Strong Yet Reversed Lower – Next Support at the 50 DMA

8:35 PM – Here is our latest chart update for this recent breakout from our Traditional BreakOuts Watch List.

CLICK/TAP CHART TO ZOOM
Chart services courtesy of stockcharts.com. Annotations by James Taulman.

We are currently reporting on this stock as an active holding and continue to monitor the stock closely for any technical SELL SIGNALS.

The focus always remains on price/volume action around key support levels, including the 10 DMA, 50 DMA, and any nearby trendline or ROUND-$ support.

THU 9/10: OII – Todays Gains Halted at the 10 DMA – Price Needs to Break Out of Current Downtrend

8:30 PM – Here is our latest chart update for this recent breakout from our Traditional BreakOuts Watch List.

CLICK/TAP CHART TO ZOOM
Chart services courtesy of stockcharts.com. Annotations by James Taulman.

We are currently reporting on this stock as an active holding and continue to monitor the stock closely for any technical SELL SIGNALS.

The focus always remains on price/volume action around key support levels, including the 10 DMA, 50 DMA, and any nearby trendline or ROUND-$ support.

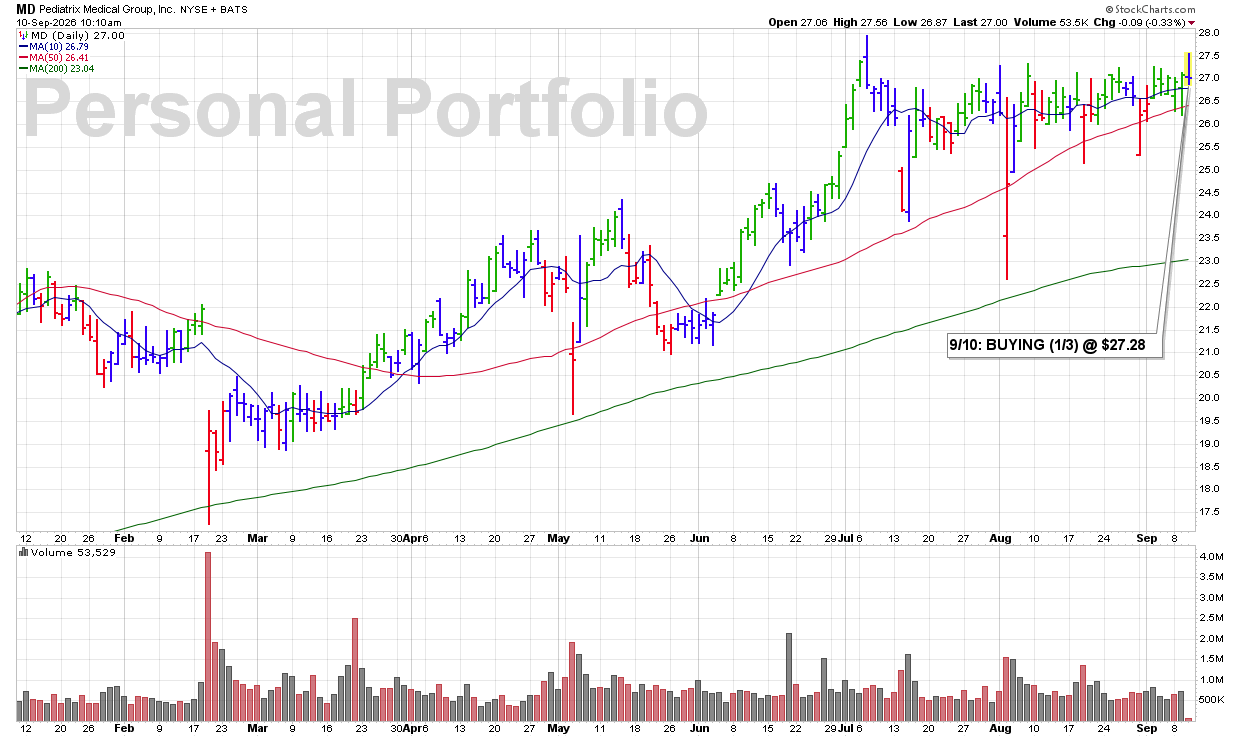
THU 9/10: MD — High-Ranked Medical Services Stock Breaking Out to New All-Time Highs

10:20 AM – Picked up a 1/3 position in this Medical Services stock as it sports very high overall rankings, is part of a leading industry group ranked 5th, and is clearly breaking above its previous highs with an increase in volume. The combination of strong rankings, industry group leadership, a breakout to new all-time highs, and increased volume gives me enough bullish technical evidence to initiate a position.

James’ Trader’s Tip: Look for Leadership Confirmed by Price and Volume

  • Stocks breaking into new all-time highs are demonstrating clear price strength.

  • Strength within a leading industry group adds another positive characteristic.

  • Increased volume helps confirm that there is meaningful demand behind the breakout.

CLICK/TAP CHART TO ZOOM
Chart services courtesy of stockcharts.com. Annotations by James Taulman.

WED 9/9: OKE – Posts a Negative Reversal Into Its 10 DMA at $95.66

8:50 PM – Here is our latest chart update for this recent breakout from our Traditional BreakOuts Watch List.

CLICK/TAP CHART TO ZOOM
Chart services courtesy of stockcharts.com. Annotations by James Taulman.

We are currently reporting on this stock as an active holding and continue to monitor the stock closely for any technical SELL SIGNALS.

The focus always remains on price/volume action around key support levels, including the 10 DMA, 50 DMA, and any nearby trendline or ROUND-$ support.

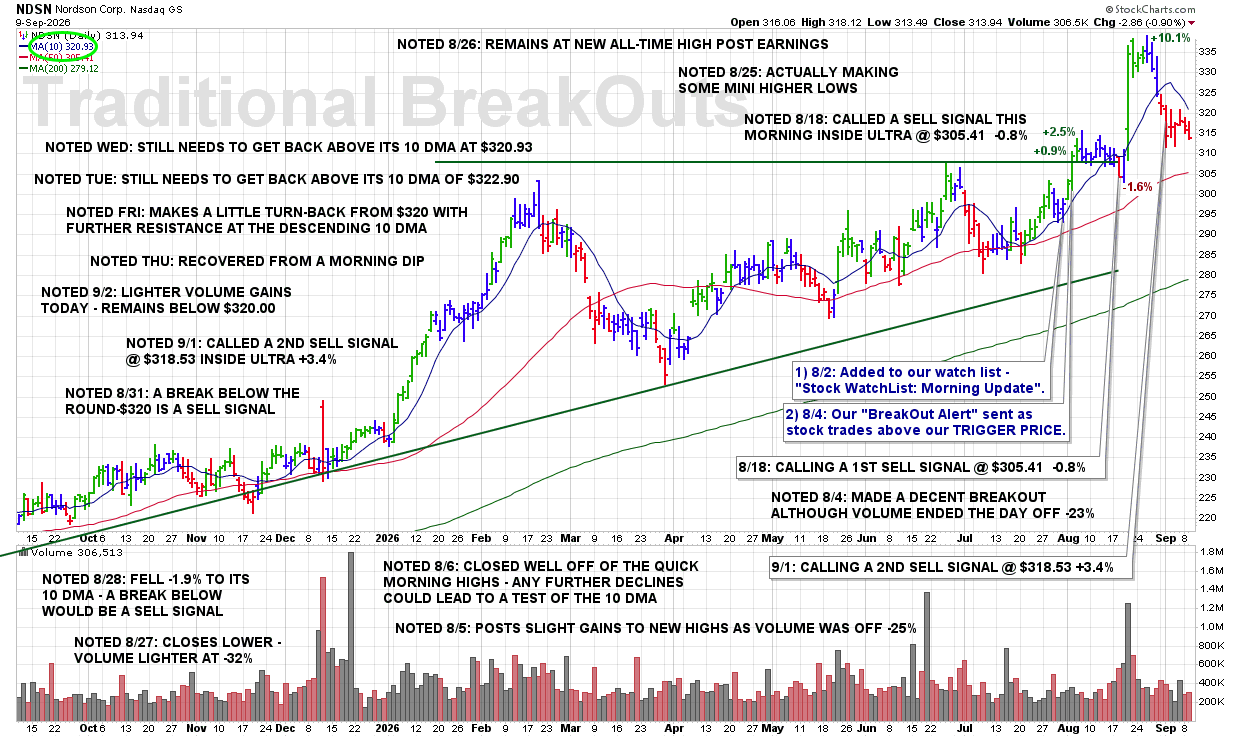
WED 9/9: NDSN – Still Needs to Get Back Above Its 10 DMA at $320.93

8:45 PM – Here is our latest chart update for this recent breakout from our Traditional BreakOuts Watch List

CLICK/TAP CHART TO ZOOM
Chart services courtesy of stockcharts.com. Annotations by James Taulman.

We are currently reporting on this stock as an active holding and continue to monitor the stock closely for any technical SELL SIGNALS.

The focus always remains on price/volume action around key support levels, including the 10 DMA, 50 DMA, and any nearby trendline or ROUND-$ support.

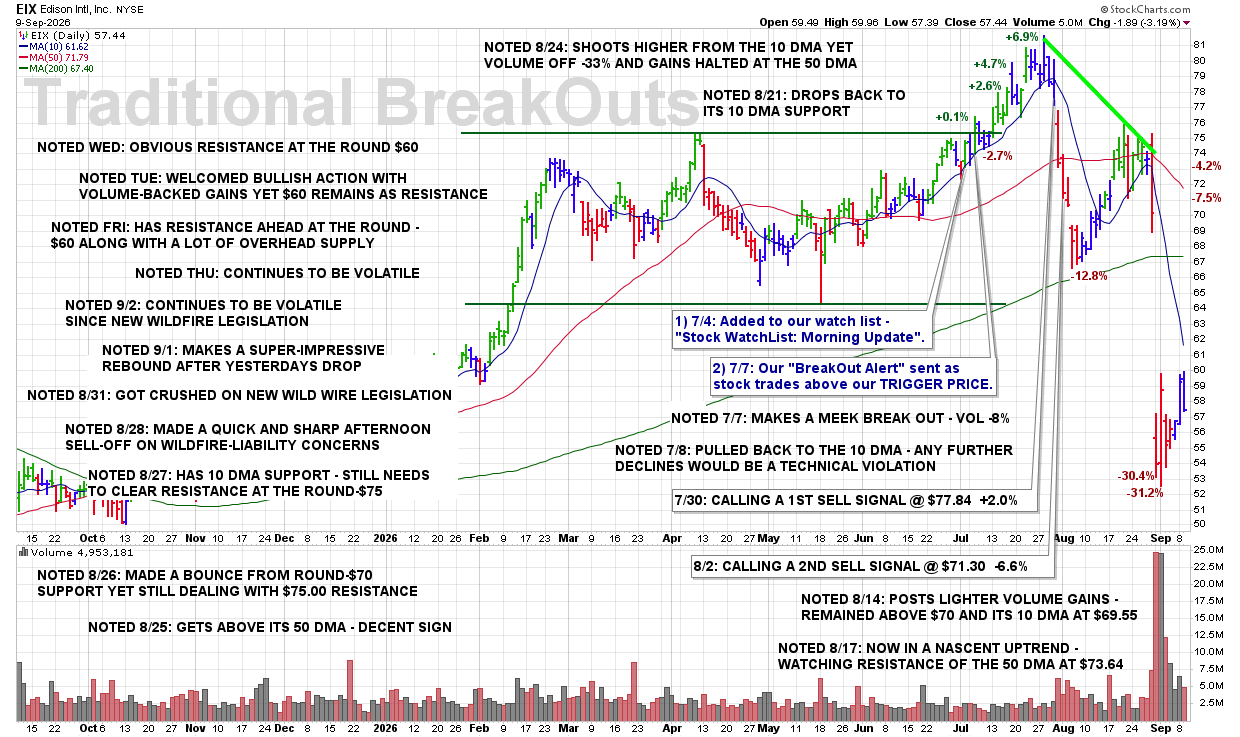
WED 9/9: EIX – Obvious Resistance at the Round $60

8:40 PM – Here is our latest chart update for this recent breakout from our Traditional BreakOuts Watch List.

CLICK/TAP CHART TO ZOOM
Chart services courtesy of stockcharts.com. Annotations by James Taulman.

We are currently reporting on this stock as an active holding and continue to monitor the stock closely for any technical SELL SIGNALS.

The focus always remains on price/volume action around key support levels, including the 10 DMA, 50 DMA, and any nearby trendline or ROUND-$ support.

WED 9/9: MD – Quiet Trading – Wedging Higher

8:35 PM – Here is our latest chart update for this recent breakout from our Traditional BreakOuts Watch List.

CLICK/TAP CHART TO ZOOM
Chart services courtesy of stockcharts.com. Annotations by James Taulman.

We are currently reporting on this stock as an active holding and continue to monitor the stock closely for any technical SELL SIGNALS.

The focus always remains on price/volume action around key support levels, including the 10 DMA, 50 DMA, and any nearby trendline or ROUND-$ support.

WED 9/9: OII – Closed Below the Round-$50 – Next Support at the 50 DMA of $47.73

8:30 PM – Here is our latest chart update for this recent breakout from our Traditional BreakOuts Watch List.

CLICK/TAP CHART TO ZOOM
Chart services courtesy of stockcharts.com. Annotations by James Taulman.

We are currently reporting on this stock as an active holding and continue to monitor the stock closely for any technical SELL SIGNALS.

The focus always remains on price/volume action around key support levels, including the 10 DMA, 50 DMA, and any nearby trendline or ROUND-$ support.

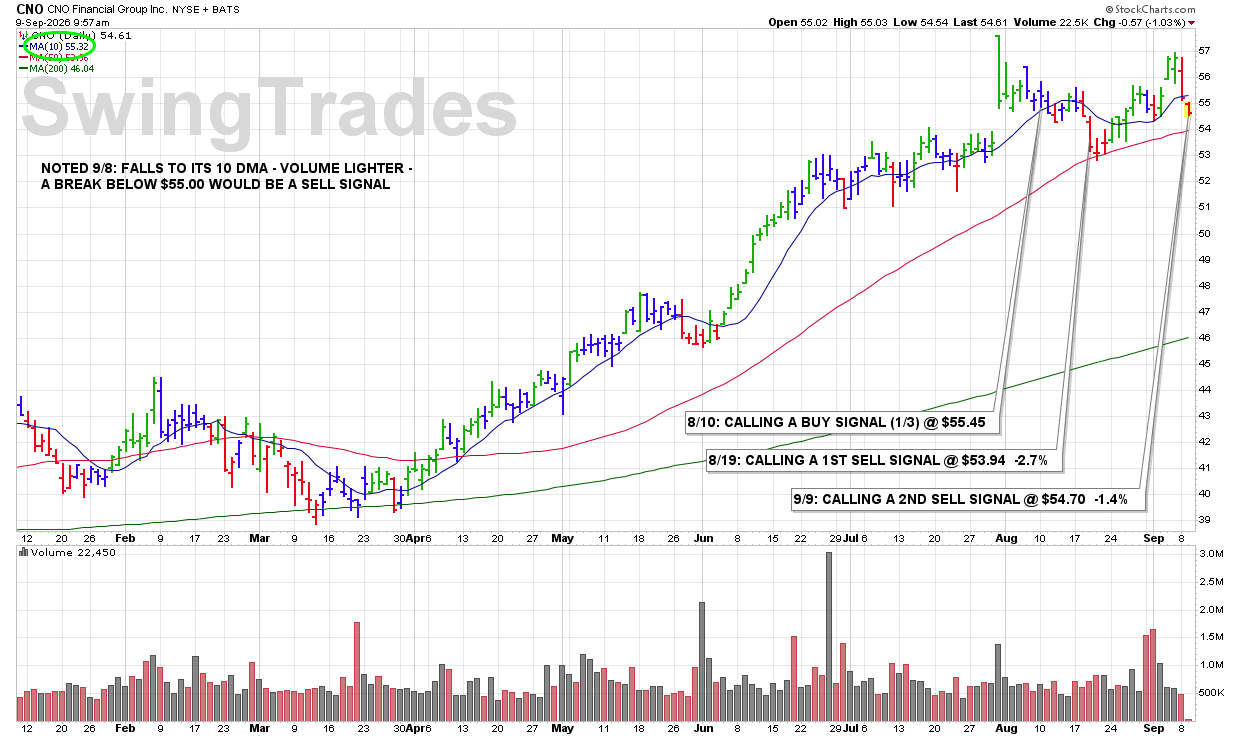
WED 9/9: CNO – Breaking Below $55 – Triggering a SELL SIGNAL

10:12 AM – As reported last night, “a break below $55.00 would be a SELL SIGNAL.” This morning shares are trading below that level while volume is running above average. That drop below the ROUND-$55 support level, accompanied by increased volume, is enough to trigger our 2ND SELL SIGNAL.

ULTRA Trader’s Tip: Define the Sell Level Before It Breaks

  • Identifying important support in advance gives us an objective level to act on.

  • A break below ROUND-$55 shows that the previously identified support is no longer holding.

  • Increased volume adds significance to the violation and reinforces the SELL SIGNAL.

CLICK/TAP CHART TO ZOOM
Chart services courtesy of stockcharts.com. Annotations by James Taulman.

TUE 9/8: MCK – Got Turned Back From the 10 DMA Today – Not Good

Latest Chart Update: MCK

9:55 PM – We are currently reporting on this stock as an active holding and continue to monitor the stock closely for any technical SELL SIGNALS.

The focus always remains on price/volume action around key support levels, including the 10 DMA, 50 DMA, and any nearby trendline or ROUND-$ support.

CLICK/TAP CHART TO ZOOM
Chart services courtesy of stockcharts.com. Annotations by James Taulman.

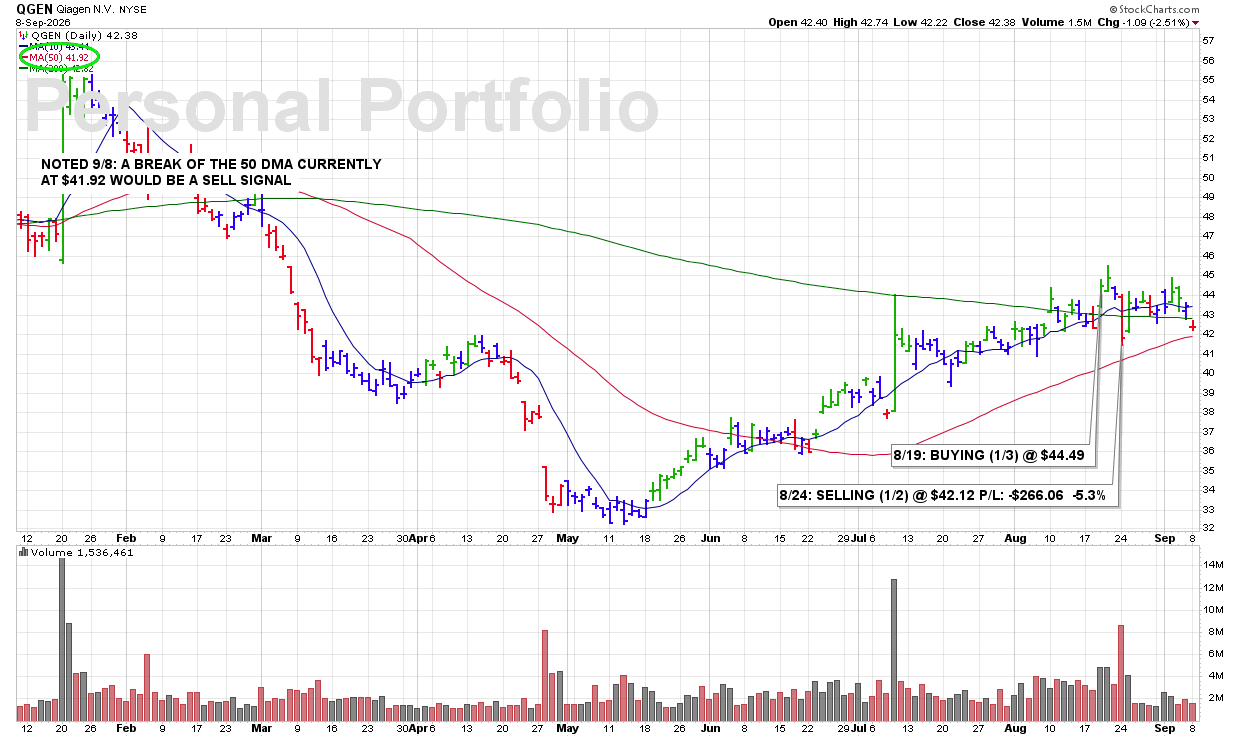
TUE 9/8: QGEN – A Break of the 50 DMA Currently at $41.92 Would Be a Sell Signal

Latest Chart Update: QGEN

9:50 PM – We are currently reporting on this stock as an active holding and continue to monitor the stock closely for any technical SELL SIGNALS.

The focus always remains on price/volume action around key support levels, including the 10 DMA, 50 DMA, and any nearby trendline or ROUND-$ support.

CLICK/TAP CHART TO ZOOM
Chart services courtesy of stockcharts.com. Annotations by James Taulman.

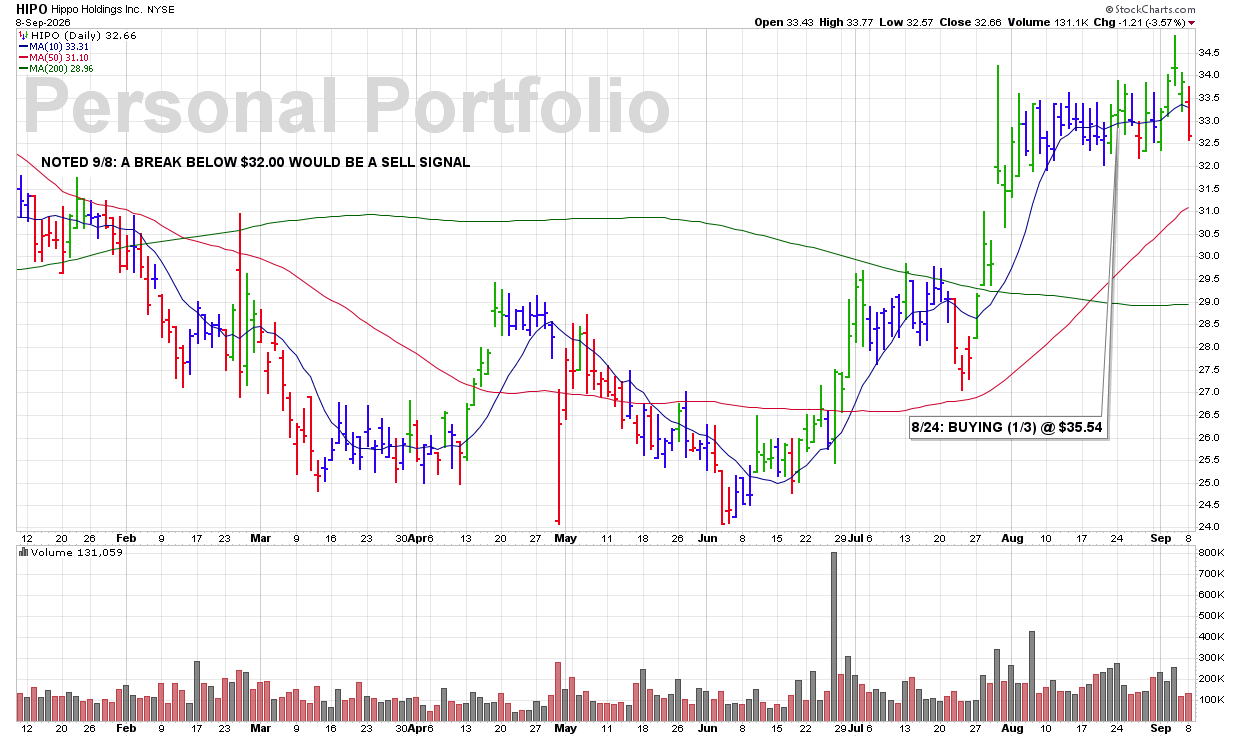
TUE 9/8: HIPO – A Break Below $32.00 Would Be a Sell Signal

Latest Chart Update: HIPO

9:45 PM – We are currently reporting on this stock as an active holding and continue to monitor the stock closely for any technical SELL SIGNALS.

The focus always remains on price/volume action around key support levels, including the 10 DMA, 50 DMA, and any nearby trendline or ROUND-$ support.

CLICK/TAP CHART TO ZOOM
Chart services courtesy of stockcharts.com. Annotations by James Taulman.

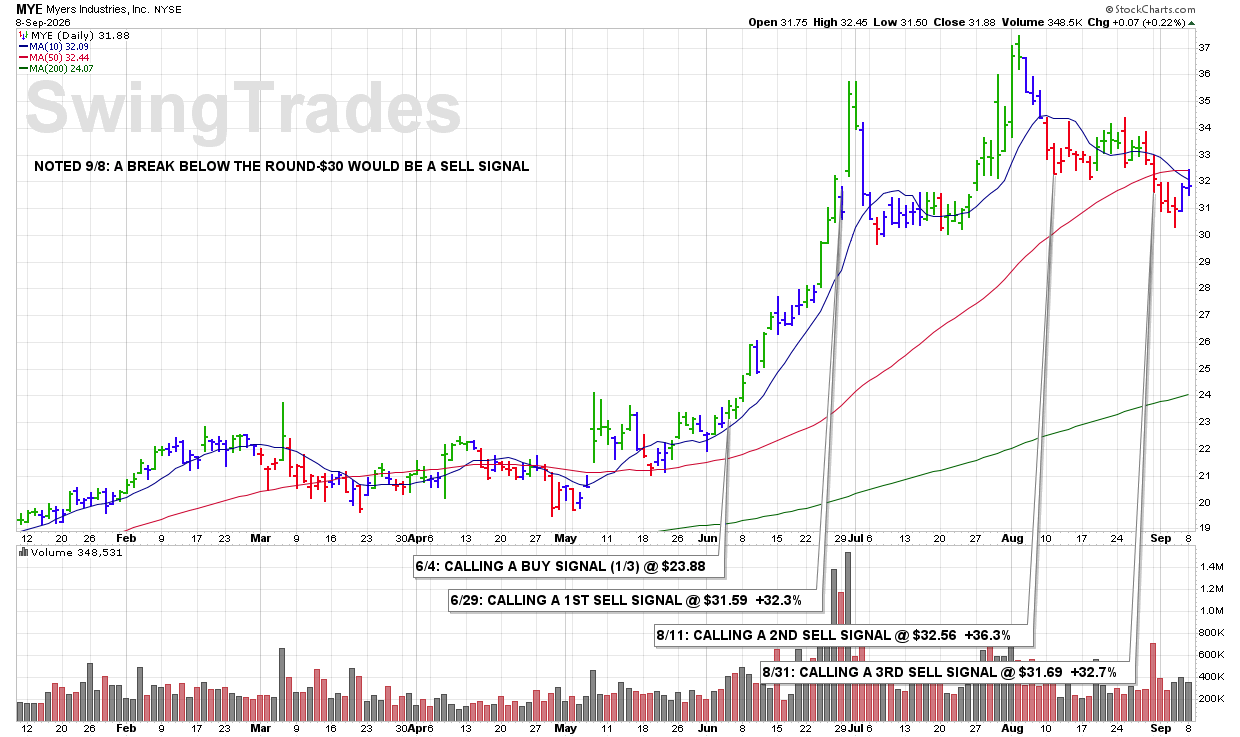
TUE 9/8: MYE – A Break Below the Round-$30 Would Be a Sell Signal

Latest Chart Update: MYE

9:40 PM – We are currently reporting on this stock as an active holding and continue to monitor the stock closely for any technical SELL SIGNALS.

The focus always remains on price/volume action around key support levels, including the 10 DMA, 50 DMA, and any nearby trendline or ROUND-$ support.

CLICK/TAP CHART TO ZOOM
Chart services courtesy of stockcharts.com. Annotations by James Taulman.

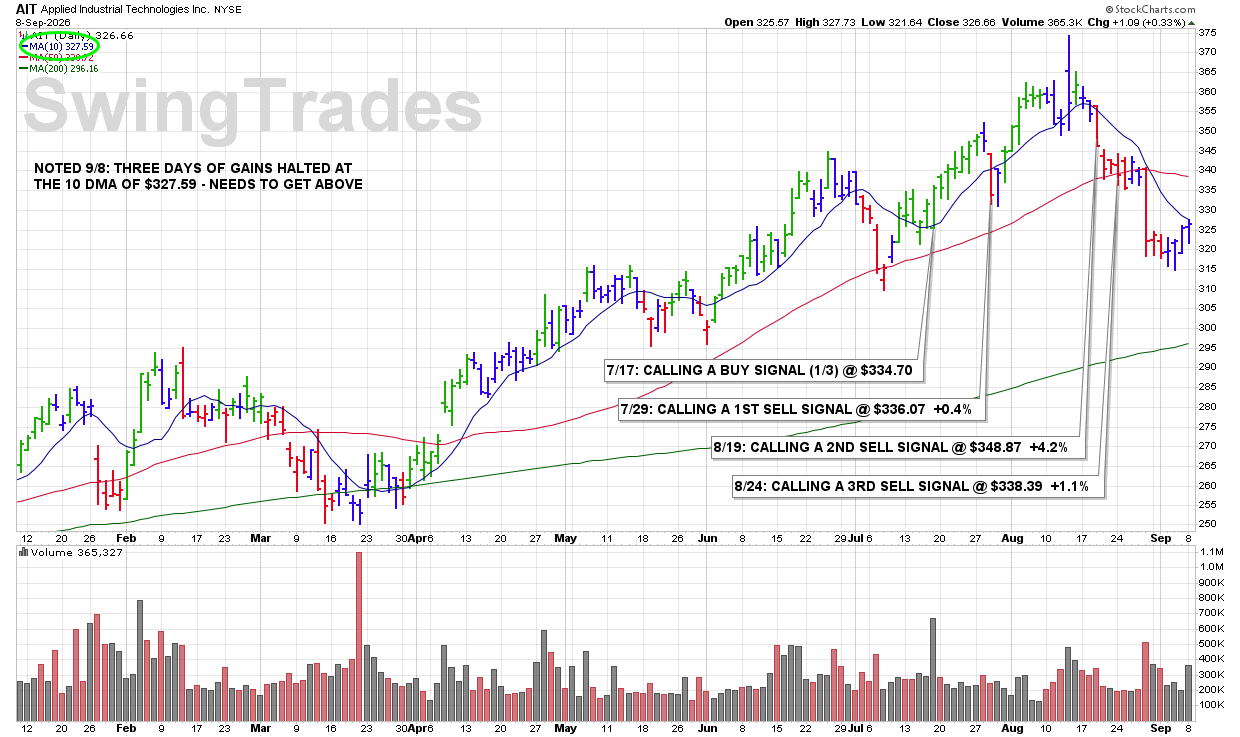
TUE 9/8: AIT – Three Days of Gains Halted at the 10 DMA of $327.59 – Needs to Get Above

Latest Chart Update: AIT

9:35 PM – We are currently reporting on this stock as an active holding and continue to monitor the stock closely for any technical SELL SIGNALS.

The focus always remains on price/volume action around key support levels, including the 10 DMA, 50 DMA, and any nearby trendline or ROUND-$ support.

CLICK/TAP CHART TO ZOOM
Chart services courtesy of stockcharts.com. Annotations by James Taulman.


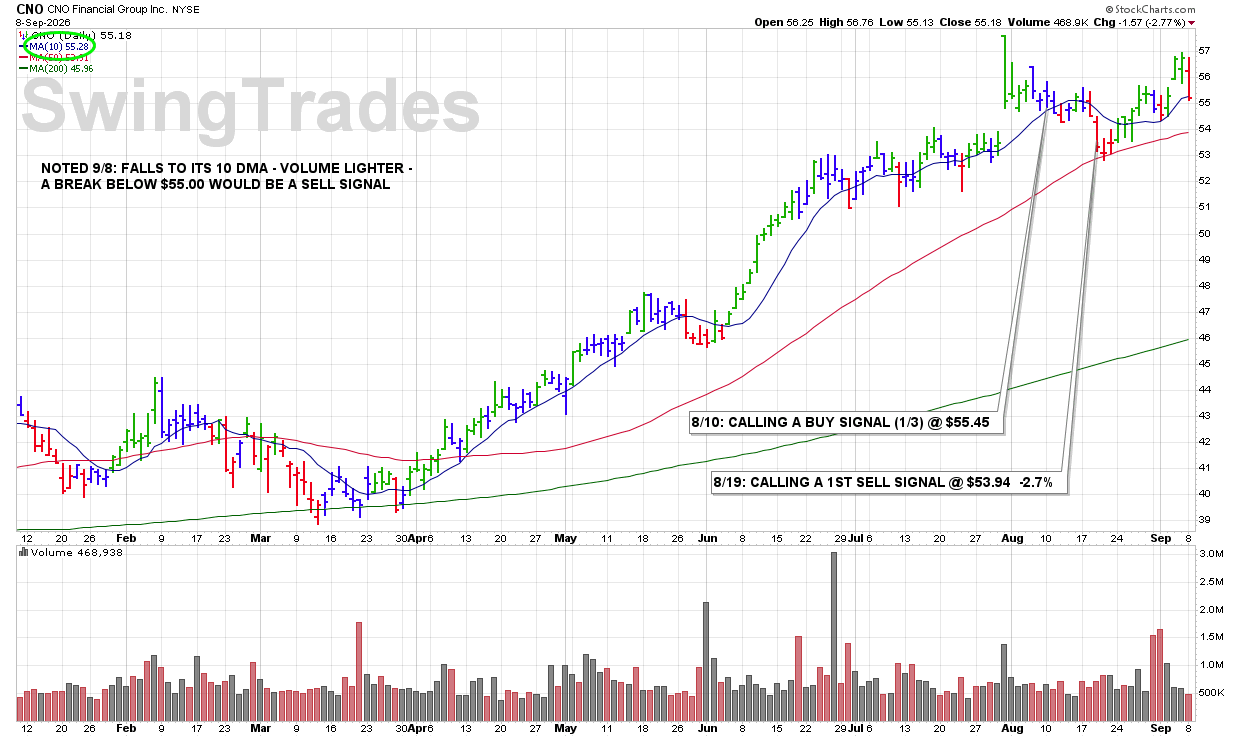
TUE 9/8: CNO – Falls to Its 10 DMA – Volume Lighter – a Break Below $55.00 Would Be a Sell Signal

Latest Chart Update: CNO

9:30 PM – We are currently reporting on this stock as an active holding and continue to monitor the stock closely for any technical SELL SIGNALS.

The focus always remains on price/volume action around key support levels, including the 10 DMA, 50 DMA, and any nearby trendline or ROUND-$ support.

CLICK/TAP CHART TO ZOOM
Chart services courtesy of stockcharts.com. Annotations by James Taulman.


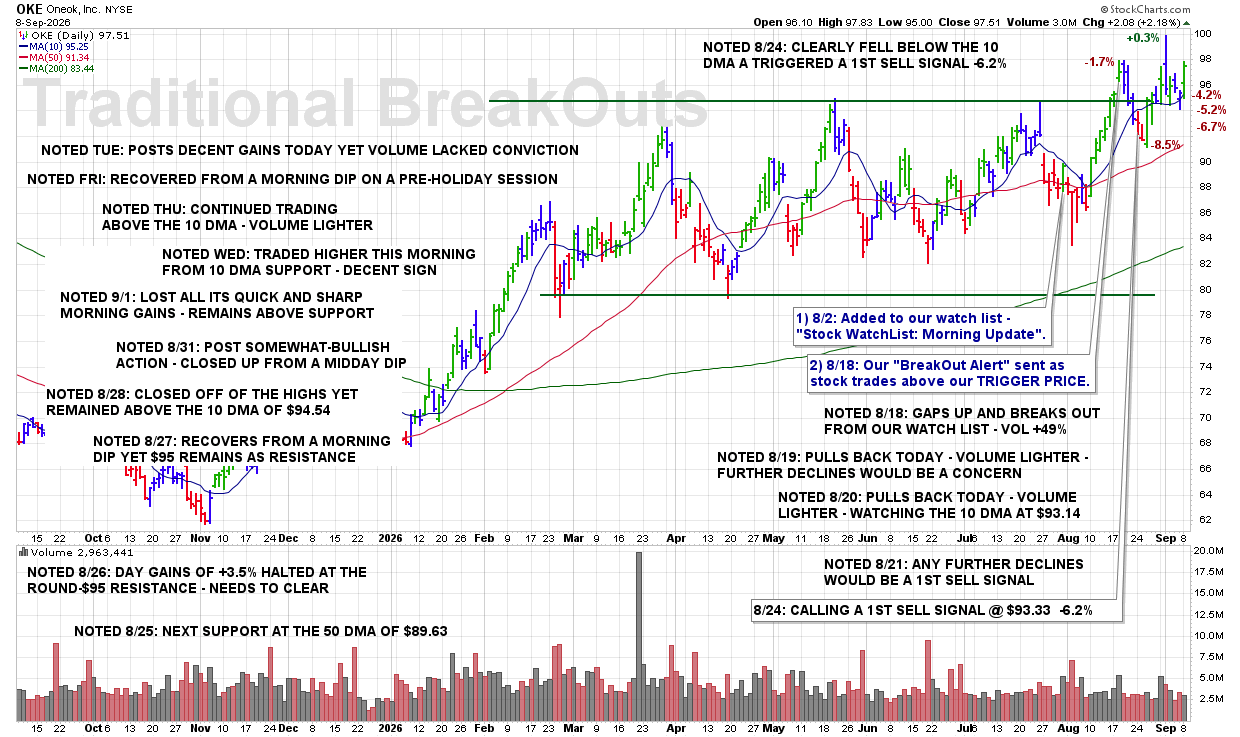
TUE 9/8: OKE – Posts Decent Gains Today Yet Volume Lacked Conviction

9:20 PM – Here is our latest chart update for this recent breakout from our Traditional BreakOuts Watch List.

CLICK/TAP CHART TO ZOOM
Chart services courtesy of stockcharts.com. Annotations by James Taulman.

We are currently reporting on this stock as an active holding and continue to monitor the stock closely for any technical SELL SIGNALS.

The focus always remains on price/volume action around key support levels, including the 10 DMA, 50 DMA, and any nearby trendline or ROUND-$ support.

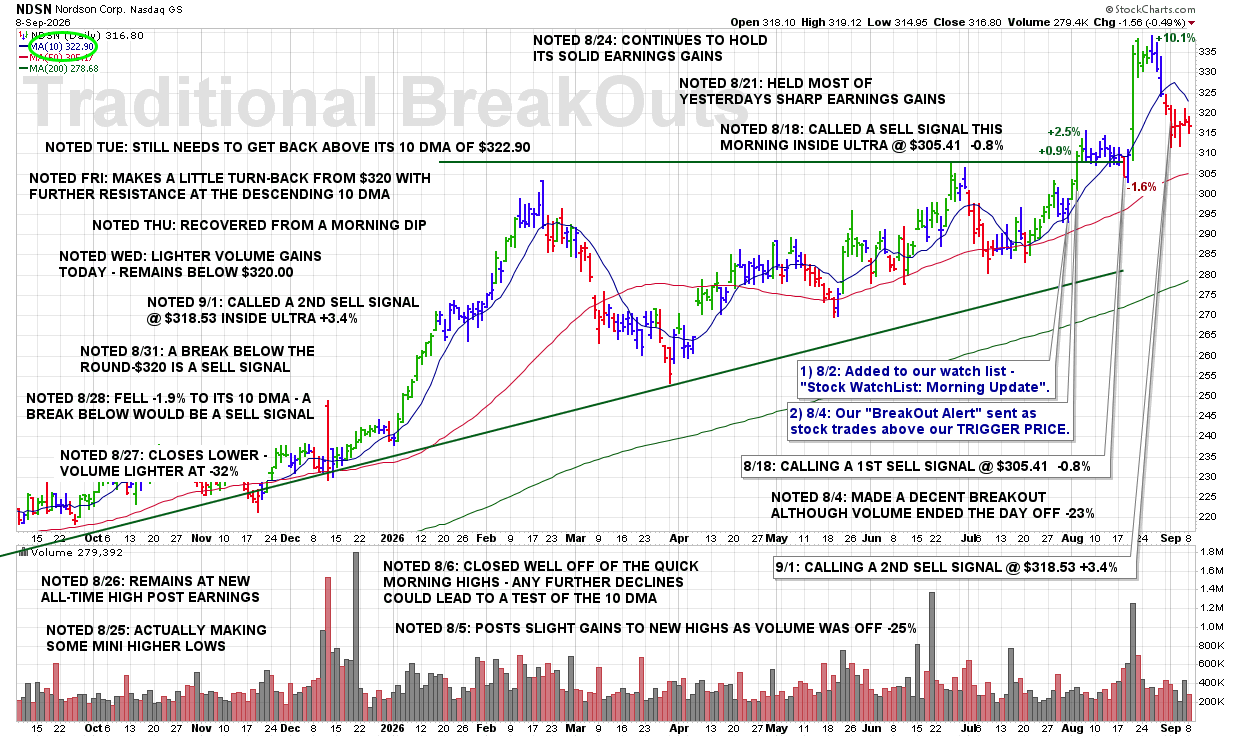
TUE 9/8: NDSN – Still Needs to Get Back Above Its 10 DMA of $322.90

9:15 PM – Here is our latest chart update for this recent breakout from our Traditional BreakOuts Watch List

CLICK/TAP CHART TO ZOOM
Chart services courtesy of stockcharts.com. Annotations by James Taulman.

We are currently reporting on this stock as an active holding and continue to monitor the stock closely for any technical SELL SIGNALS.

The focus always remains on price/volume action around key support levels, including the 10 DMA, 50 DMA, and any nearby trendline or ROUND-$ support.

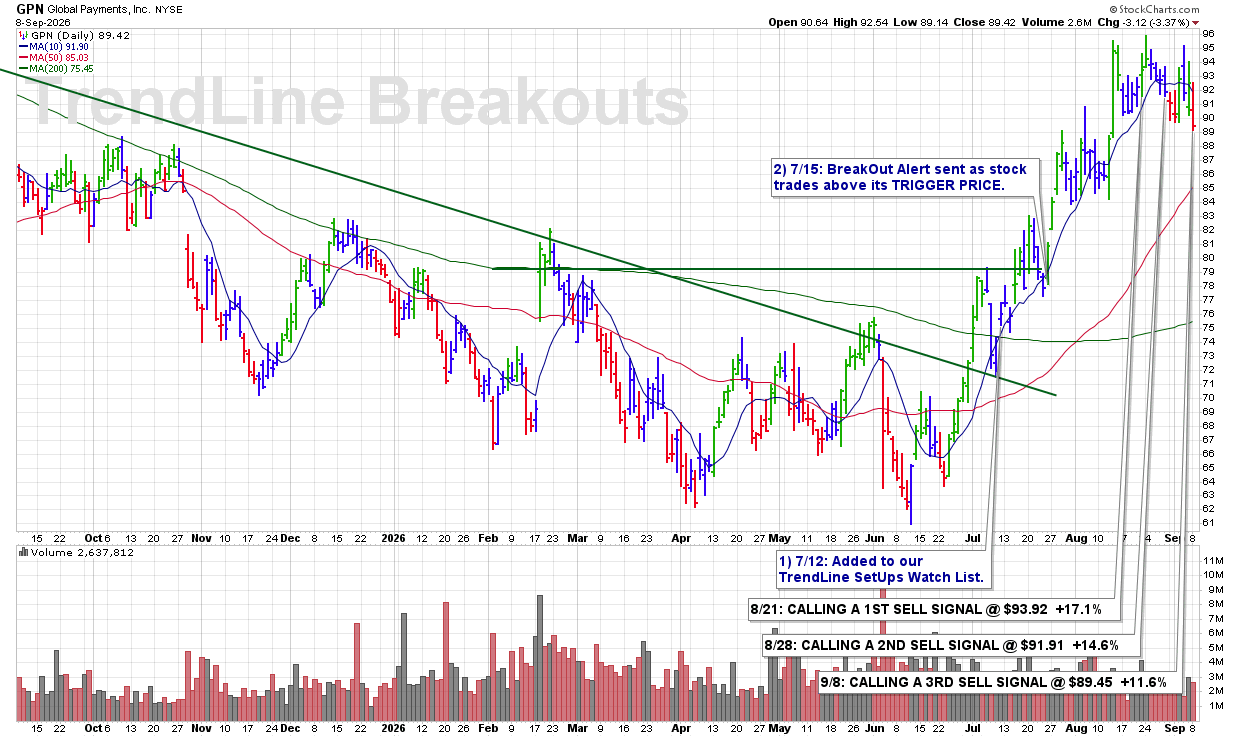
TUE 9/8: GPN — Breaks Below the ROUND-$90 and Triggers a SELL SIGNAL

9:12 PM – GPN triggered a 3RD and FINAL SELL SIGNAL this afternoon as shares fell below the previously noted ROUND-$90 support level. That additional technical violation completes our three SELL SIGNALS on the selection, with this final portion still showing a solid +11.6% gain.

ULTRA Trader’s Tip: Scale Out as Support Levels Fail

  • Round-number levels such as $90 can serve as important areas of technical support.

  • A break below previously identified support provides an objective reason to take additional profits.

  • Scaling out through multiple SELL SIGNALS allows us to systematically protect gains as technical weakness develops.

CLICK/TAP CHART TO ZOOM
Chart services courtesy of stockcharts.com. Annotations by James Taulman.

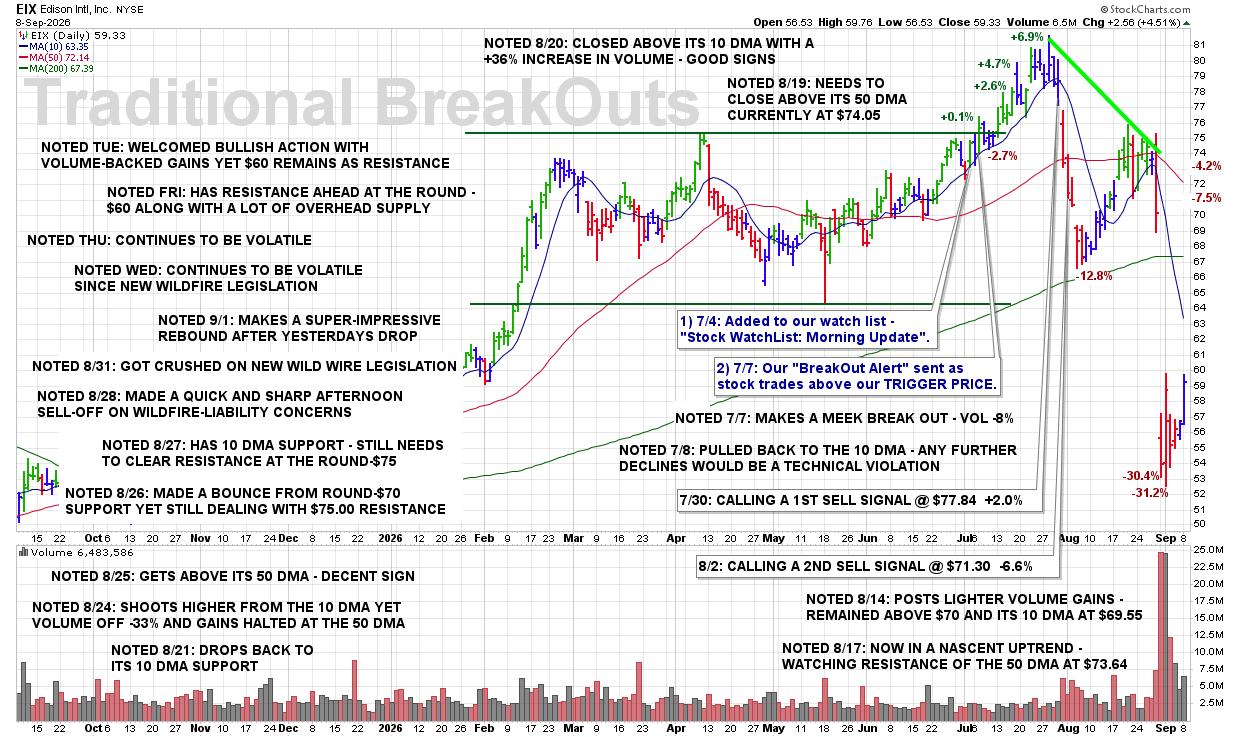
TUE 9/8: EIX – Welcomed Bullish Action With Volume-Backed Gains Yet $60 Remains as Resistance

9:10 PM – Here is our latest chart update for this recent breakout from our Traditional BreakOuts Watch List.

CLICK/TAP CHART TO ZOOM
Chart services courtesy of stockcharts.com. Annotations by James Taulman.

We are currently reporting on this stock as an active holding and continue to monitor the stock closely for any technical SELL SIGNALS.

The focus always remains on price/volume action around key support levels, including the 10 DMA, 50 DMA, and any nearby trendline or ROUND-$ support.

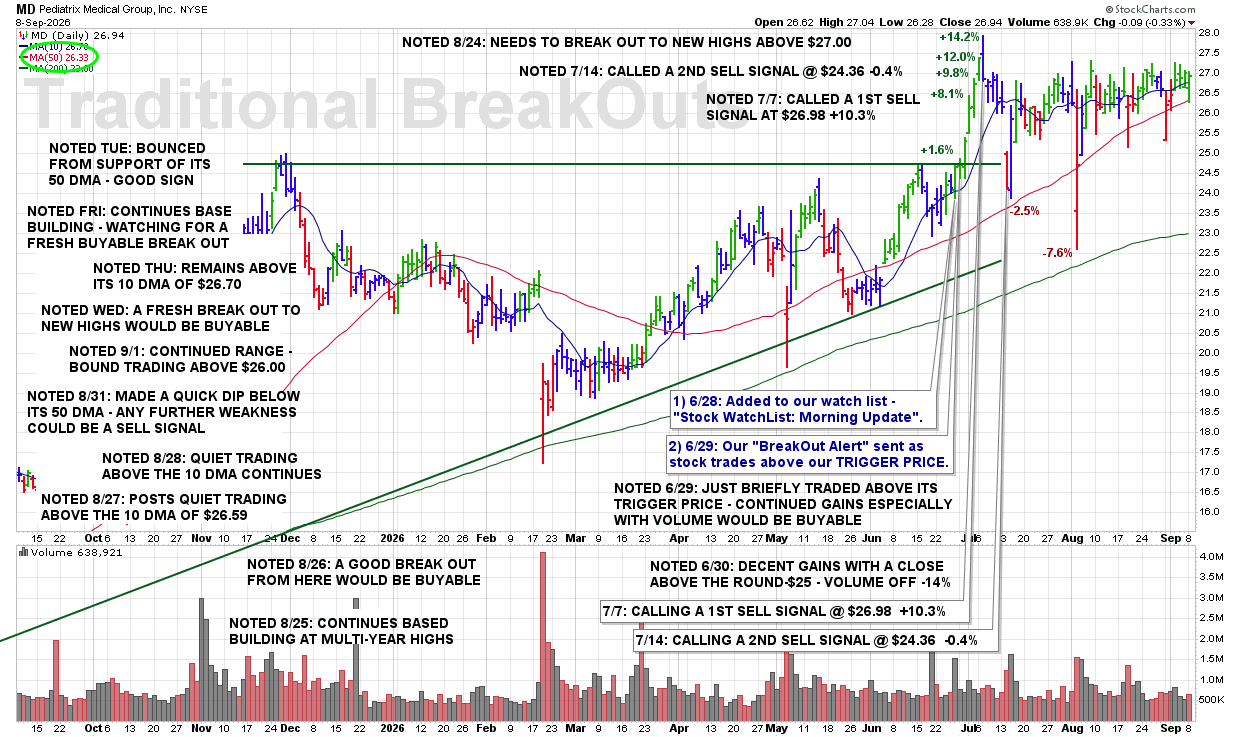
TUE 9/8: MD – Bounced From Support of Its 50 DMA – Good Sign

9:05 PM – Here is our latest chart update for this recent breakout from our Traditional BreakOuts Watch List.

CLICK/TAP CHART TO ZOOM
Chart services courtesy of stockcharts.com. Annotations by James Taulman.

We are currently reporting on this stock as an active holding and continue to monitor the stock closely for any technical SELL SIGNALS.

The focus always remains on price/volume action around key support levels, including the 10 DMA, 50 DMA, and any nearby trendline or ROUND-$ support.

TUE 9/8: OII – A Break Below the Round-$50 Would Be a Sell Signal

9:00 PM – Here is our latest chart update for this recent breakout from our Traditional BreakOuts Watch List.

CLICK/TAP CHART TO ZOOM
Chart services courtesy of stockcharts.com. Annotations by James Taulman.

We are currently reporting on this stock as an active holding and continue to monitor the stock closely for any technical SELL SIGNALS.

The focus always remains on price/volume action around key support levels, including the 10 DMA, 50 DMA, and any nearby trendline or ROUND-$ support.

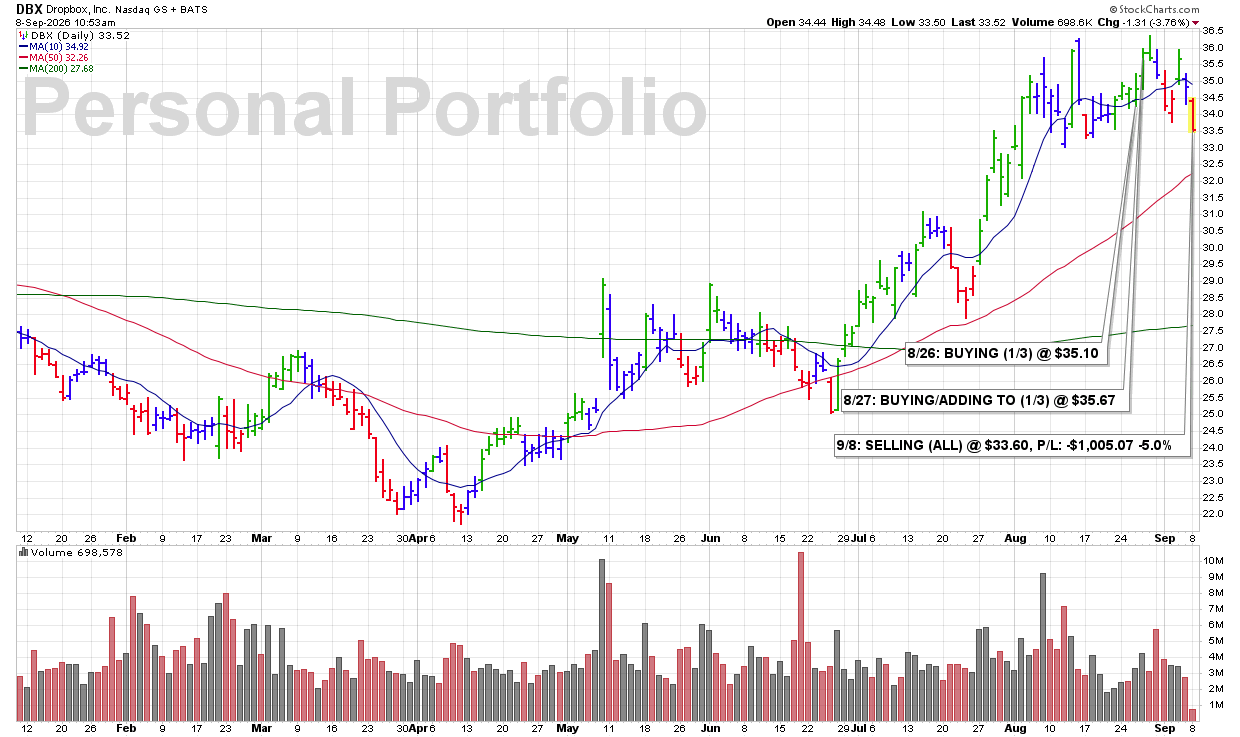
TUE 9/8: DBX – Makes a Sharp Sell-Off With Increased Volume — SELL SIGNAL

10:59 AM – Dumping all of my DBX position here this morning as shares sell off sharply and make new recent lows with an increase in volume. The combination of declining price, new lows, and increased selling volume is clear bearish technical action and enough for me to exit the position completely.

James’ Trader’s Tip: New Lows With Volume Demand Attention

  • New recent lows show that the stock’s technical condition continues to deteriorate.

  • Increased volume adds significance by showing stronger selling pressure behind the decline.

  • When price and volume turn decisively bearish together, follow the SELL rules and protect capital.

CLICK/TAP CHART TO ZOOM
Chart services courtesy of stockcharts.com. Annotations by James Taulman.

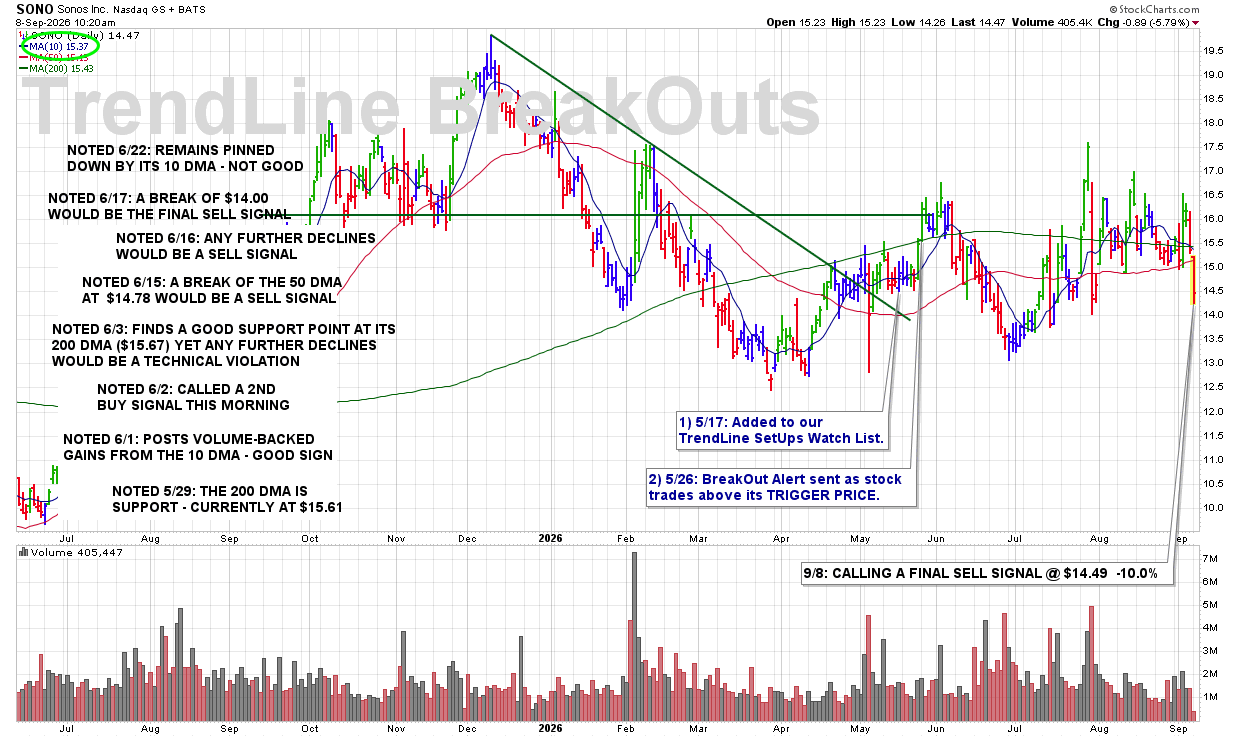
TUE 9/8: SONO – Slices Through Its 50 DMA With Huge Volume — SELL SIGNAL

10:30 AM – Calling a FINAL SELL SIGNAL here this morning as shares sell off sharply and break decisively below the 50 DMA while volume is currently running 163% above average. That combination of a major support violation and extremely heavy selling volume is a significant bearish technical development and completes the SELL process on this selection.

ULTRA Trader’s Tip: Heavy Volume Makes a Major Support Break More Significant

  • A decisive break below the 50 DMA is a major technical violation.

  • Volume running 163% above average shows that the selling pressure is unusually strong.

  • When major support fails on extremely heavy volume, respect the signal and move on.

CLICK/TAP CHART TO ZOOM
Chart services courtesy of stockcharts.com. Annotations by James Taulman.

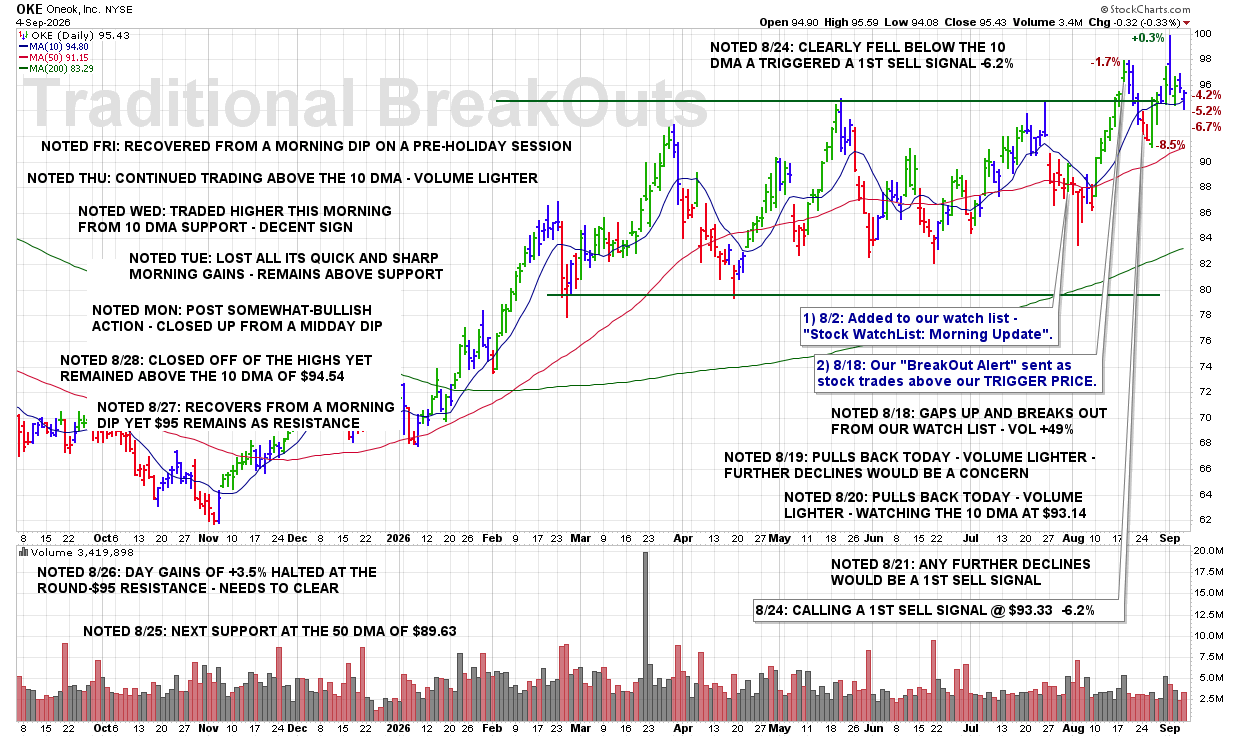
FRI 9/4: OKE – Recovered From a Morning Dip on a Pre-Holiday Session

8:25 PM – Here is our latest chart update for this recent breakout from our Traditional BreakOuts Watch List.

CLICK/TAP CHART TO ZOOM
Chart services courtesy of stockcharts.com. Annotations by James Taulman.

We are currently reporting on this stock as an active holding and continue to monitor the stock closely for any technical SELL SIGNALS.

The focus always remains on price/volume action around key support levels, including the 10 DMA, 50 DMA, and any nearby trendline or ROUND-$ support.

FRI 9/4: NDSN – Makes a Little Turn-Back From $320 With Further Resistance at the Descending 10 DMA

8:20 PM – Here is our latest chart update for this recent breakout from our Traditional BreakOuts Watch List

CLICK/TAP CHART TO ZOOM
Chart services courtesy of stockcharts.com. Annotations by James Taulman.

We are currently reporting on this stock as an active holding and continue to monitor the stock closely for any technical SELL SIGNALS.

The focus always remains on price/volume action around key support levels, including the 10 DMA, 50 DMA, and any nearby trendline or ROUND-$ support.

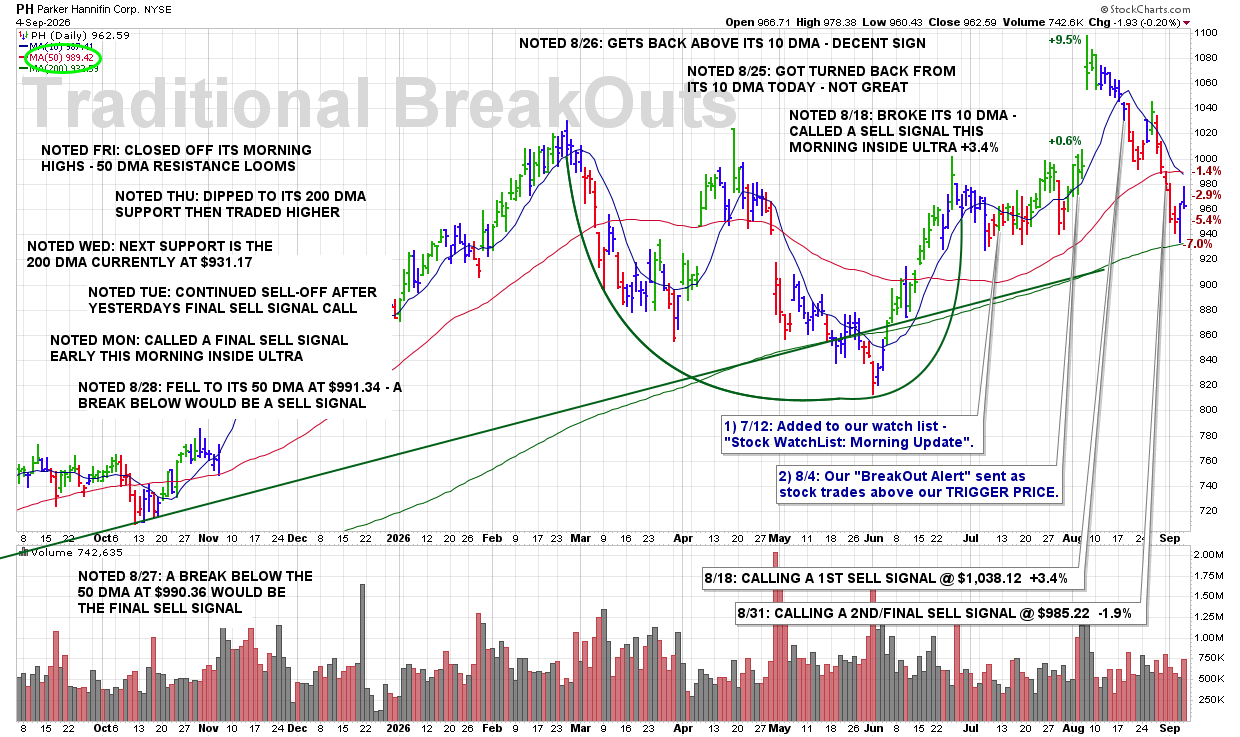
FRI 9/4: PH – Closed Off Its Morning Highs – 50 DMA Resistance Looms

8:15 PM – Here is our latest chart update for this recent breakout from our Traditional BreakOuts Watch List

CLICK/TAP CHART TO ZOOM
Chart services courtesy of stockcharts.com. Annotations by James Taulman.

We are currently reporting on this stock as an active holding and continue to monitor the stock closely for any technical SELL SIGNALS.

The focus always remains on price/volume action around key support levels, including the 10 DMA, 50 DMA, and any nearby trendline or ROUND-$ support.

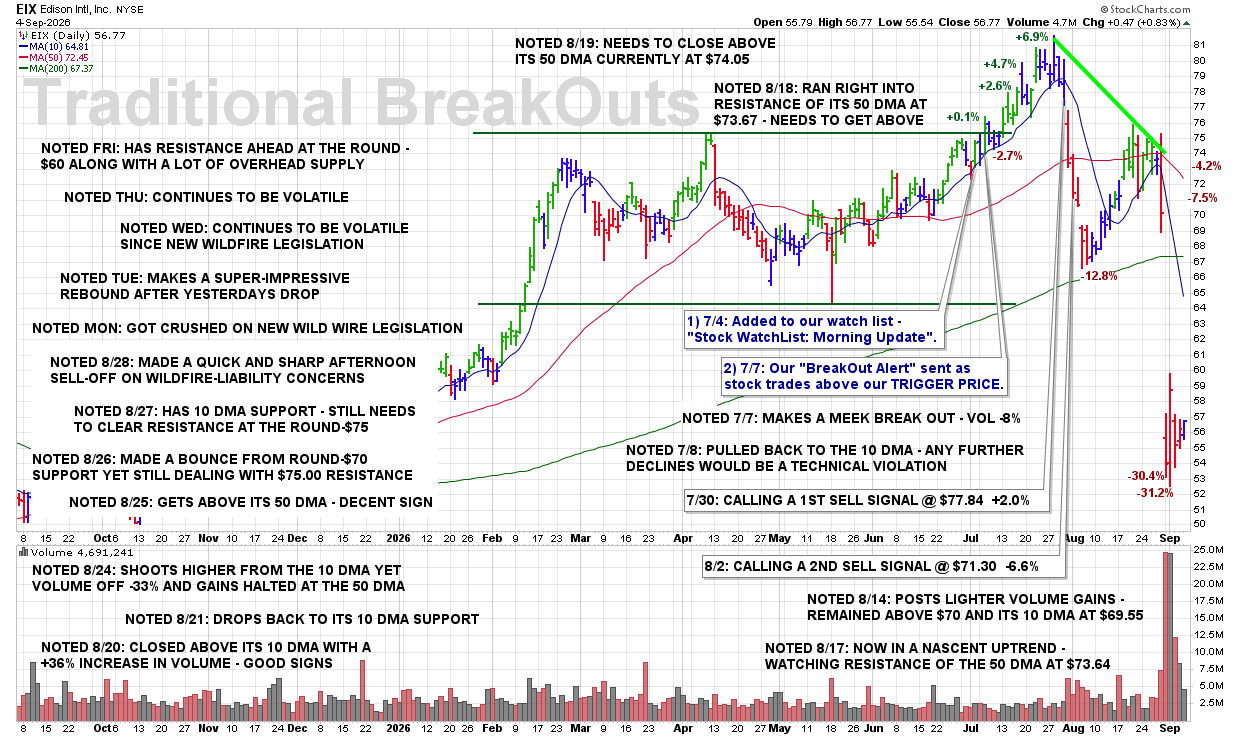
FRI 9/4: EIX – Has Resistance Ahead at the Round-$60 Along With a Lot of Overhead Supply

8:10 PM – Here is our latest chart update for this recent breakout from our Traditional BreakOuts Watch List.

CLICK/TAP CHART TO ZOOM
Chart services courtesy of stockcharts.com. Annotations by James Taulman.

We are currently reporting on this stock as an active holding and continue to monitor the stock closely for any technical SELL SIGNALS.

The focus always remains on price/volume action around key support levels, including the 10 DMA, 50 DMA, and any nearby trendline or ROUND-$ support.

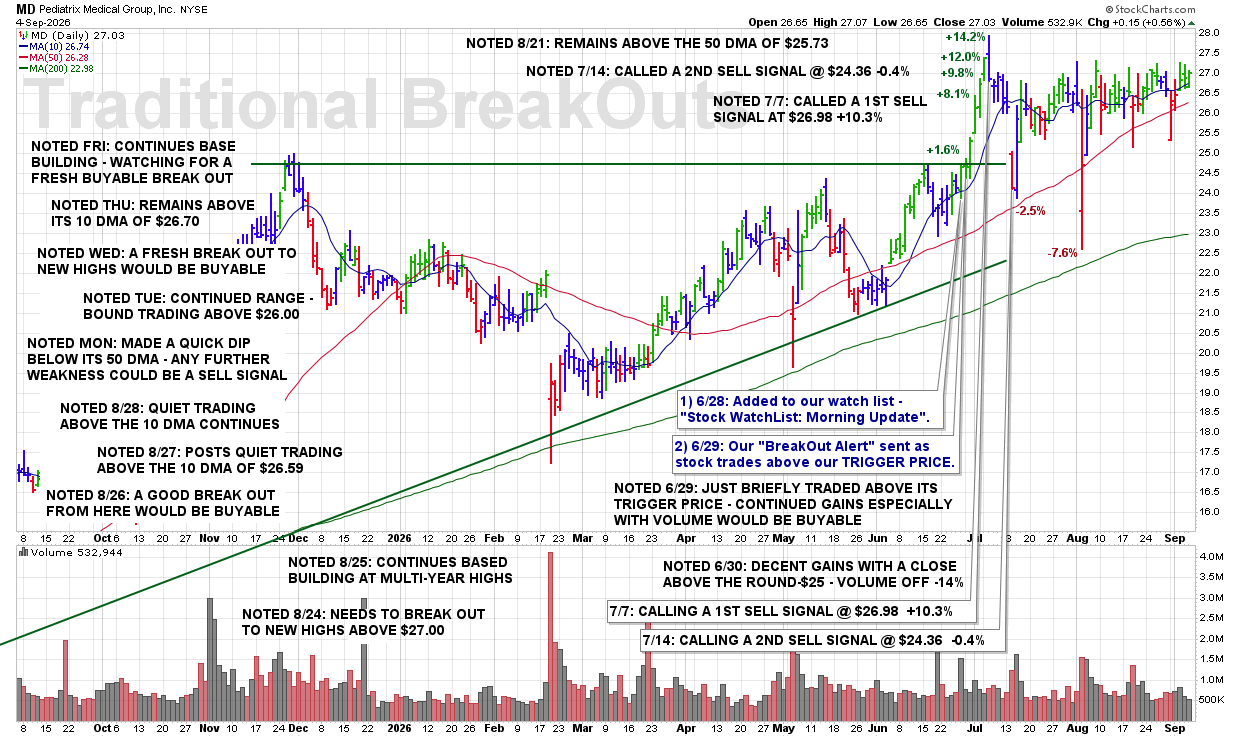
FRI 9/4: MD – Continues Base Building – Watching for a Fresh Buyable Break Out

8:05 PM – Here is our latest chart update for this recent breakout from our Traditional BreakOuts Watch List.

CLICK/TAP CHART TO ZOOM
Chart services courtesy of stockcharts.com. Annotations by James Taulman.

We are currently reporting on this stock as an active holding and continue to monitor the stock closely for any technical SELL SIGNALS.

The focus always remains on price/volume action around key support levels, including the 10 DMA, 50 DMA, and any nearby trendline or ROUND-$ support.

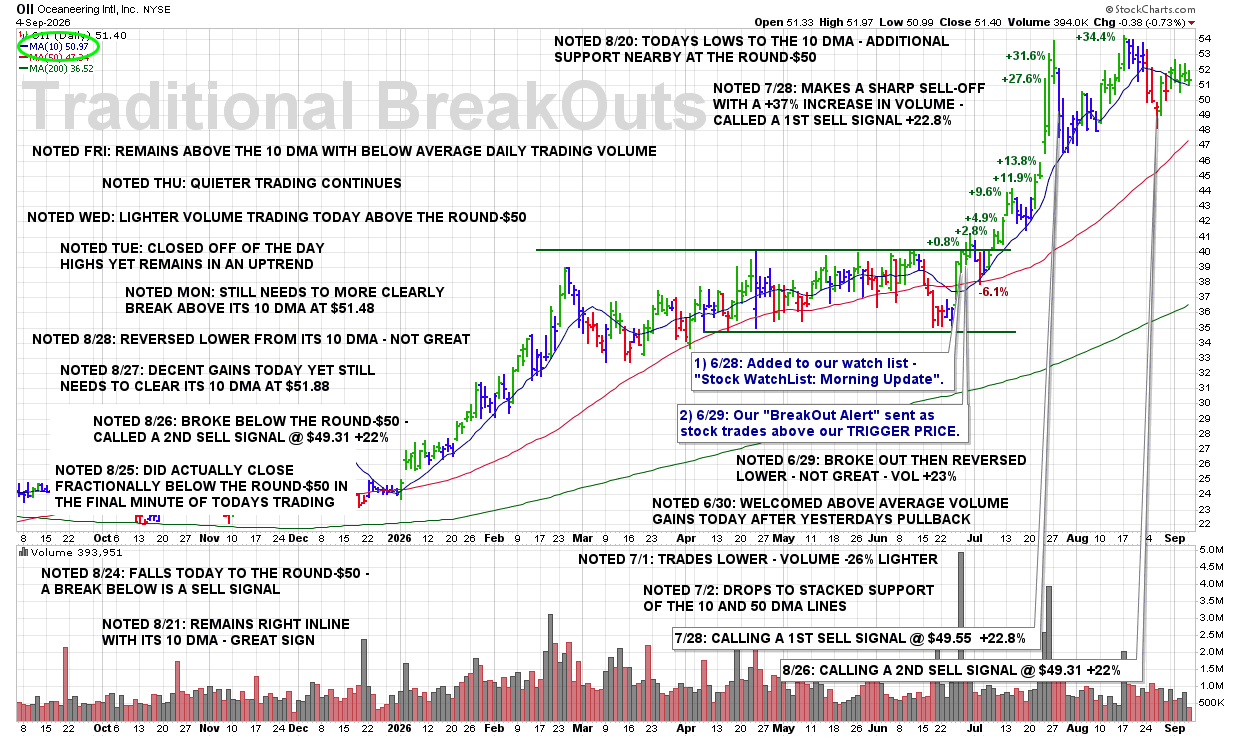
FRI 9/4: OII – Remains Above the 10 DMA With Below Average Daily Trading Volume

8:00 PM – Here is our latest chart update for this recent breakout from our Traditional BreakOuts Watch List.

CLICK/TAP CHART TO ZOOM
Chart services courtesy of stockcharts.com. Annotations by James Taulman.

We are currently reporting on this stock as an active holding and continue to monitor the stock closely for any technical SELL SIGNALS.

The focus always remains on price/volume action around key support levels, including the 10 DMA, 50 DMA, and any nearby trendline or ROUND-$ support.

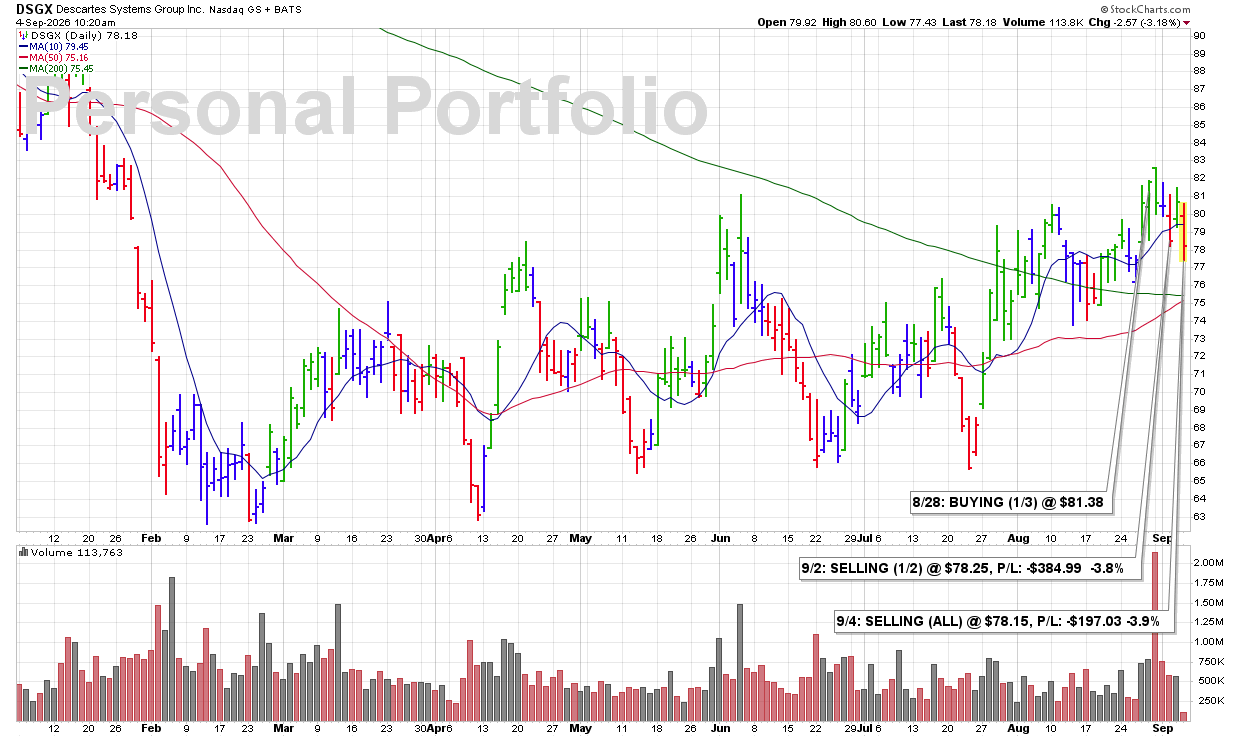
FRI 9/4: DSGX — Breaks Its 10 DMA With Volume — SELL SIGNAL

10:10 AM – Selling the last of my DSGX position here as shares break below the 10 DMA with a sharp increase in volume. The combination of a key support violation and heavy selling volume is a clear SELL SIGNAL under our rules, so I’m exiting the position completely.

James’ Trader’s Tip: Volume Confirms the Breakdown

  • A break below the 10 DMA is an important technical violation.

  • A sharp increase in volume makes the weakness more meaningful by confirming stronger selling pressure.

  • When price and volume turn bearish together, follow the rules and protect capital.

CLICK/TAP CHART TO ZOOM
Chart services courtesy of stockcharts.com. Annotations by James Taulman.

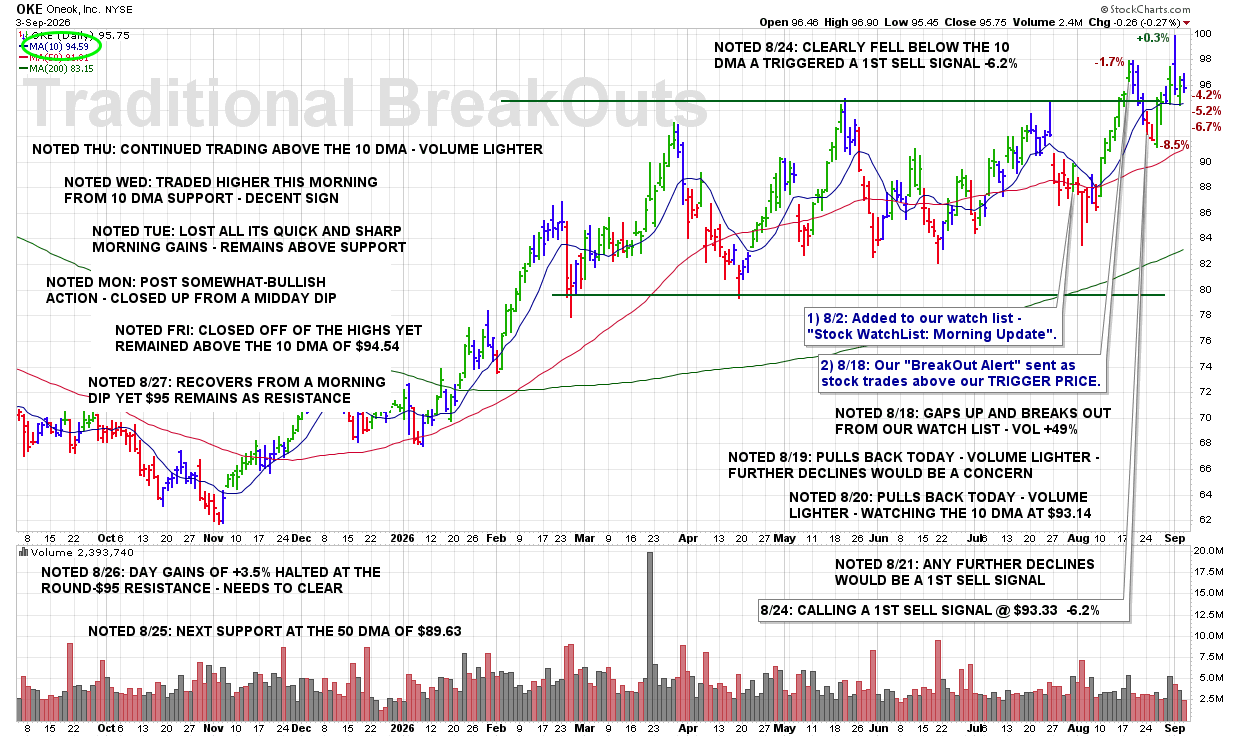
THU 9/3: OKE – Continued Trading Above the 10 DMA – Volume Lighter

8:55 PM – Here is our latest chart update for this recent breakout from our Traditional BreakOuts Watch List.

CLICK/TAP CHART TO ZOOM
Chart services courtesy of stockcharts.com. Annotations by James Taulman.

We are currently reporting on this stock as an active holding and continue to monitor the stock closely for any technical SELL SIGNALS.

The focus always remains on price/volume action around key support levels, including the 10 DMA, 50 DMA, and any nearby trendline or ROUND-$ support.

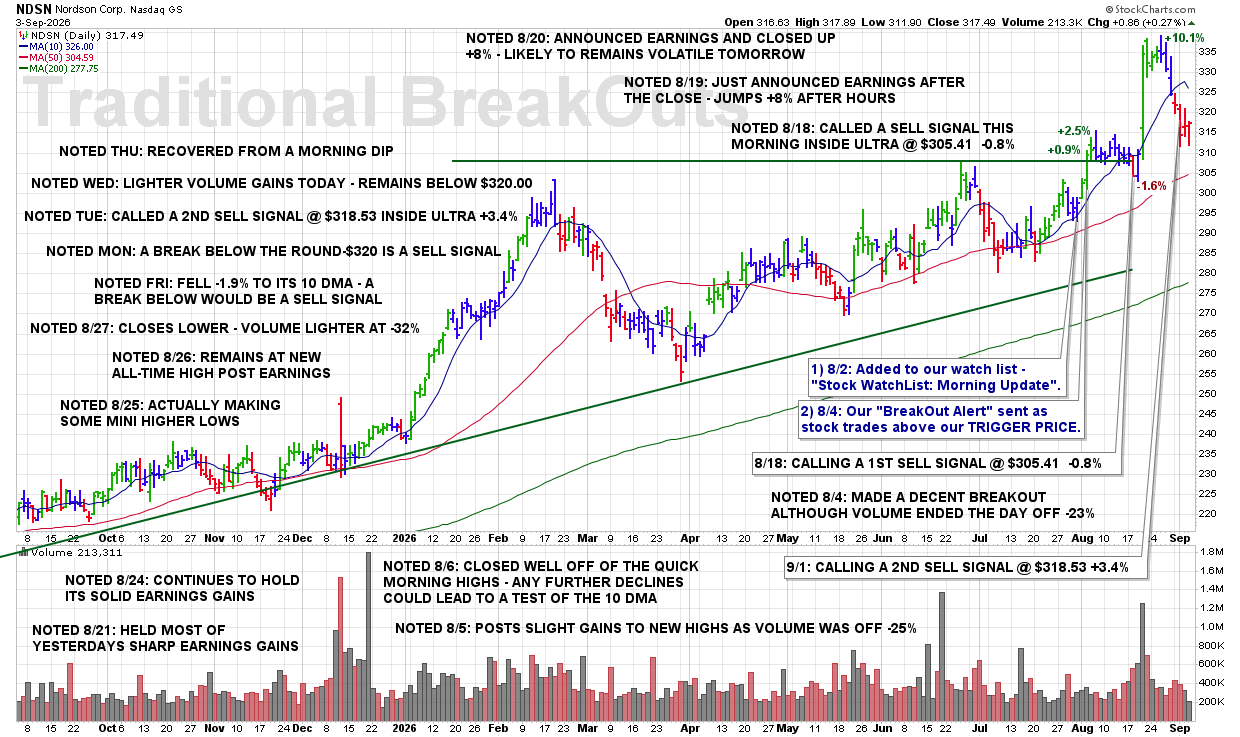
THU 9/3: NDSN – Recovered From a Morning Dip

8:50 PM – Here is our latest chart update for this recent breakout from our Traditional BreakOuts Watch List

CLICK/TAP CHART TO ZOOM
Chart services courtesy of stockcharts.com. Annotations by James Taulman.

We are currently reporting on this stock as an active holding and continue to monitor the stock closely for any technical SELL SIGNALS.

The focus always remains on price/volume action around key support levels, including the 10 DMA, 50 DMA, and any nearby trendline or ROUND-$ support.

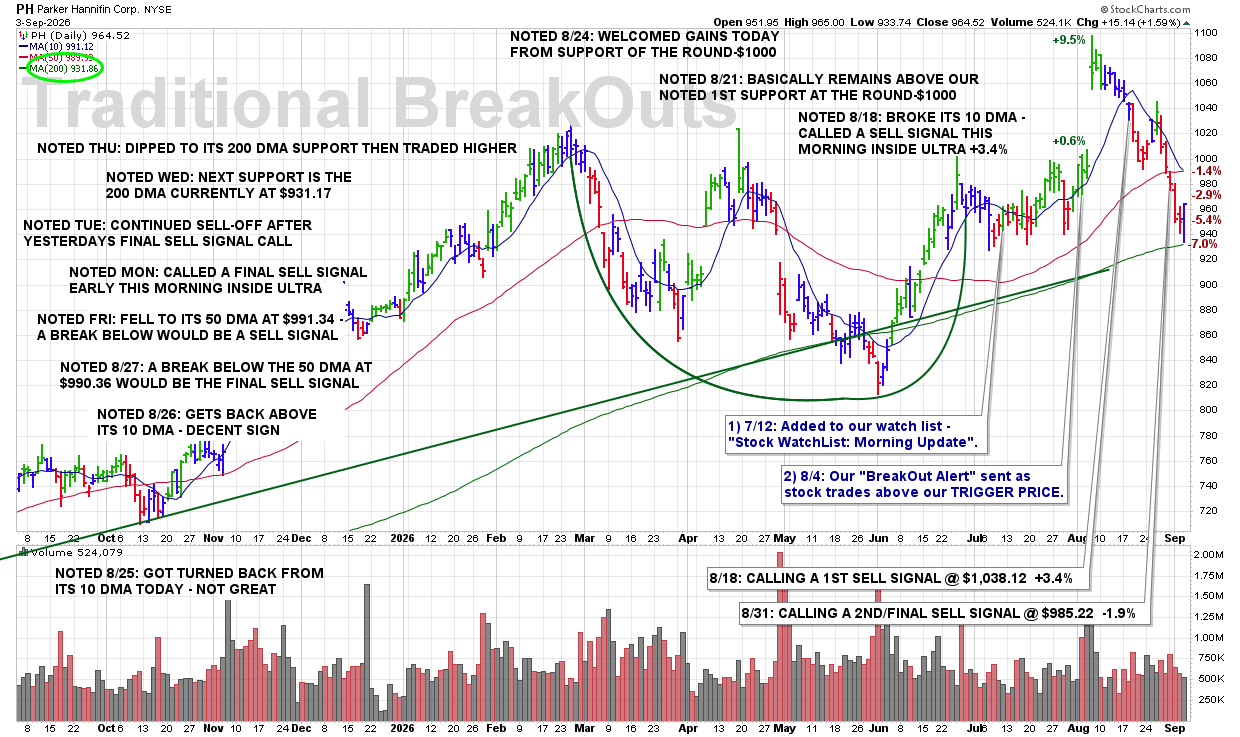
THU 9/3: PH – Dipped to Its 200 DMA Support Then Traded Higher

8:45 PM – Here is our latest chart update for this recent breakout from our Traditional BreakOuts Watch List

CLICK/TAP CHART TO ZOOM
Chart services courtesy of stockcharts.com. Annotations by James Taulman.

We are currently reporting on this stock as an active holding and continue to monitor the stock closely for any technical SELL SIGNALS.

The focus always remains on price/volume action around key support levels, including the 10 DMA, 50 DMA, and any nearby trendline or ROUND-$ support.

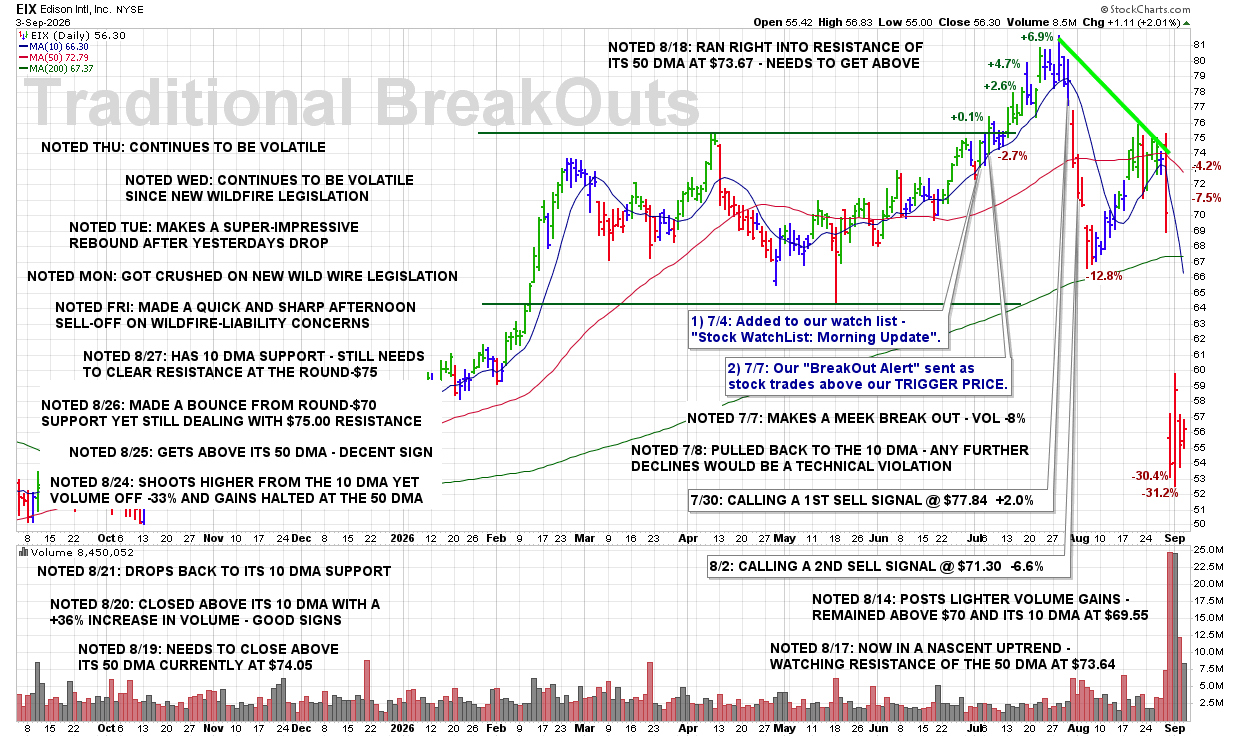
THU 9/3: EIX – Continues to Be Volatile

8:40 PM – Here is our latest chart update for this recent breakout from our Traditional BreakOuts Watch List.

CLICK/TAP CHART TO ZOOM
Chart services courtesy of stockcharts.com. Annotations by James Taulman.

We are currently reporting on this stock as an active holding and continue to monitor the stock closely for any technical SELL SIGNALS.

The focus always remains on price/volume action around key support levels, including the 10 DMA, 50 DMA, and any nearby trendline or ROUND-$ support.

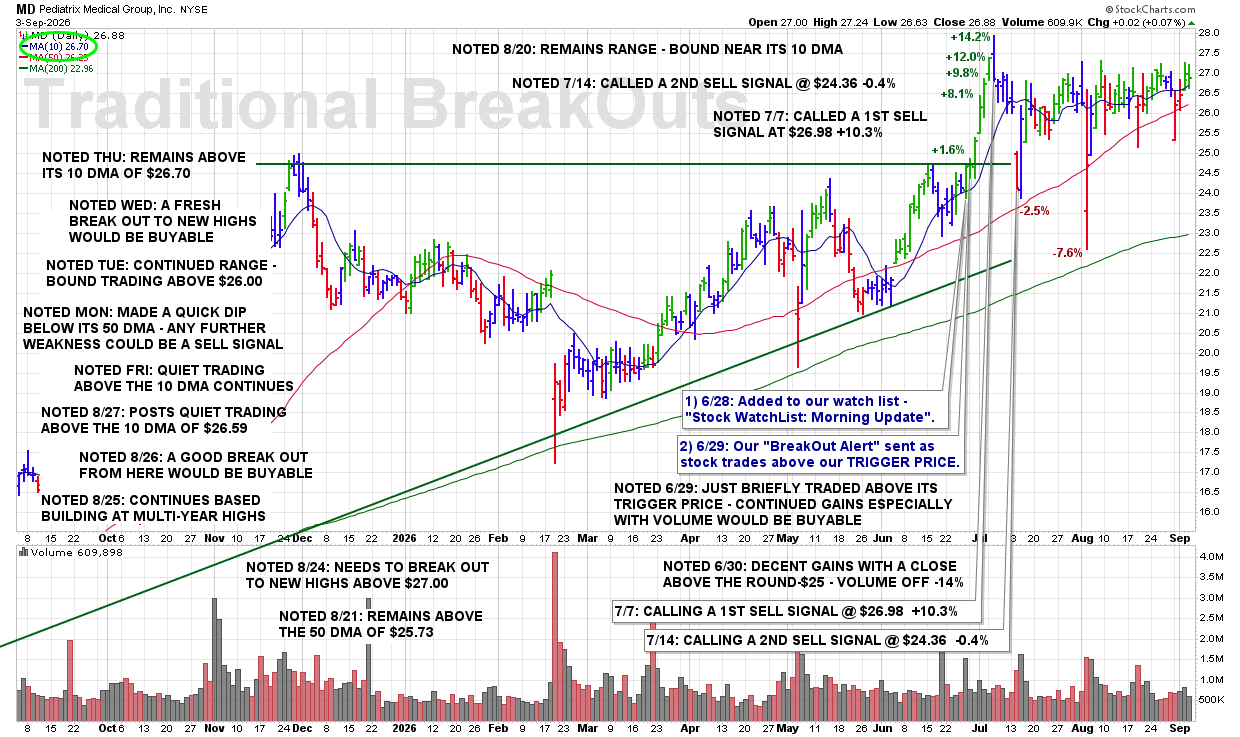
THU 9/3: MD – Remains Above Its 10 DMA of $26.70

8:35 PM – Here is our latest chart update for this recent breakout from our Traditional BreakOuts Watch List.

CLICK/TAP CHART TO ZOOM
Chart services courtesy of stockcharts.com. Annotations by James Taulman.

We are currently reporting on this stock as an active holding and continue to monitor the stock closely for any technical SELL SIGNALS.

The focus always remains on price/volume action around key support levels, including the 10 DMA, 50 DMA, and any nearby trendline or ROUND-$ support.

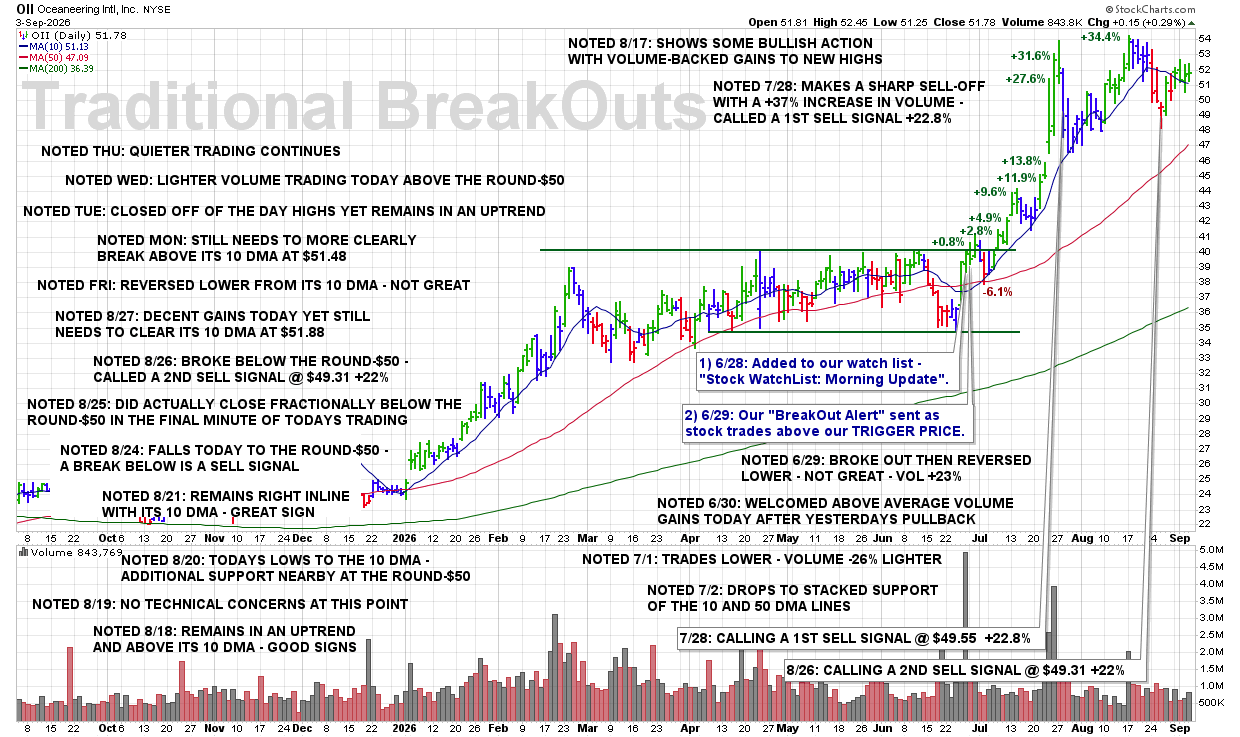
THU 9/3: OII – Quieter Trading Continues

8:30 PM – Here is our latest chart update for this recent breakout from our Traditional BreakOuts Watch List.

CLICK/TAP CHART TO ZOOM
Chart services courtesy of stockcharts.com. Annotations by James Taulman.

We are currently reporting on this stock as an active holding and continue to monitor the stock closely for any technical SELL SIGNALS.

The focus always remains on price/volume action around key support levels, including the 10 DMA, 50 DMA, and any nearby trendline or ROUND-$ support.

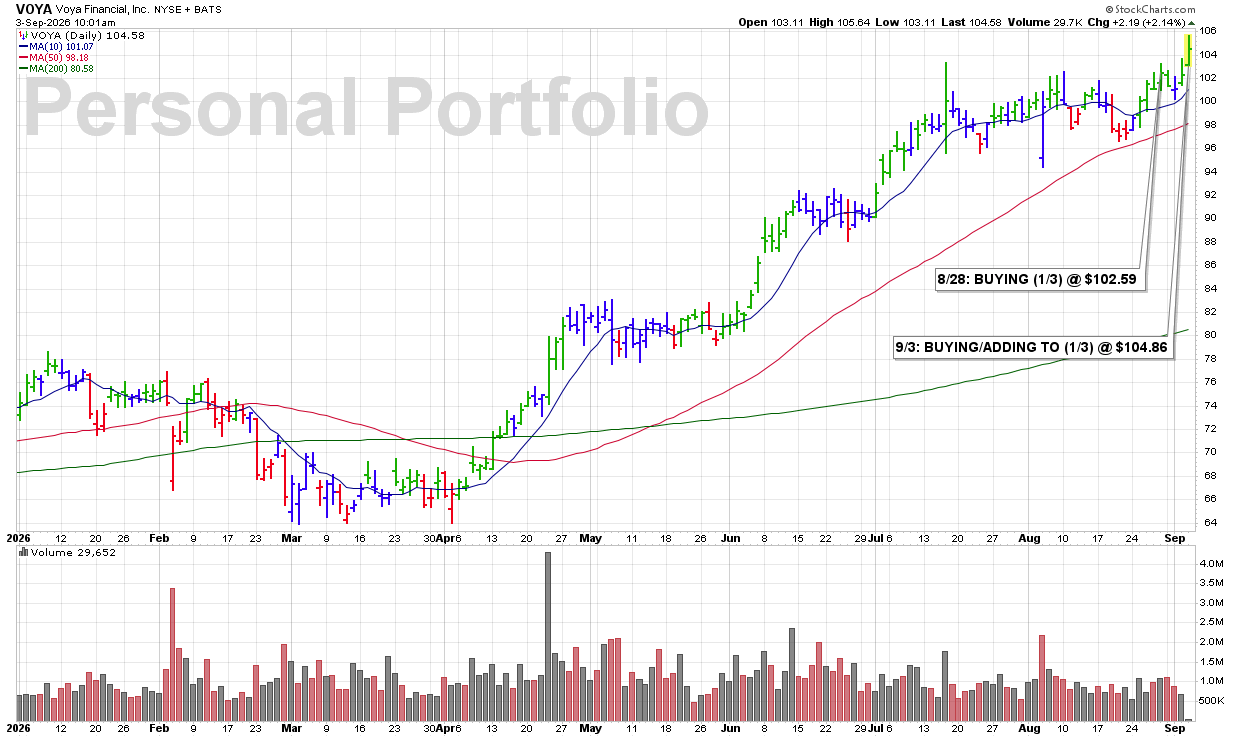
THU 9/3: VOYA – Adding to My Position as the Stock is Breaking Out to New Highs

9:53 AM – Adding another 1/3 to my VOYA position here as shares break out to new highs with what is, at this time, an increase in volume. The combination of new-high price strength and increased volume is bullish technical action and gives me enough confirmation to add to the position.

I now have 2/3 of what I consider a full position in VOYA.

ULTRA Trader’s Tip: Add as Strength Is Confirmed

  • A breakout to new highs shows that buyers are successfully pushing through previous resistance.

  • Increased volume adds conviction and helps confirm the strength of the move.

  • Scaling in by thirds allows the stock to prove itself before committing a full position.

CLICK/TAP CHART TO ZOOM
Chart services courtesy of stockcharts.com. Annotations by James Taulman.

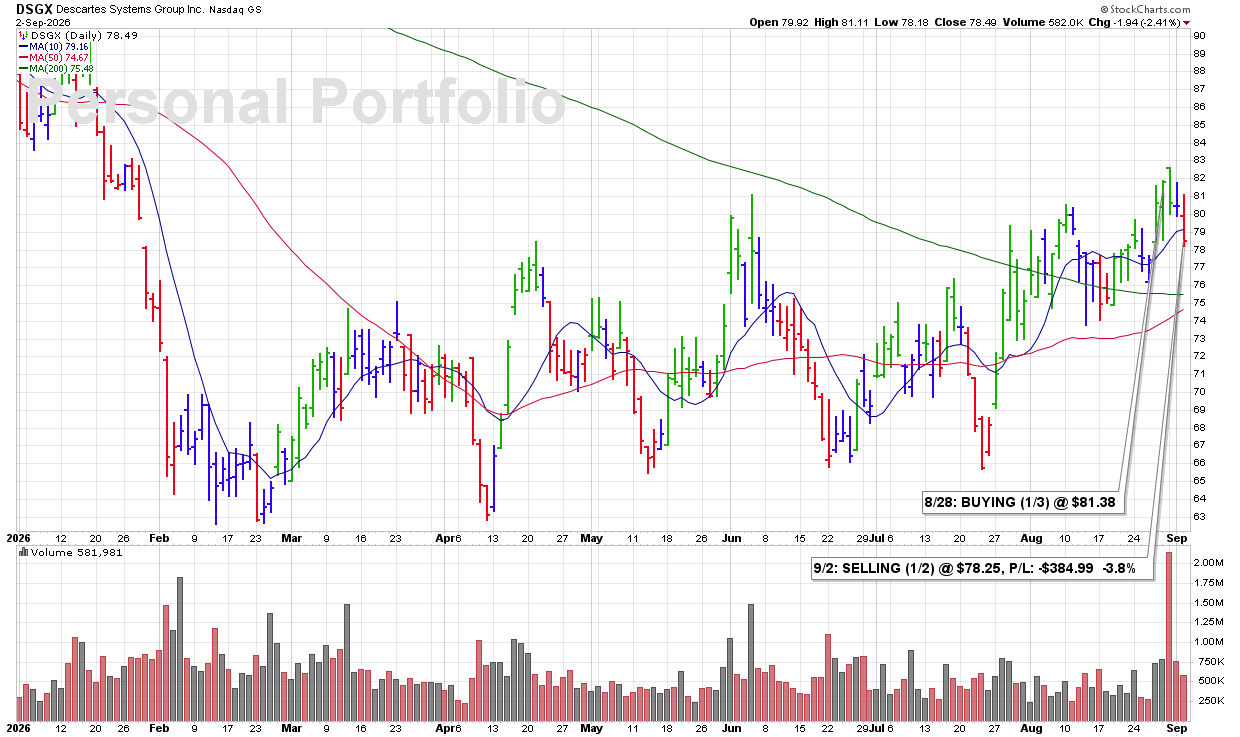
WED 9/2: DSGX — Following the Rules and Selling a Portion on Technical Weakness

10:56 PM – As much as I hate to sell this quickly, I couldn’t ignore today’s technical weakness in DSGX. Three bearish signs stood out: (1) shares were down about 2.4%, (2) price was dropping below the 10 DMA, and (3) volume was running above average.

That combination is enough technical weakness for me to follow the rules and reduce the position. I sold half at the close for a $192.45 loss, or -3.8%.

CORRECTION: The loss was incorrectly reported in the SMS as -$384.99. The correct realized loss on the half position sold was -$192.45.


James’ Trader’s Tip: Follow the Rules Even When You Don’t Want To

  • A break below the 10 DMA is an important technical violation under our rules.

  • Weak price action accompanied by above-average volume makes the deterioration more significant.

  • Selling a portion allows us to reduce risk while still giving the remaining position an opportunity to recover.


CLICK/TAP CHART TO ZOOM
Chart services courtesy of stockcharts.com. Annotations by James Taulman.

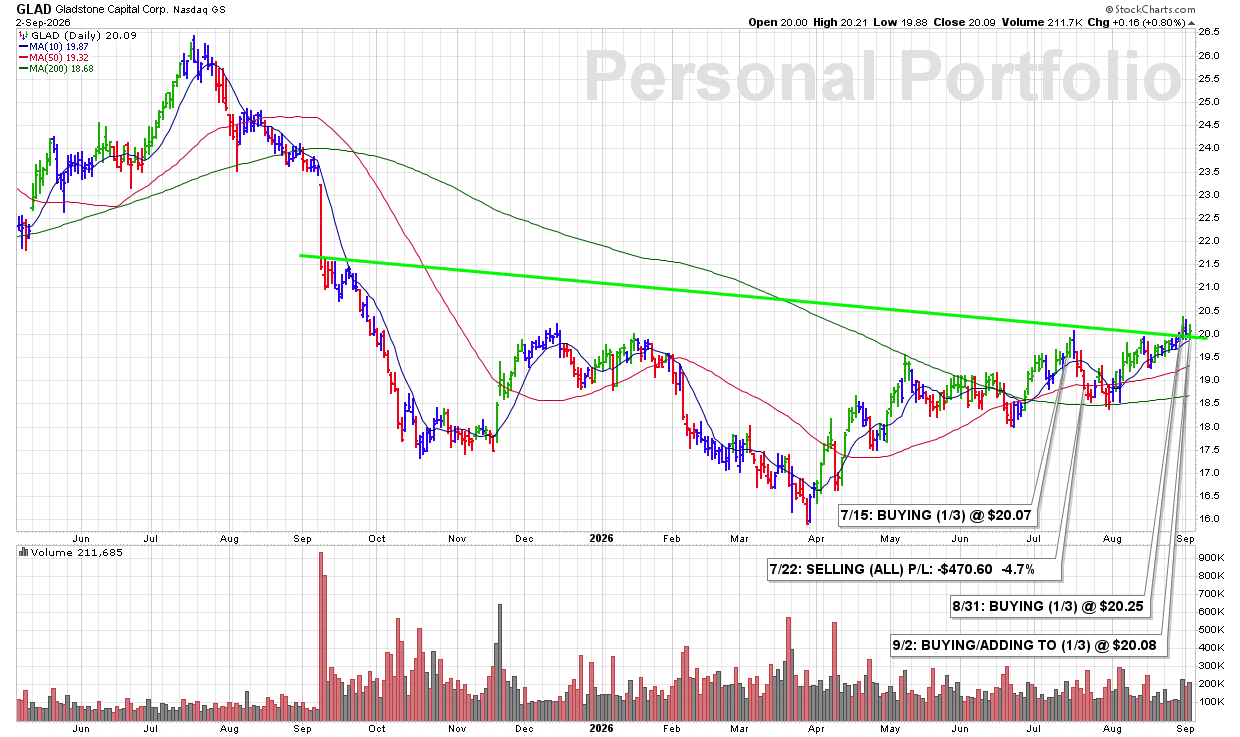
WED 9/2: GLAD — Gains From the 10 DMA With Volume — A BUY SIGNAL

9:58 PM – I added another 1/3 position to my GLAD holding today as shares traded higher from the 10 DMA with an increase in volume. This is a very typical technical scenario I look for when adding to an existing position: support at the 10 DMA followed by an advance on increased volume.

I now have 2/3 of what I consider a full position in GLAD, in a market where stocks have generally lacked much follow-through.

The cost basis will be adjusted inside ULTRA for tracking purposes.


James’ Trader’s Tip: Add From Proven Support

  • An advance from the 10 DMA with increased volume is one of the most common bullish technical signals I look for.

  • Scaling in allows the stock to prove itself before committing a full position.

  • When stocks are showing limited follow-through overall, maintaining some restraint with position size helps manage risk.


CLICK/TAP CHART TO ZOOM
Chart services courtesy of stockcharts.com. Annotations by James Taulman.

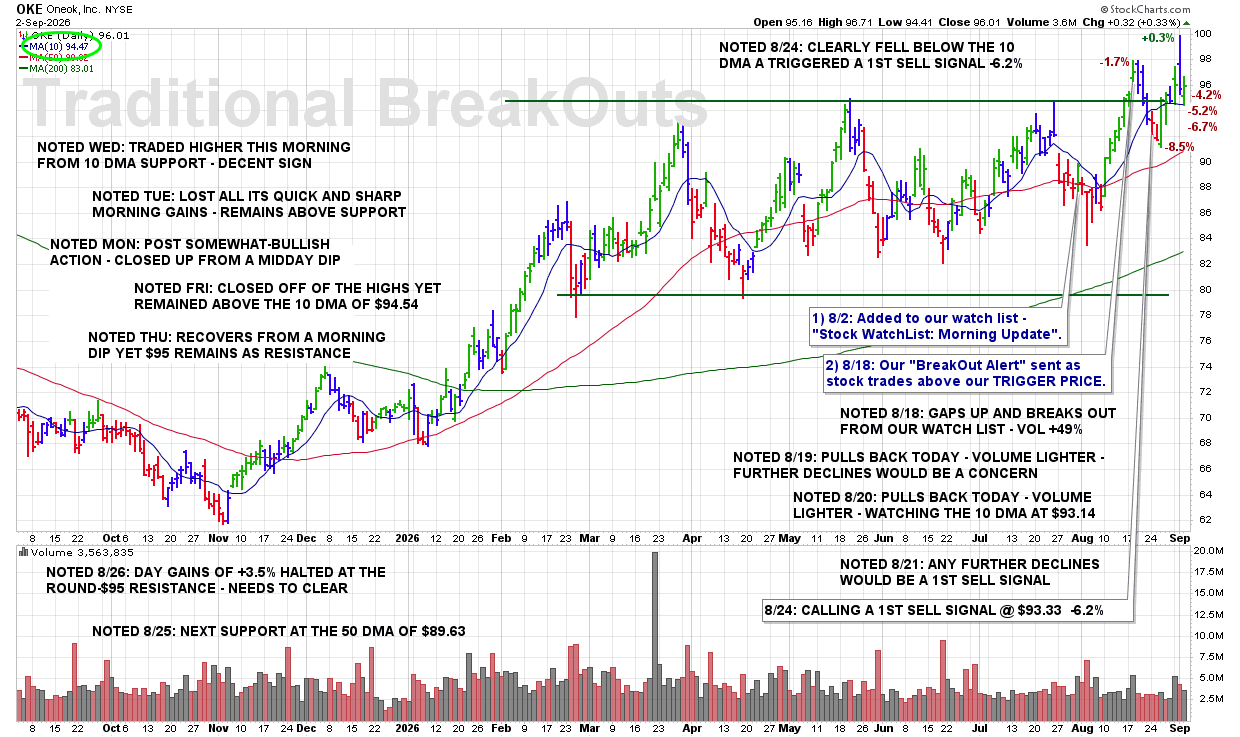
WED 9/2: OKE – Traded Higher This Morning From 10 DMA Support – Decent Sign

8:55 PM – Here is our latest chart update for this recent breakout from our Traditional BreakOuts Watch List.

CLICK/TAP CHART TO ZOOM
Chart services courtesy of stockcharts.com. Annotations by James Taulman.

We are currently reporting on this stock as an active holding and continue to monitor the stock closely for any technical SELL SIGNALS.

The focus always remains on price/volume action around key support levels, including the 10 DMA, 50 DMA, and any nearby trendline or ROUND-$ support.

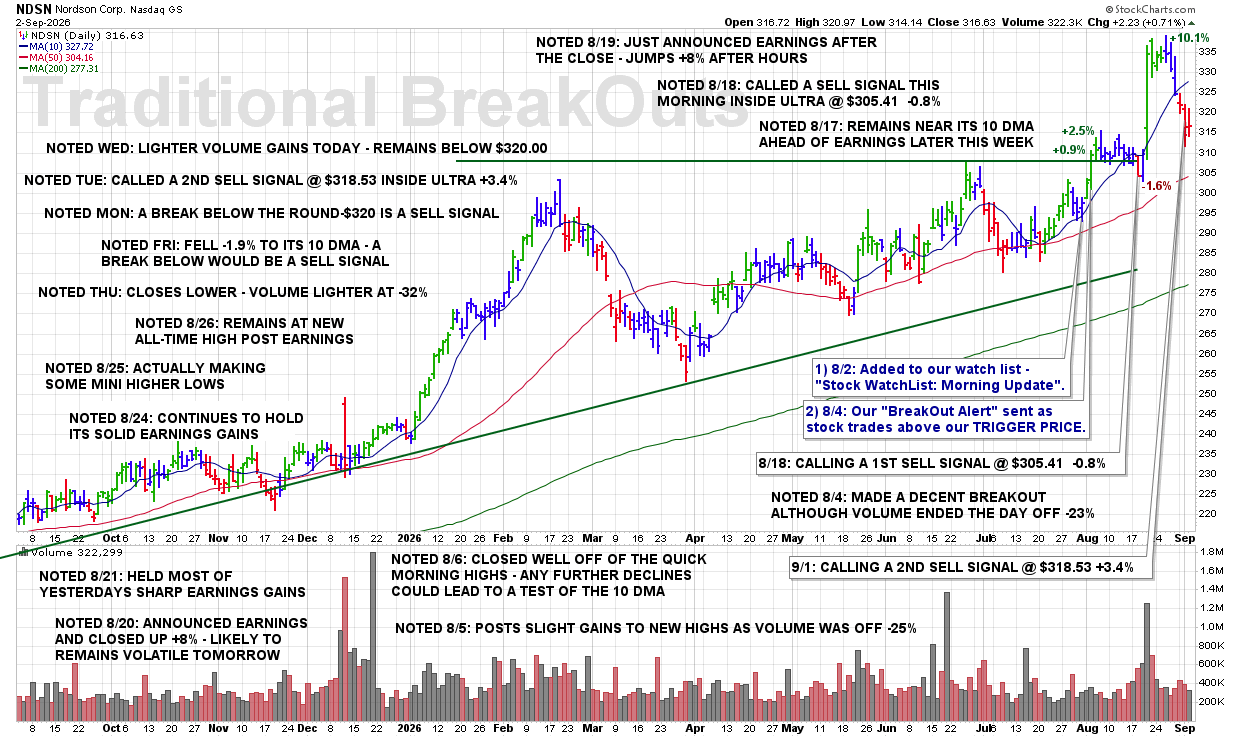
WED 9/2: NDSN – Lighter Volume Gains Today – Remains Below $320.00

8:50 PM – Here is our latest chart update for this recent breakout from our Traditional BreakOuts Watch List

CLICK/TAP CHART TO ZOOM
Chart services courtesy of stockcharts.com. Annotations by James Taulman.

We are currently reporting on this stock as an active holding and continue to monitor the stock closely for any technical SELL SIGNALS.

The focus always remains on price/volume action around key support levels, including the 10 DMA, 50 DMA, and any nearby trendline or ROUND-$ support.

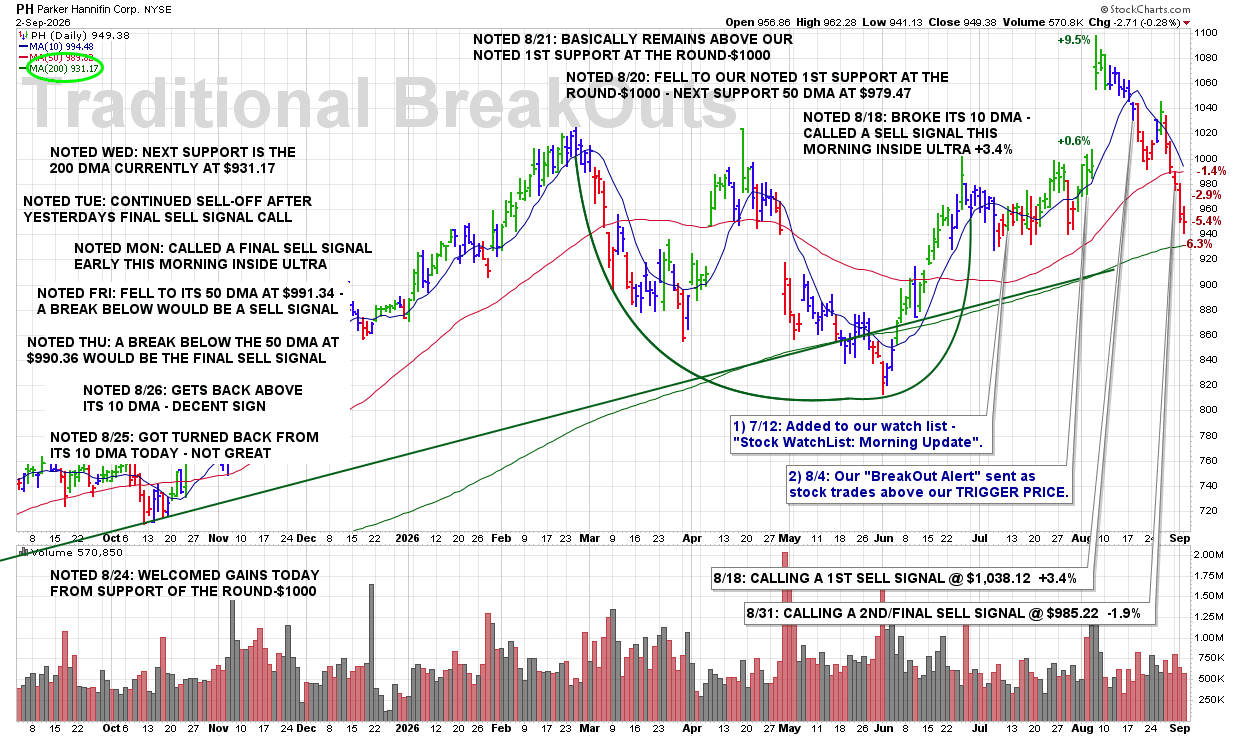
WED 9/2: PH – Next Support Is the 200 DMA Currently at $931.17

8:45 PM – Here is our latest chart update for this recent breakout from our Traditional BreakOuts Watch List

CLICK/TAP CHART TO ZOOM
Chart services courtesy of stockcharts.com. Annotations by James Taulman.

We are currently reporting on this stock as an active holding and continue to monitor the stock closely for any technical SELL SIGNALS.

The focus always remains on price/volume action around key support levels, including the 10 DMA, 50 DMA, and any nearby trendline or ROUND-$ support.

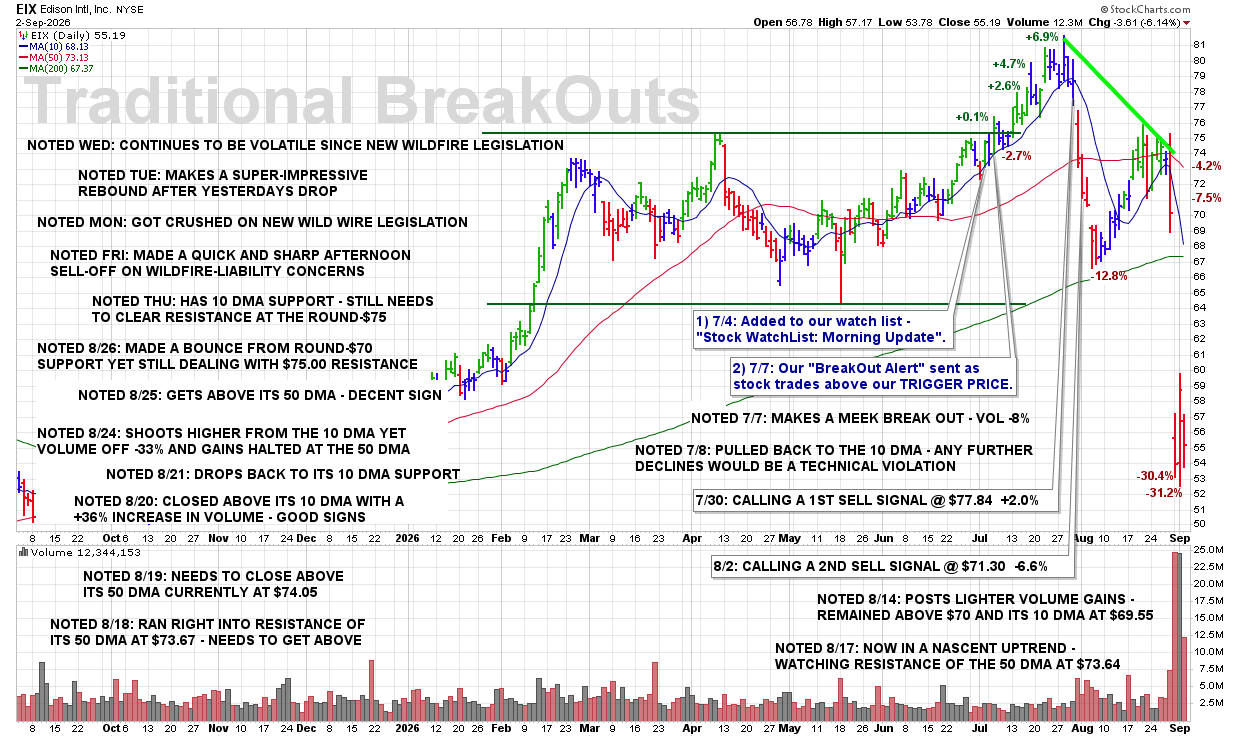
WED 9/2: EIX – Continues to Be Volatile Since New Wildfire Legislation

8:40 PM – Here is our latest chart update for this recent breakout from our Traditional BreakOuts Watch List.

CLICK/TAP CHART TO ZOOM
Chart services courtesy of stockcharts.com. Annotations by James Taulman.

We are currently reporting on this stock as an active holding and continue to monitor the stock closely for any technical SELL SIGNALS.

The focus always remains on price/volume action around key support levels, including the 10 DMA, 50 DMA, and any nearby trendline or ROUND-$ support.

WED 9/2: MD – A Fresh Break Out to New Highs Would Be Buyable

8:35 PM – Here is our latest chart update for this recent breakout from our Traditional BreakOuts Watch List.

CLICK/TAP CHART TO ZOOM
Chart services courtesy of stockcharts.com. Annotations by James Taulman.

We are currently reporting on this stock as an active holding and continue to monitor the stock closely for any technical SELL SIGNALS.

The focus always remains on price/volume action around key support levels, including the 10 DMA, 50 DMA, and any nearby trendline or ROUND-$ support.

WED 9/2: OII – Lighter Volume Trading Today Above the Round-$50

8:30 PM – Here is our latest chart update for this recent breakout from our Traditional BreakOuts Watch List.

CLICK/TAP CHART TO ZOOM
Chart services courtesy of stockcharts.com. Annotations by James Taulman.

We are currently reporting on this stock as an active holding and continue to monitor the stock closely for any technical SELL SIGNALS.

The focus always remains on price/volume action around key support levels, including the 10 DMA, 50 DMA, and any nearby trendline or ROUND-$ support.

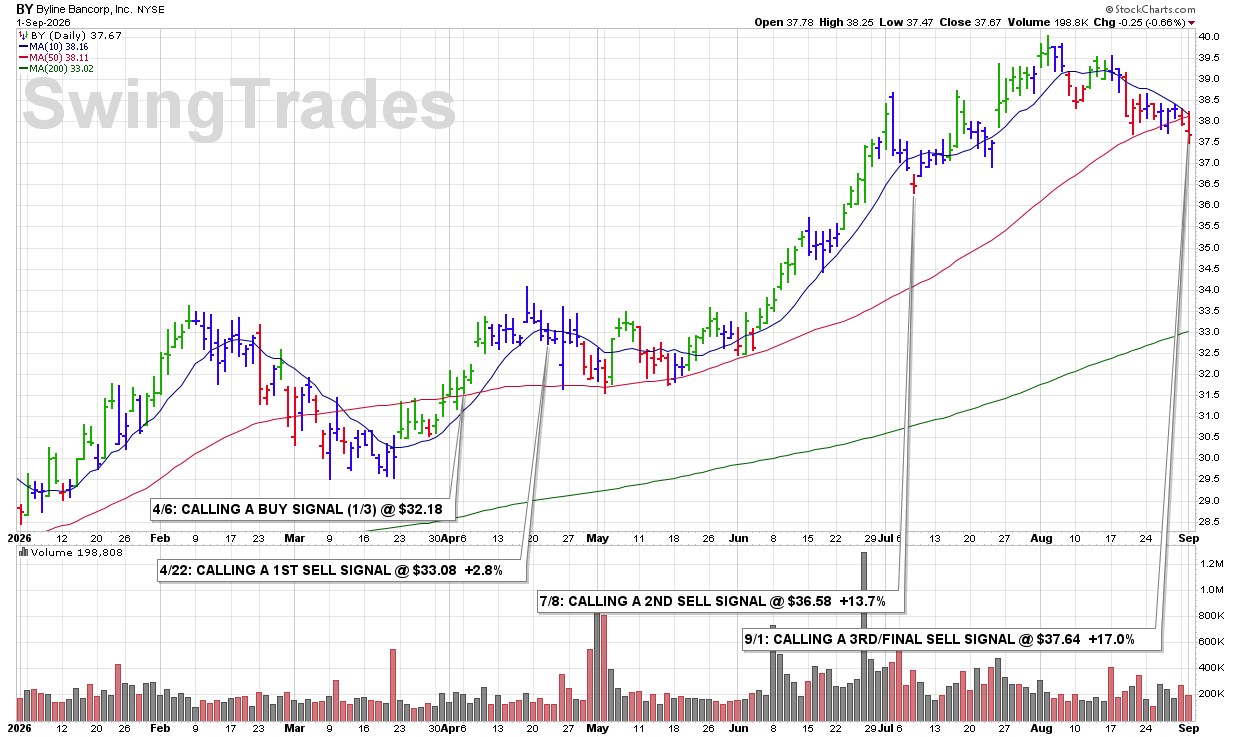
TUE 9/1: BY — Called a FINAL SELL SIGNAL at +17% as Bearish Action Mounts

10:05 PM – Calling a FINAL SELL SIGNAL on Byline Bancorp as bearish technical action continues to mount. The 10 DMA has repeatedly weighed on the stock and acted as resistance, while a clear downtrend has developed from the early-August highs near $40.00. Today’s move to a new recent closing low adds another bearish sign and confirms the continued deterioration.

ULTRA Trader’s Tip: Repeated Resistance Can Define the Trend

  • When a stock repeatedly fails at the 10 DMA, that line can shift from support to resistance.

  • A pattern of lower prices developing from prior highs is evidence that a downtrend is taking shape.

  • New recent lows add confirmation that weakness is continuing and support taking the final SELL SIGNAL.

CLICK/TAP CHART TO ZOOM
Chart services courtesy of stockcharts.com. Annotations by James Taulman.

TUE 9/1: NDSN – Called a Second SELL SIGNAL as Price Fell Below $320.00

9:27 PM – Called a 2ND SELL SIGNAL this morning as shares broke below the ROUND-$320 level with what was, at the time, an increase in volume. This follows Monday’s bearish action when the stock closed below its 10 DMA. We are now seeing mounting technical weakness with multiple support violations developing.

Longer term, NDSN does remain in an overall uptrend, but the shorter-term deterioration is enough to warrant this second SELL SIGNAL. Under the guidelines, and 1/3 position remains.

As noted just in last evenings Nighty Chart Updates – A Break Below the Round-$320 Is a Sell Signal

ULTRA Trader’s Tip: Separate the Short-Term Signal From the Long-Term Trend

• A stock can remain in a longer-term uptrend while still developing meaningful short-term weakness.

• Losing the 10 DMA followed by a break below ROUND-$320 shows that the bearish evidence is building.

• Scaling out as technical violations accumulate allows us to protect gains without ignoring the stock’s broader trend.

CLICK/TAP CHART TO ZOOM
Chart services courtesy of stockcharts.com. Annotations by James Taulman.

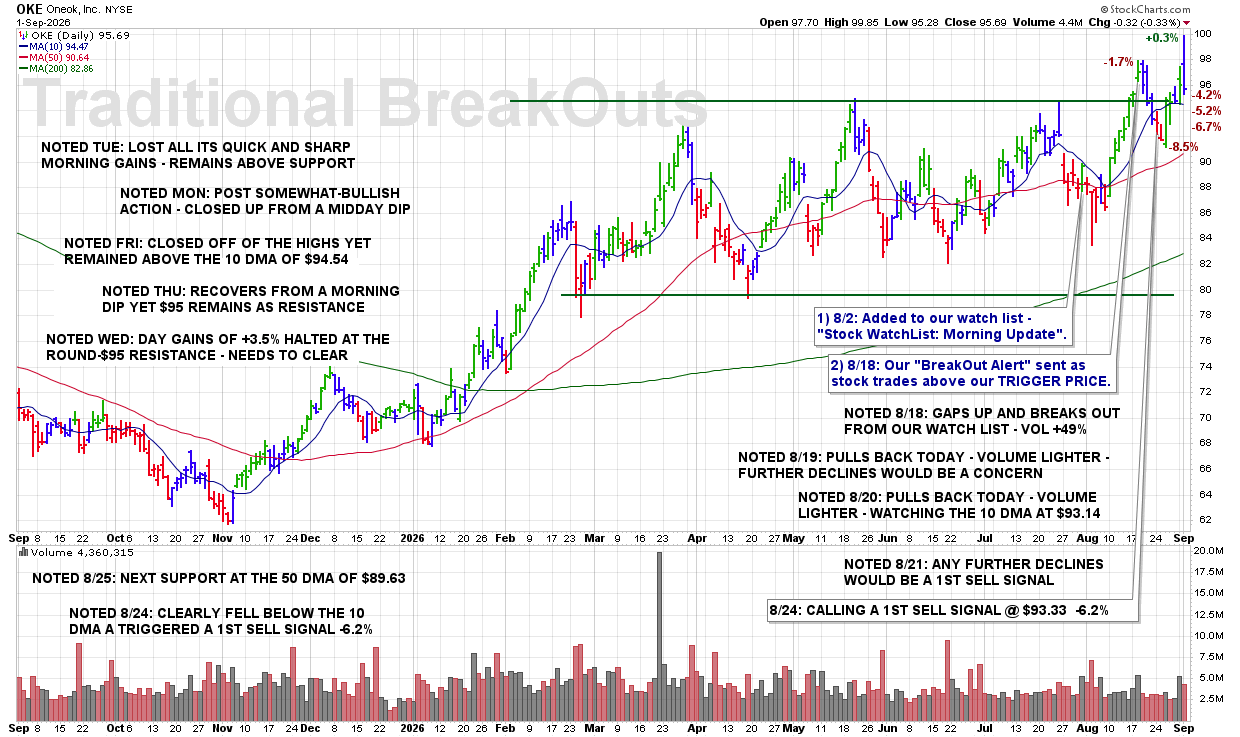
TUE 9/1: OKE – Lost All Its Quick and Sharp Morning Gains – Remains Above Support

8:55 PM – Here is our latest chart update for this recent breakout from our Traditional BreakOuts Watch List.

CLICK/TAP CHART TO ZOOM
Chart services courtesy of stockcharts.com. Annotations by James Taulman.

We are currently reporting on this stock as an active holding and continue to monitor the stock closely for any technical SELL SIGNALS.

The focus always remains on price/volume action around key support levels, including the 10 DMA, 50 DMA, and any nearby trendline or ROUND-$ support.

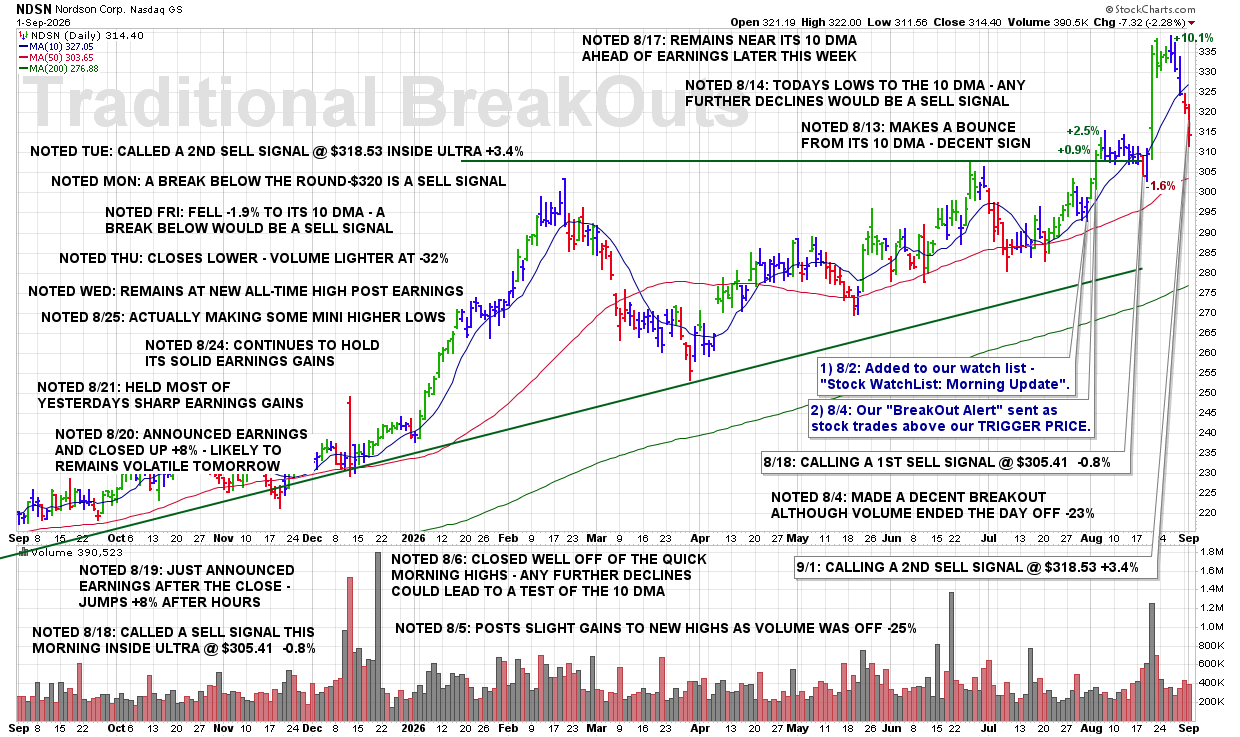
TUE 9/1: NDSN – Called a 2nd Sell Signal @ $318.53 Inside Ultra +3.4%

8:50 PM – Here is our latest chart update for this recent breakout from our Traditional BreakOuts Watch List

CLICK/TAP CHART TO ZOOM
Chart services courtesy of stockcharts.com. Annotations by James Taulman.

We are currently reporting on this stock as an active holding and continue to monitor the stock closely for any technical SELL SIGNALS.

The focus always remains on price/volume action around key support levels, including the 10 DMA, 50 DMA, and any nearby trendline or ROUND-$ support.

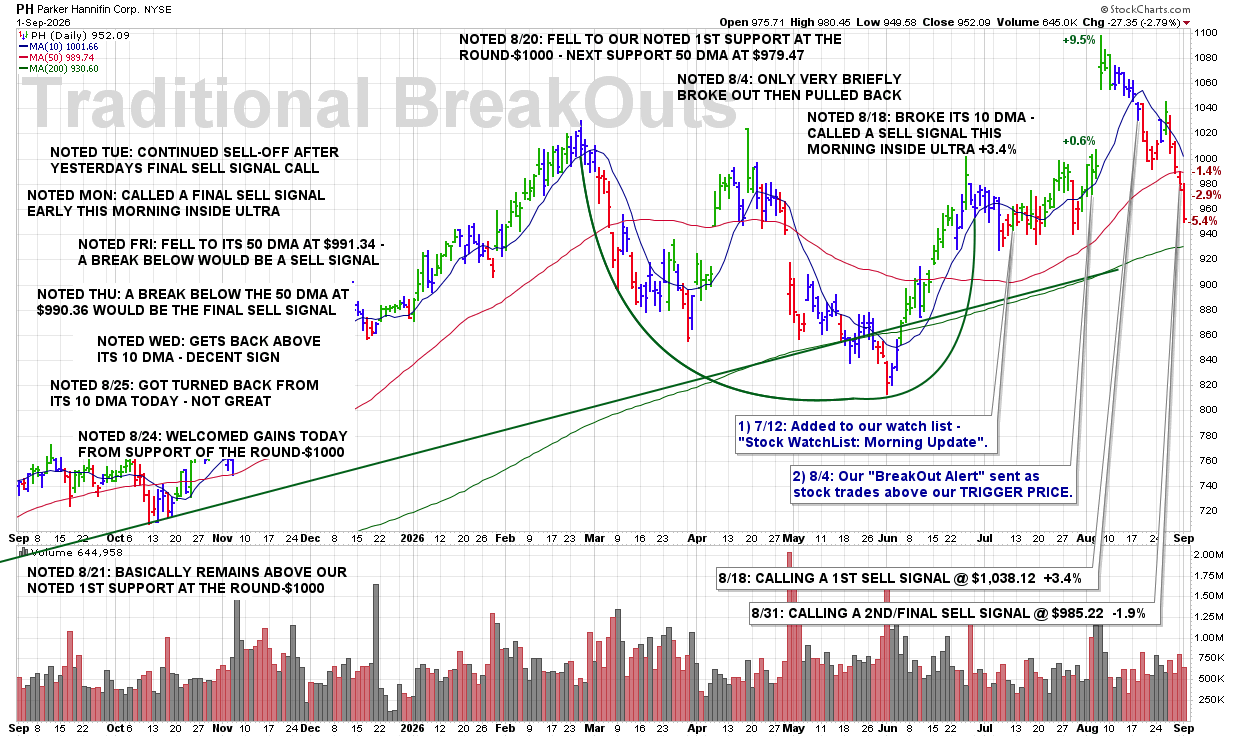
TUE 9/1: PH – Continued Sell-Off After Yesterdays Final Sell Signal Call

8:45 PM – Here is our latest chart update for this recent breakout from our Traditional BreakOuts Watch List

CLICK/TAP CHART TO ZOOM
Chart services courtesy of stockcharts.com. Annotations by James Taulman.

We are currently reporting on this stock as an active holding and continue to monitor the stock closely for any technical SELL SIGNALS.

The focus always remains on price/volume action around key support levels, including the 10 DMA, 50 DMA, and any nearby trendline or ROUND-$ support.

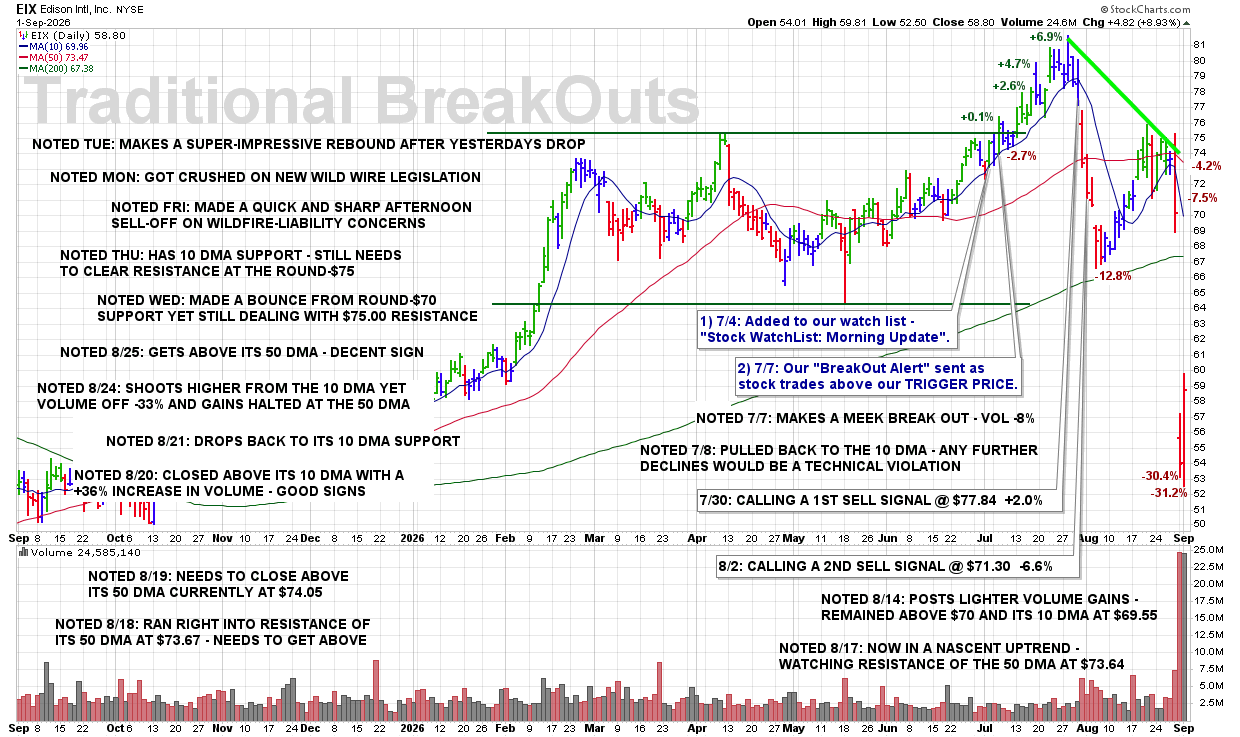
TUE 9/1: EIX – Makes a Super-Impressive Rebound After Yesterdays Drop

8:40 PM – Here is our latest chart update for this recent breakout from our Traditional BreakOuts Watch List.

CLICK/TAP CHART TO ZOOM
Chart services courtesy of stockcharts.com. Annotations by James Taulman.

We are currently reporting on this stock as an active holding and continue to monitor the stock closely for any technical SELL SIGNALS.

The focus always remains on price/volume action around key support levels, including the 10 DMA, 50 DMA, and any nearby trendline or ROUND-$ support.

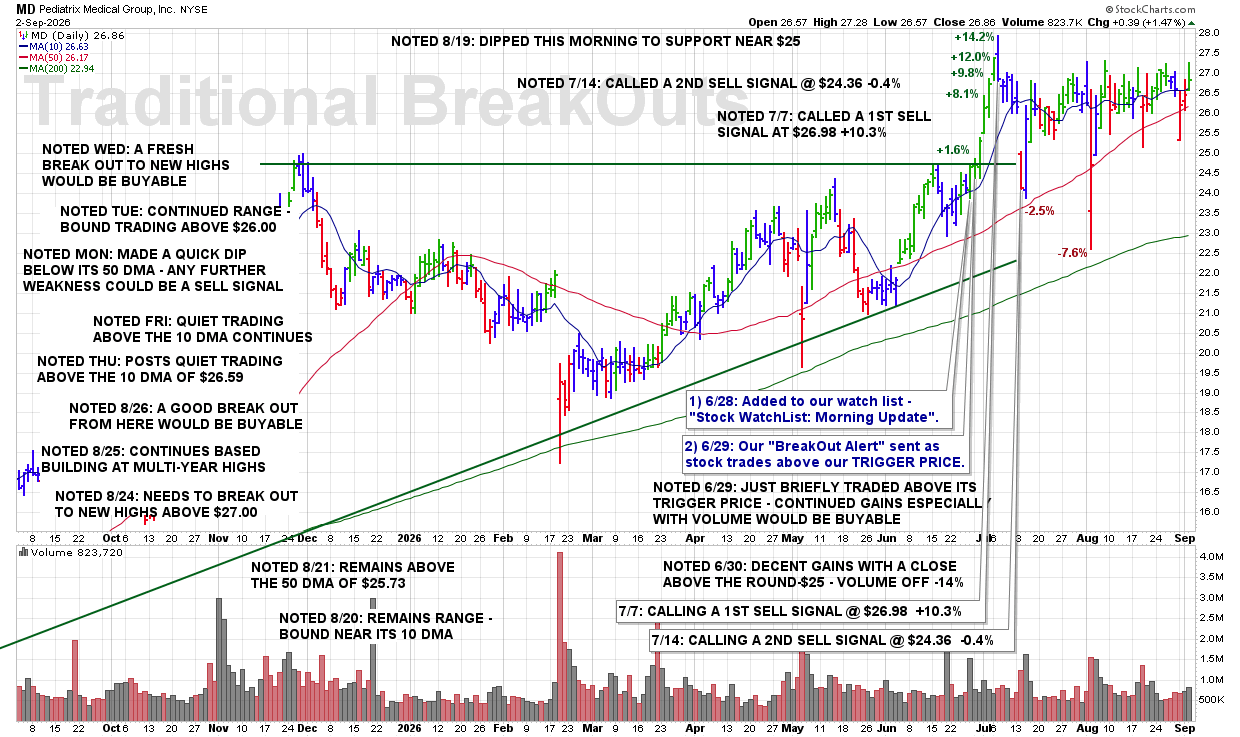
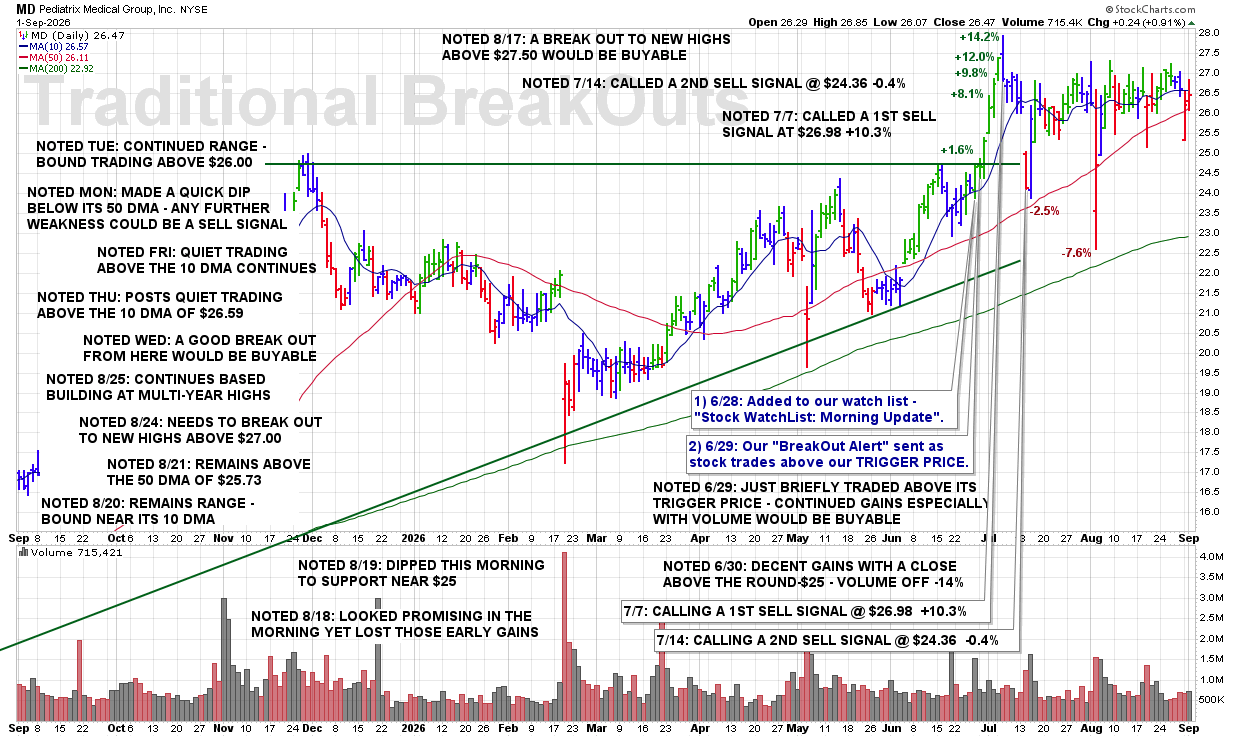
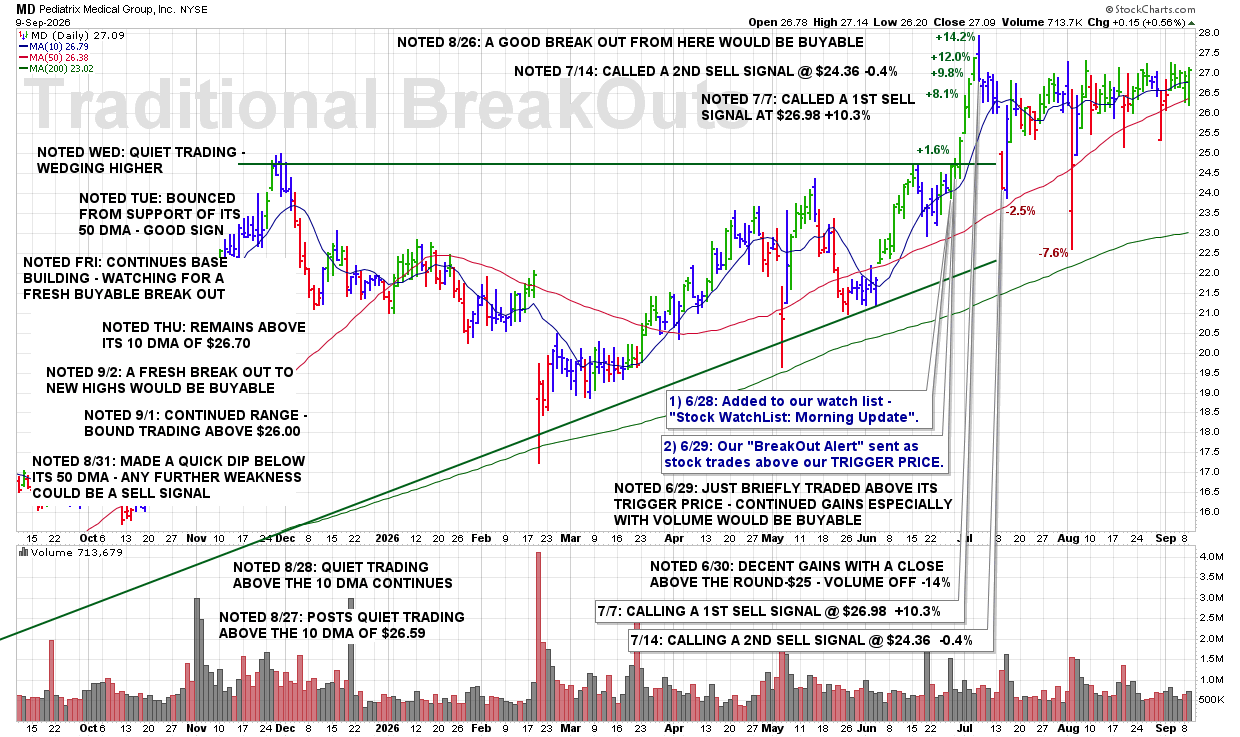
TUE 9/1: MD – Continued Range-Bound Trading Above $26.00

8:35 PM – Here is our latest chart update for this recent breakout from our Traditional BreakOuts Watch List.

CLICK/TAP CHART TO ZOOM
Chart services courtesy of stockcharts.com. Annotations by James Taulman.

We are currently reporting on this stock as an active holding and continue to monitor the stock closely for any technical SELL SIGNALS.

The focus always remains on price/volume action around key support levels, including the 10 DMA, 50 DMA, and any nearby trendline or ROUND-$ support.

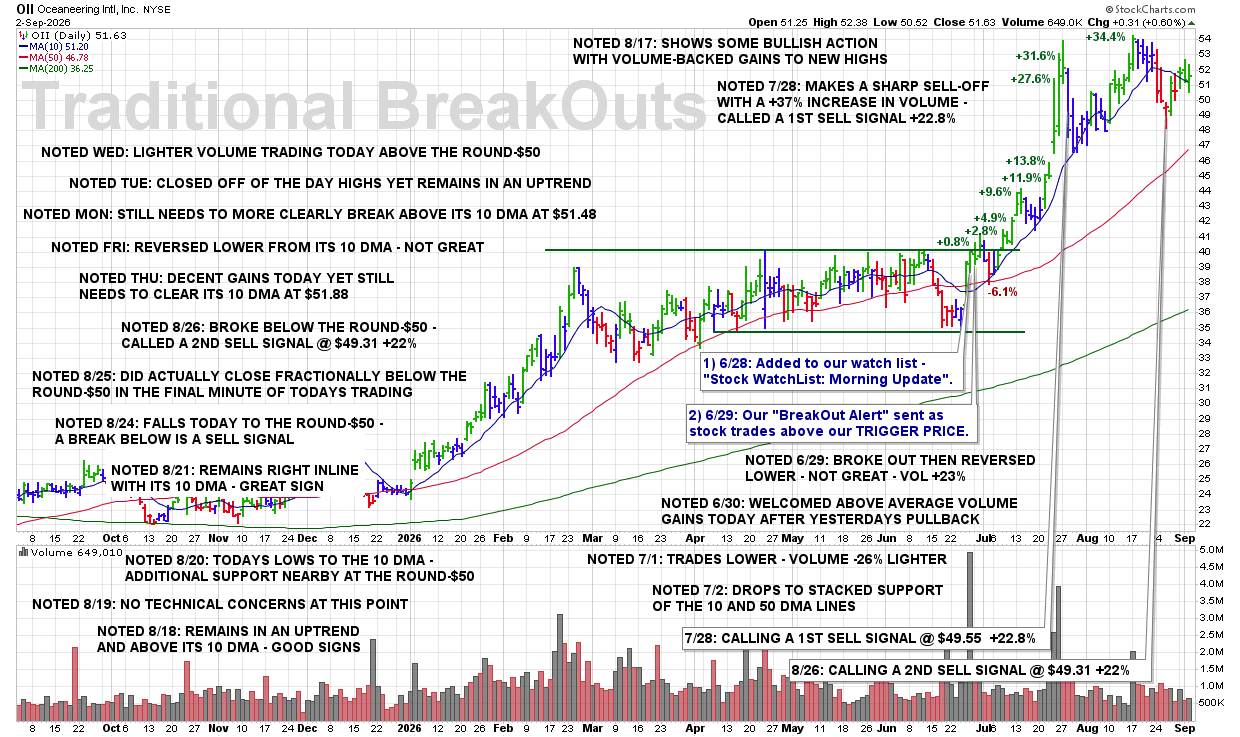
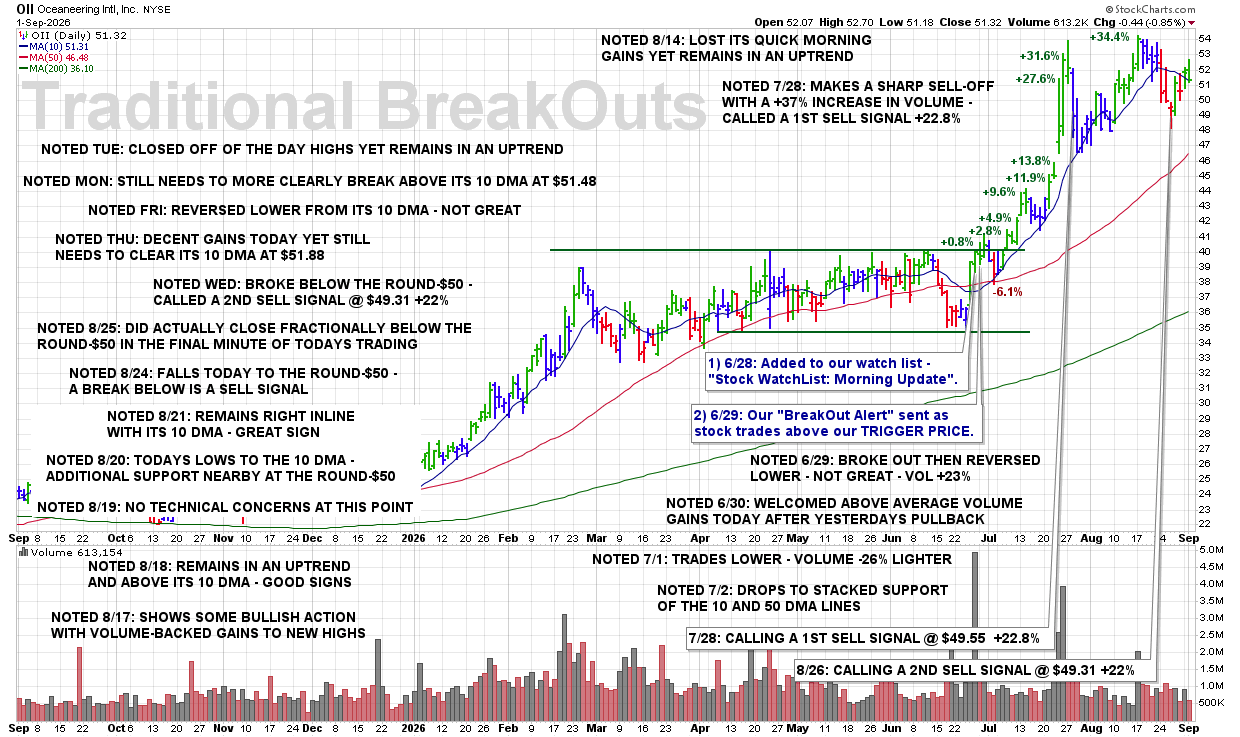
TUE 9/1: OII – Closed Off of the Day Highs Yet Remains in an Uptrend

8:30 PM – Here is our latest chart update for this recent breakout from our Traditional BreakOuts Watch List.

CLICK/TAP CHART TO ZOOM
Chart services courtesy of stockcharts.com. Annotations by James Taulman.

We are currently reporting on this stock as an active holding and continue to monitor the stock closely for any technical SELL SIGNALS.

The focus always remains on price/volume action around key support levels, including the 10 DMA, 50 DMA, and any nearby trendline or ROUND-$ support.