Ongoing updates for BY will be posted at the link below, as soon as each one is made available.
https://buyingbreakouts.com/category/by/
You can bookmark the page for future reference.
Ongoing updates for BY will be posted at the link below, as soon as each one is made available.
https://buyingbreakouts.com/category/by/
You can bookmark the page for future reference.
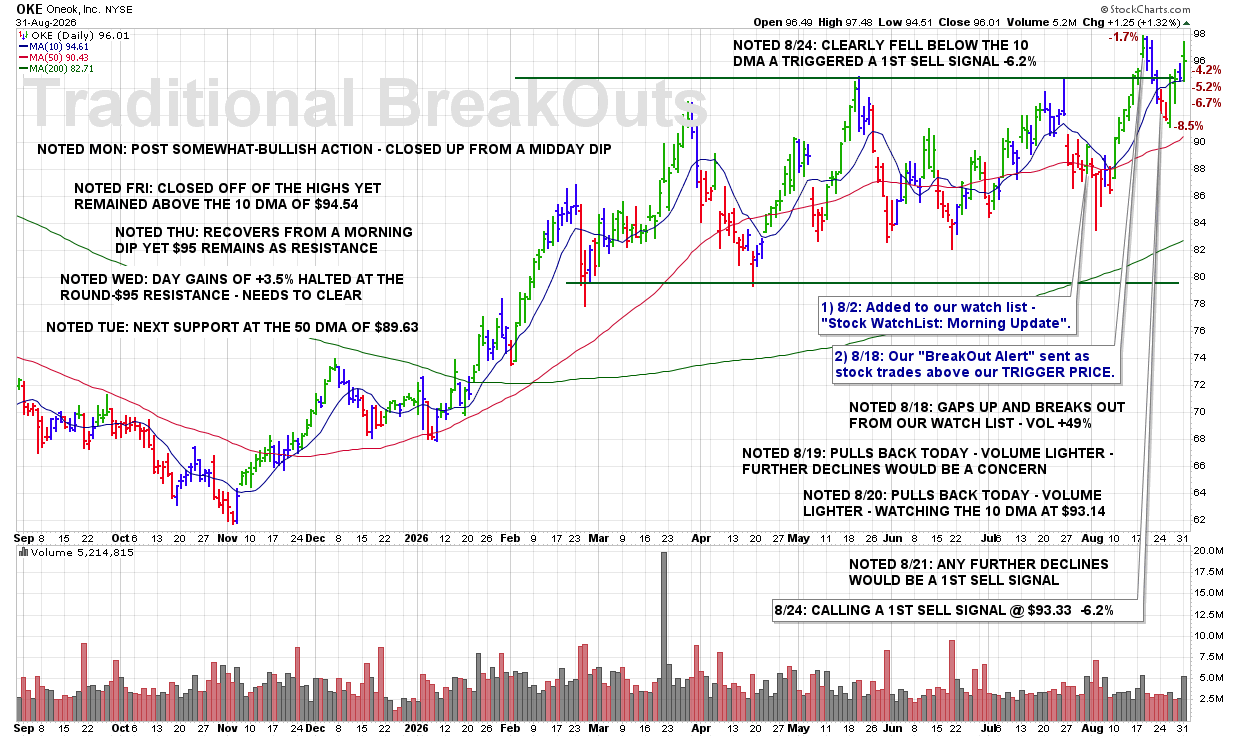
9:25 PM – Here is our latest chart update for this recent breakout from our Traditional BreakOuts Watch List.
CLICK/TAP CHART TO ZOOM
Chart services courtesy of stockcharts.com. Annotations by James Taulman.
We are currently reporting on this stock as an active holding and continue to monitor the stock closely for any technical SELL SIGNALS.
The focus always remains on price/volume action around key support levels, including the 10 DMA, 50 DMA, and any nearby trendline or ROUND-$ support.
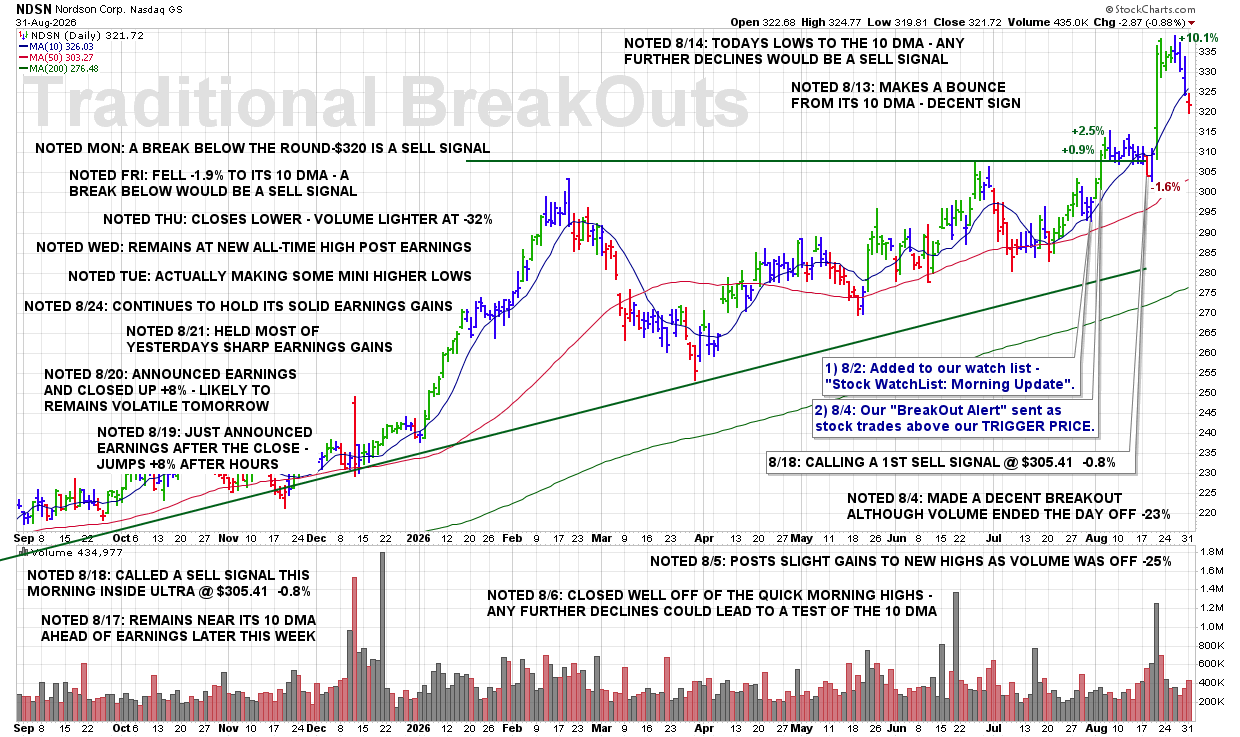
9:20 PM – Here is our latest chart update for this recent breakout from our Traditional BreakOuts Watch List
CLICK/TAP CHART TO ZOOM
Chart services courtesy of stockcharts.com. Annotations by James Taulman.
We are currently reporting on this stock as an active holding and continue to monitor the stock closely for any technical SELL SIGNALS.
The focus always remains on price/volume action around key support levels, including the 10 DMA, 50 DMA, and any nearby trendline or ROUND-$ support.
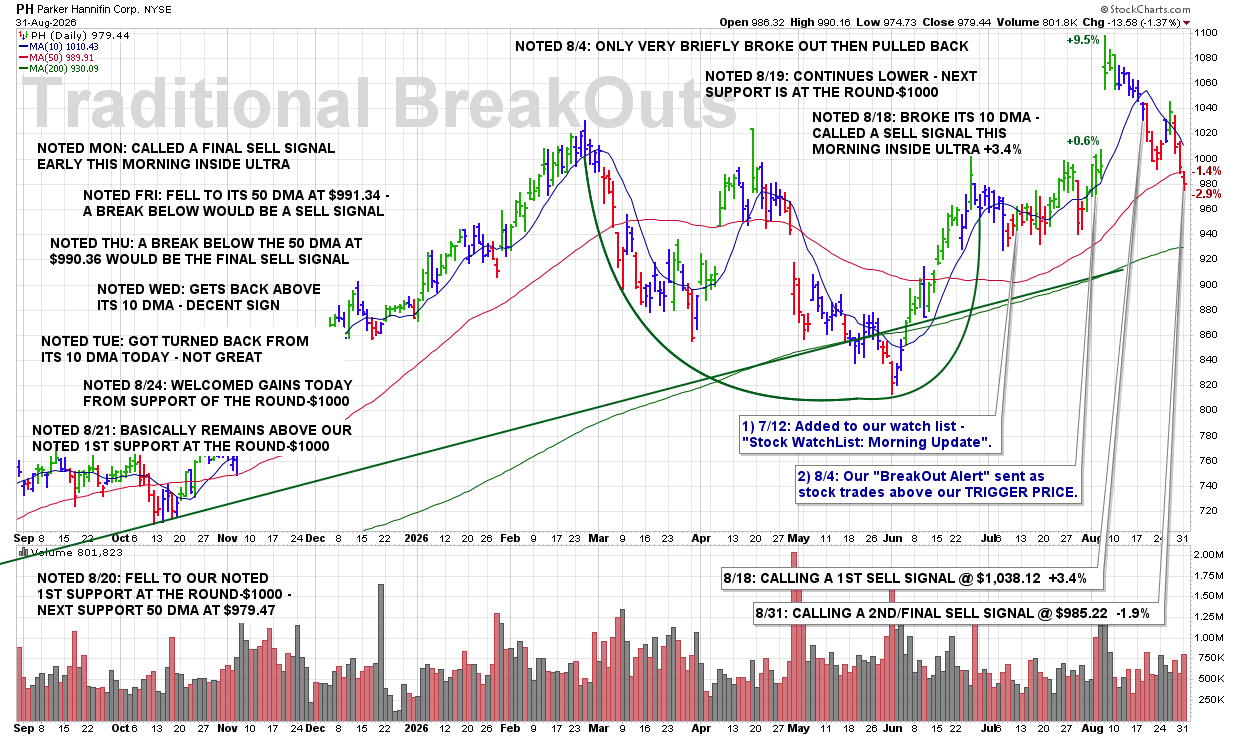
9:15 PM – Here is our latest chart update for this recent breakout from our Traditional BreakOuts Watch List
CLICK/TAP CHART TO ZOOM
Chart services courtesy of stockcharts.com. Annotations by James Taulman.
We are currently reporting on this stock as an active holding and continue to monitor the stock closely for any technical SELL SIGNALS.
The focus always remains on price/volume action around key support levels, including the 10 DMA, 50 DMA, and any nearby trendline or ROUND-$ support.
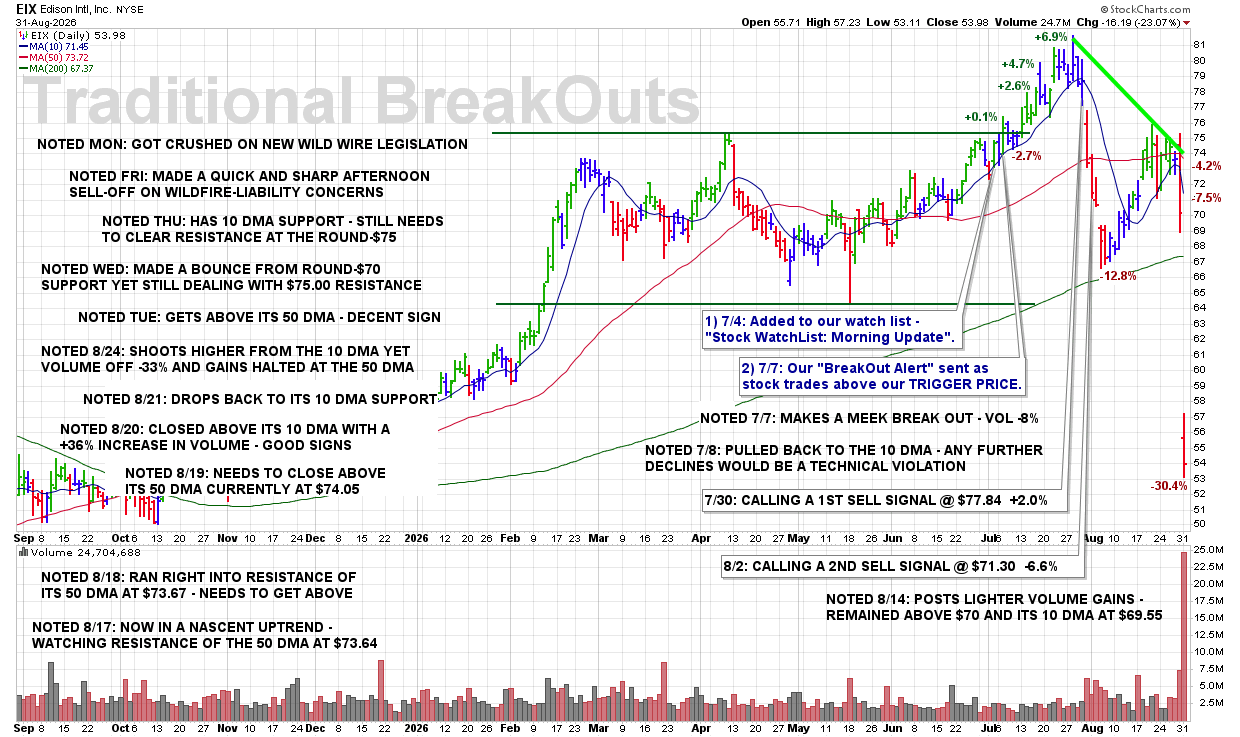
9:10 PM – Here is our latest chart update for this recent breakout from our Traditional BreakOuts Watch List.
CLICK/TAP CHART TO ZOOM
Chart services courtesy of stockcharts.com. Annotations by James Taulman.
We are currently reporting on this stock as an active holding and continue to monitor the stock closely for any technical SELL SIGNALS.
The focus always remains on price/volume action around key support levels, including the 10 DMA, 50 DMA, and any nearby trendline or ROUND-$ support.
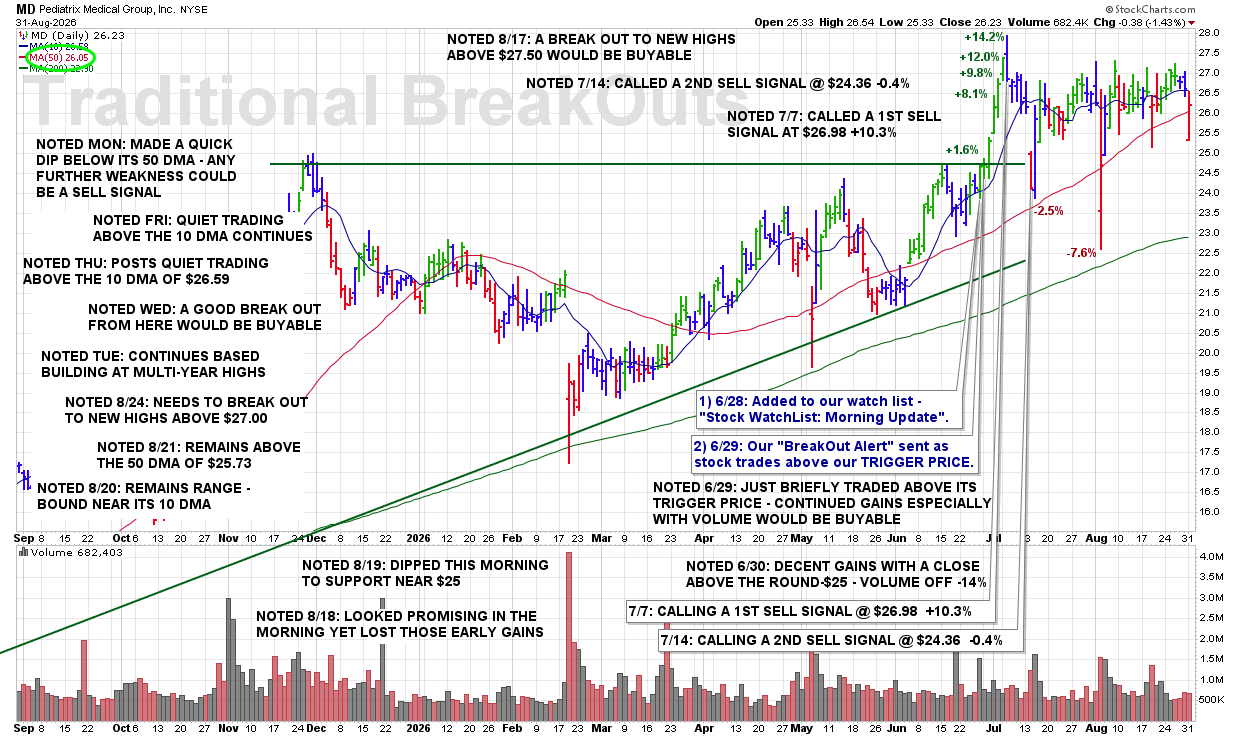
9:05 PM – Here is our latest chart update for this recent breakout from our Traditional BreakOuts Watch List.
CLICK/TAP CHART TO ZOOM
Chart services courtesy of stockcharts.com. Annotations by James Taulman.
We are currently reporting on this stock as an active holding and continue to monitor the stock closely for any technical SELL SIGNALS.
The focus always remains on price/volume action around key support levels, including the 10 DMA, 50 DMA, and any nearby trendline or ROUND-$ support.
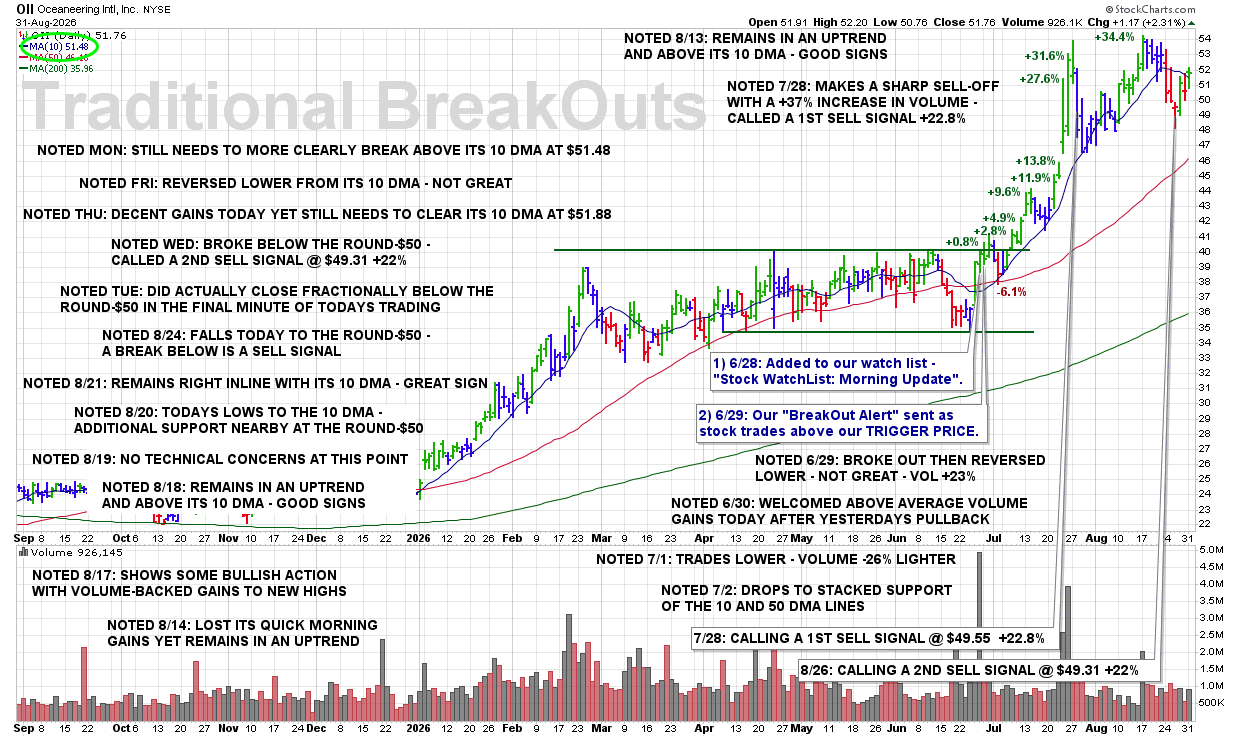
9:00 PM – Here is our latest chart update for this recent breakout from our Traditional BreakOuts Watch List.
CLICK/TAP CHART TO ZOOM
Chart services courtesy of stockcharts.com. Annotations by James Taulman.
We are currently reporting on this stock as an active holding and continue to monitor the stock closely for any technical SELL SIGNALS.
The focus always remains on price/volume action around key support levels, including the 10 DMA, 50 DMA, and any nearby trendline or ROUND-$ support.
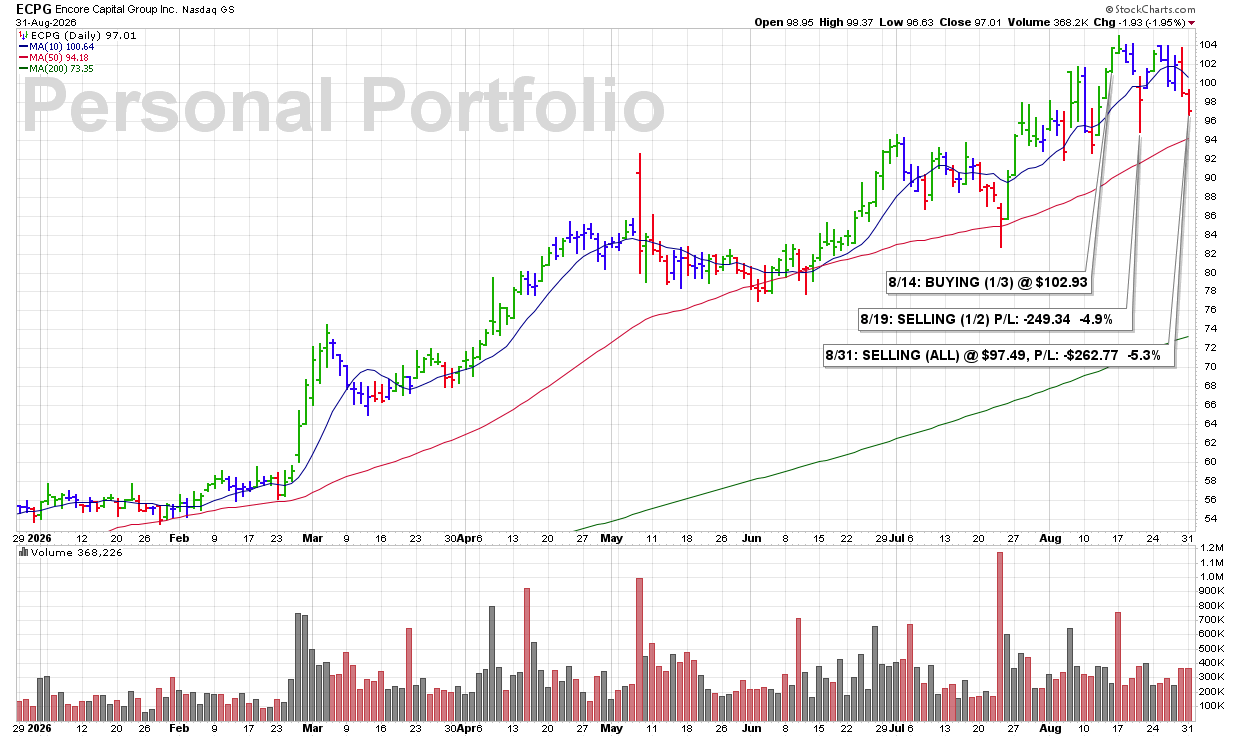
3:58 PM – Selling the last half of my ECPG position here this afternoon as the stock continues to display bearish technical signs. With the weakness persisting and my overall posture becoming more defensive at this point, I see no reason to continue holding the remaining shares. I’m exiting the position completely and protecting capital.
James’ Trader’s Tip: Adjust Your Exposure as Conditions Change
• Persistent bearish action is a reason to reduce exposure rather than wait for conditions to worsen.
• Individual stock weakness becomes even more important when your overall posture is turning defensive.
• Capital preserved today is capital available for the next strong BUY SIGNAL.
CLICK/TAP CHART TO ZOOM
Chart services courtesy of stockcharts.com. Annotations by James Taulman.
Ongoing updates for GLAD will be posted at the link below, as soon as each one is made available.
https://buyingbreakouts.com/category/glad/
You can bookmark the page for future reference.
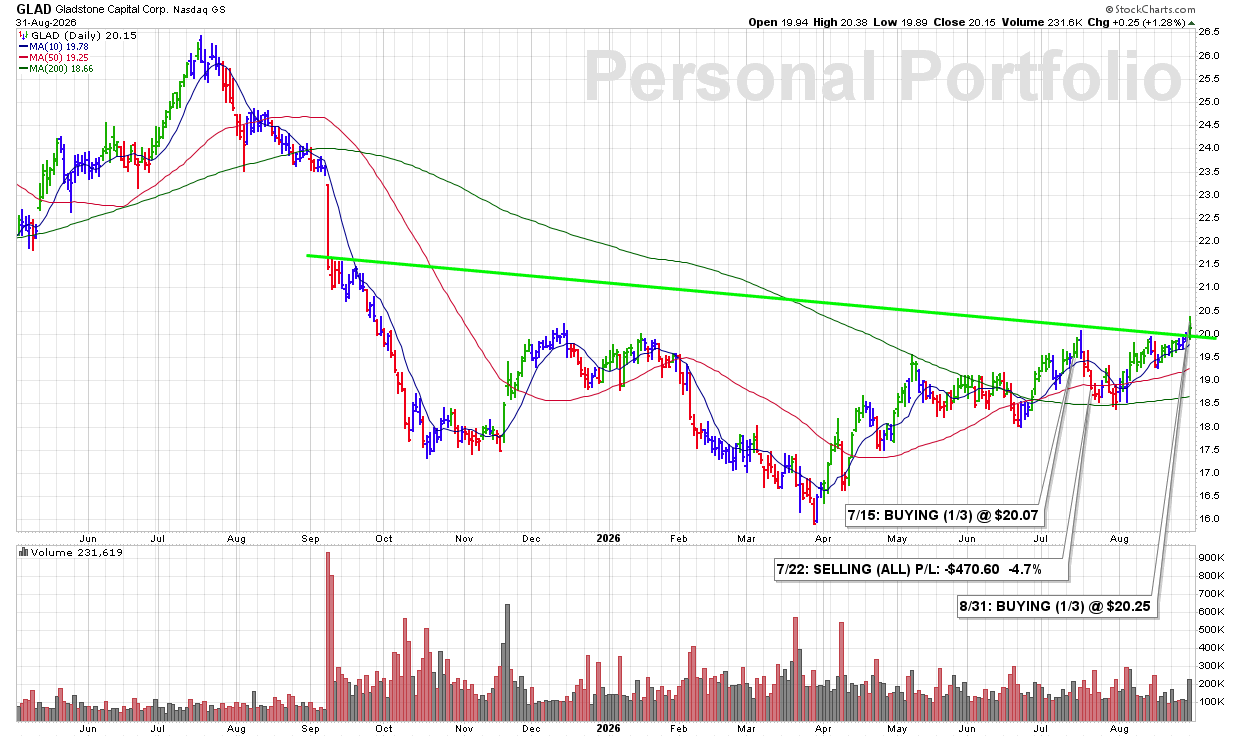
3:38 PM – Starting a 1/3 position in this Finance-Investment Management company as shares begin to break out of their recent downtrend while volume runs 39% above average. The improving price action combined with increased volume gives me enough bullish technical evidence to initiate a starter position.
James’ Trader’s Tip: A Trend Change Needs Confirmation
• Breaking out of a downtrend can signal an important change in the stock’s technical character.
• Above-average volume strengthens the move by showing increased demand behind the breakout.
• Starting with a 1/3 position lets us participate while requiring the stock to prove itself before committing additional capital.
CLICK/TAP CHART TO ZOOM
Chart services courtesy of stockcharts.com. Annotations by James Taulman.
1:05 PM – Calling a 3RD and FINAL SELL SIGNAL this afternoon as shares clearly break below their 50 DMA support while volume is on pace to finish above the daily average. That is a significant technical violation and completes all three SELL SIGNALS on this selection.
With each SELL SIGNAL locking in more than a +30% gain, MYE finishes as a clear winning ULTRA swing trade.
ULTRA Trader’s Tip: Scale Out and Protect a Big Winner
• The 50 DMA is an important support level, and a decisive break below it is a major technical warning.
• Scaling out through multiple SELL SIGNALS allows us to systematically protect gains as a stock weakens.
• Completing all three SELL SIGNALS with gains above +30% shows the value of letting strength work while still respecting technical violations.

CLICK/TAP CHART TO ZOOM
Chart services courtesy of stockcharts.com. Annotations by James Taulman.
Ongoing updates for MYE will be posted at the link below, as soon as each one is made available.
https://buyingbreakouts.com/category/mye/
You can bookmark the page for future reference.
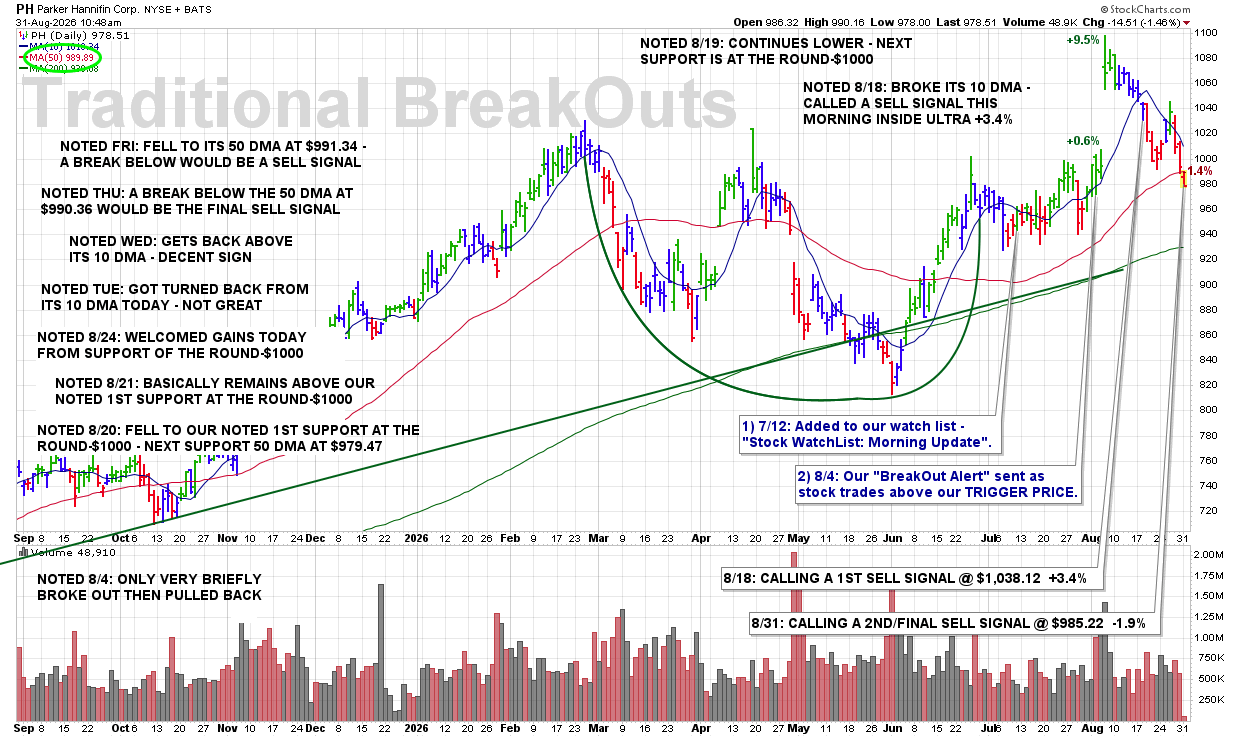
10:11 AM – Calling a 2ND and FINAL SELL SIGNAL here this morning as shares clearly break below their 50 DMA support. As noted on Friday, a break below the 50 DMA would trigger another SELL SIGNAL. That technical violation has now occurred, closing out the selection under our rules.
ULTRA Trader’s Tip: Major Support Breaks Require Action
• The 50 DMA is an important intermediate-term support level and a key line we monitor closely.
• Identifying the SELL level in advance removes emotion from the decision when that level is eventually broken.
• When the stock triggers the predetermined rule, follow the signal and move on.
CLICK/TAP CHART TO ZOOM
Chart services courtesy of stockcharts.com. Annotations by James Taulman.
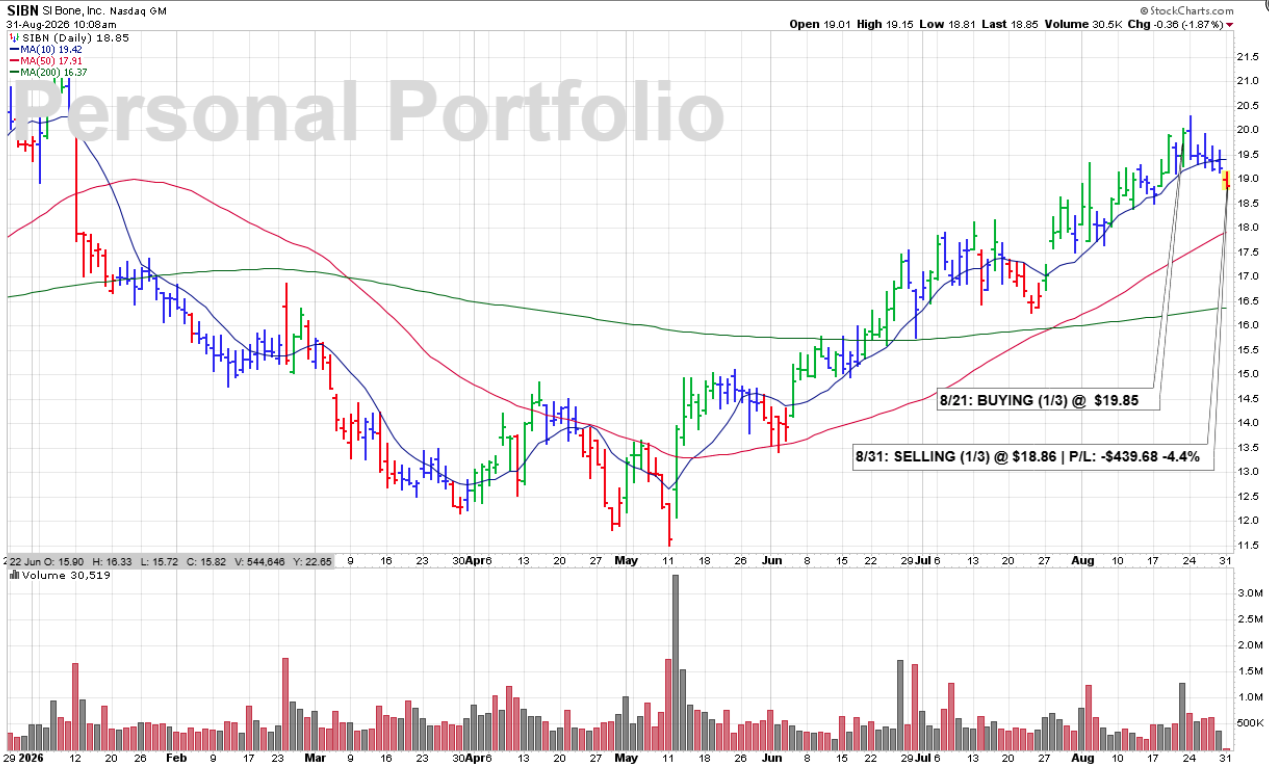
10:01 AM – Selling the last of my SIBN position here this morning as shares have been forming a series of lower highs and have now clearly broken below their 10 DMA support. The developing downtrend combined with the loss of our key short-term support is enough bearish technical evidence for me to exit the position completely.
James’ Trader’s Tip: Lower Highs Warn of Deteriorating Strength
• A series of lower highs can be an early indication that a stock is beginning to trend lower.
• A subsequent break below the 10 DMA confirms that short-term support has weakened.
• When multiple bearish signs begin stacking up, follow the technical evidence and protect capital.
CLICK/TAP CHART TO ZOOM
Chart services courtesy of stockcharts.com. Annotations by James Taulman.
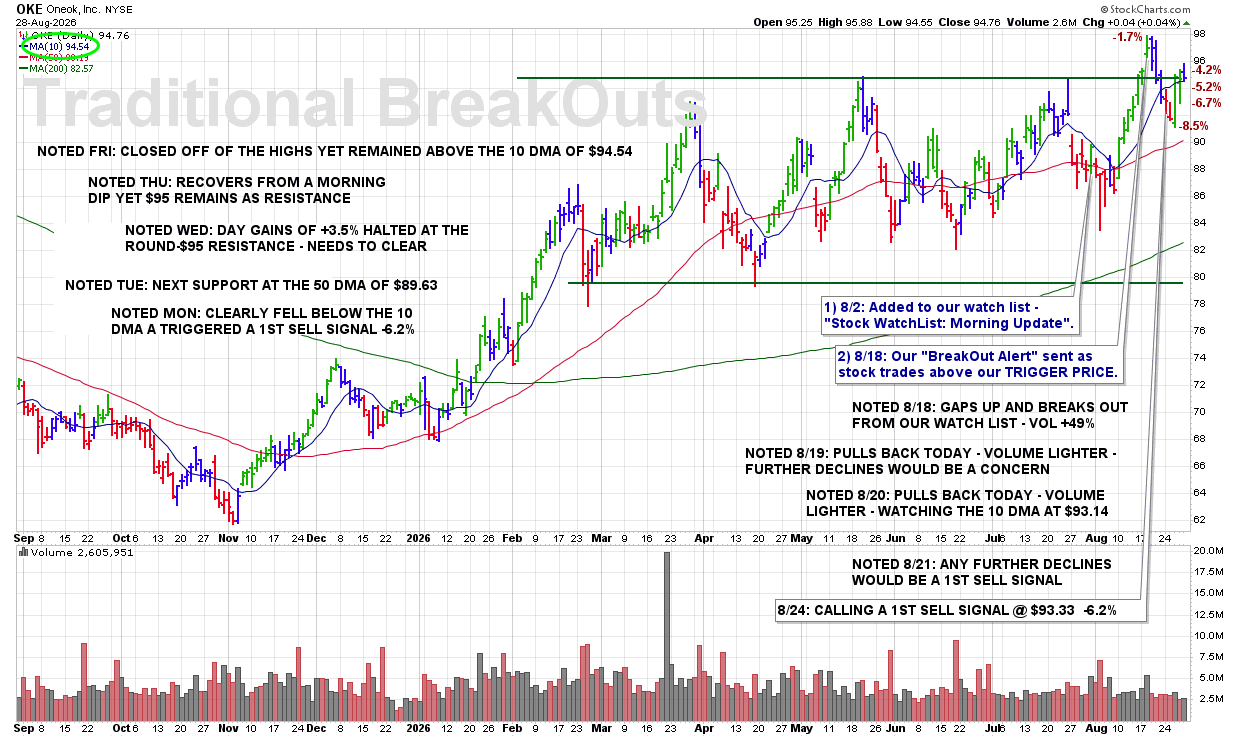
8:55 PM – Here is our latest chart update for this recent breakout from our Traditional BreakOuts Watch List.
CLICK/TAP CHART TO ZOOM
Chart services courtesy of stockcharts.com. Annotations by James Taulman.
We are currently reporting on this stock as an active holding and continue to monitor the stock closely for any technical SELL SIGNALS.
The focus always remains on price/volume action around key support levels, including the 10 DMA, 50 DMA, and any nearby trendline or ROUND-$ support.
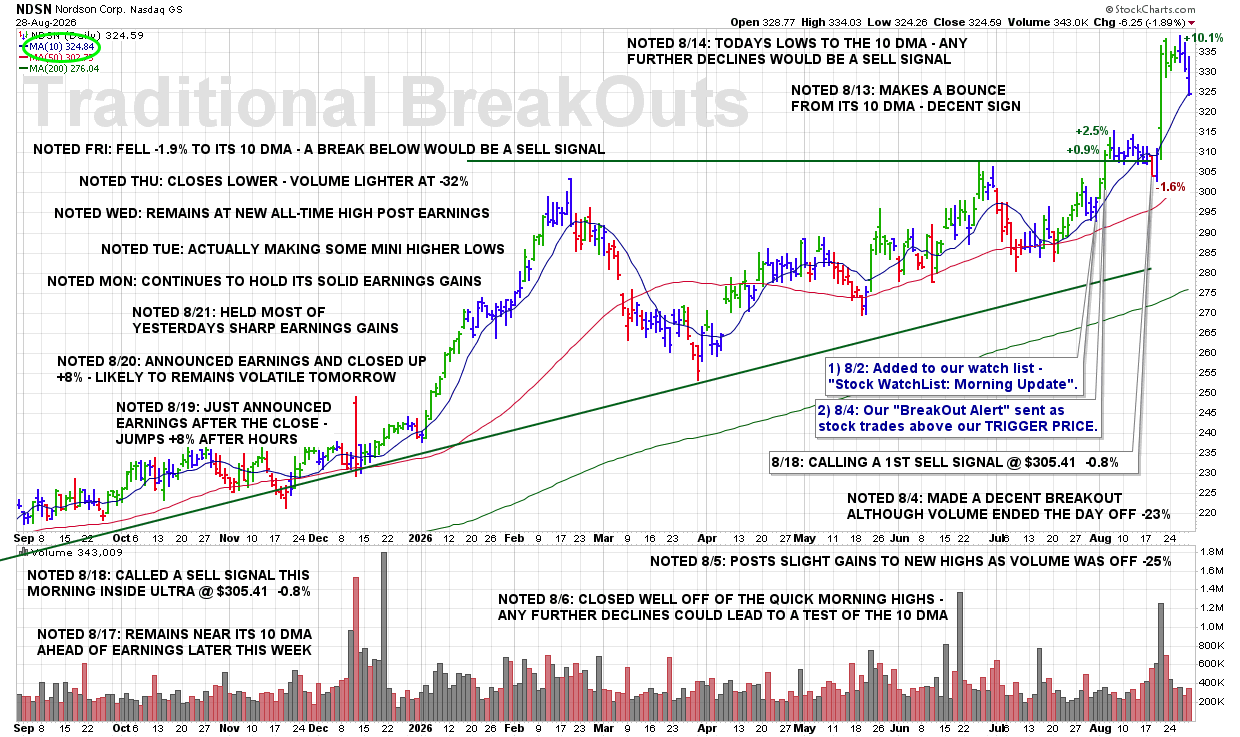
8:50 PM – Here is our latest chart update for this recent breakout from our Traditional BreakOuts Watch List
CLICK/TAP CHART TO ZOOM
Chart services courtesy of stockcharts.com. Annotations by James Taulman.
We are currently reporting on this stock as an active holding and continue to monitor the stock closely for any technical SELL SIGNALS.
The focus always remains on price/volume action around key support levels, including the 10 DMA, 50 DMA, and any nearby trendline or ROUND-$ support.
8:45 PM – Here is our latest chart update for this recent breakout from our Traditional BreakOuts Watch List

CLICK/TAP CHART TO ZOOM
Chart services courtesy of stockcharts.com. Annotations by James Taulman.
We are currently reporting on this stock as an active holding and continue to monitor the stock closely for any technical SELL SIGNALS.
The focus always remains on price/volume action around key support levels, including the 10 DMA, 50 DMA, and any nearby trendline or ROUND-$ support.
8:40 PM – Here is our latest chart update for this recent breakout from our Traditional BreakOuts Watch List.

CLICK/TAP CHART TO ZOOM
Chart services courtesy of stockcharts.com. Annotations by James Taulman.
We are currently reporting on this stock as an active holding and continue to monitor the stock closely for any technical SELL SIGNALS.
The focus always remains on price/volume action around key support levels, including the 10 DMA, 50 DMA, and any nearby trendline or ROUND-$ support.
8:35 PM – Here is our latest chart update for this recent breakout from our Traditional BreakOuts Watch List.

CLICK/TAP CHART TO ZOOM
Chart services courtesy of stockcharts.com. Annotations by James Taulman.
We are currently reporting on this stock as an active holding and continue to monitor the stock closely for any technical SELL SIGNALS.
The focus always remains on price/volume action around key support levels, including the 10 DMA, 50 DMA, and any nearby trendline or ROUND-$ support.
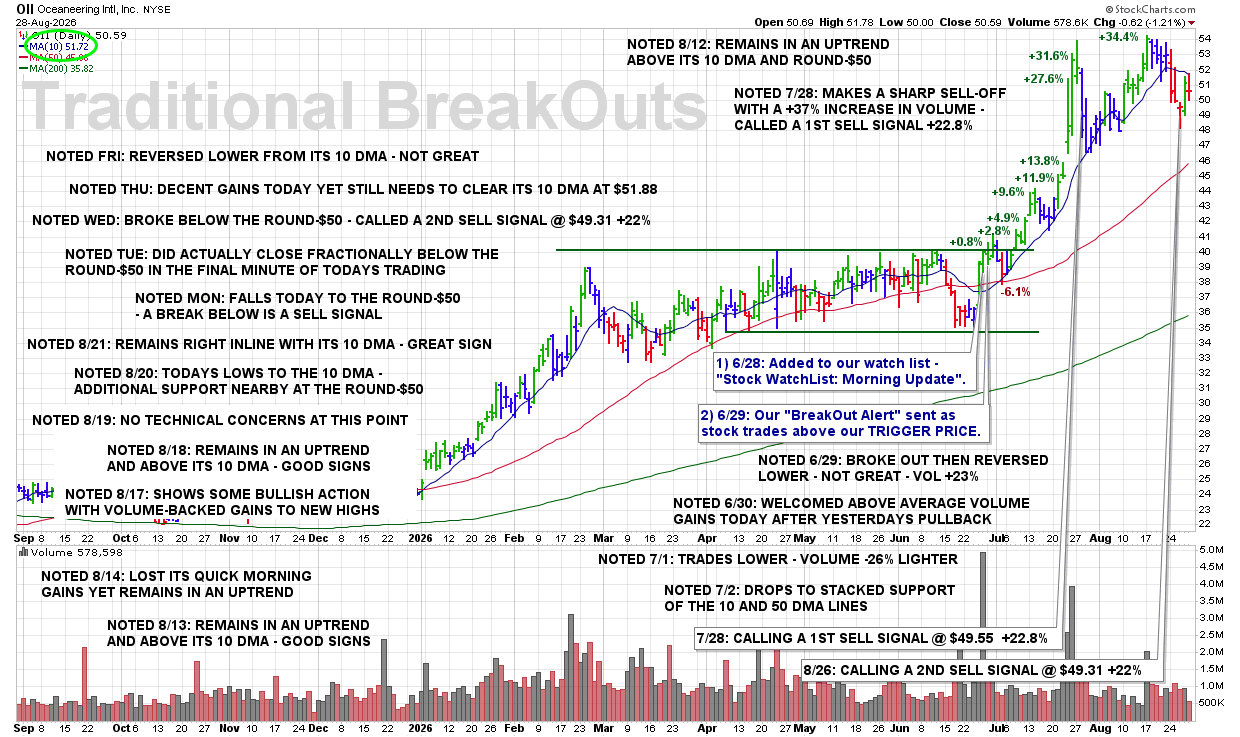
8:30 PM – Here is our latest chart update for this recent breakout from our Traditional BreakOuts Watch List.
CLICK/TAP CHART TO ZOOM
Chart services courtesy of stockcharts.com. Annotations by James Taulman.
We are currently reporting on this stock as an active holding and continue to monitor the stock closely for any technical SELL SIGNALS.
The focus always remains on price/volume action around key support levels, including the 10 DMA, 50 DMA, and any nearby trendline or ROUND-$ support.
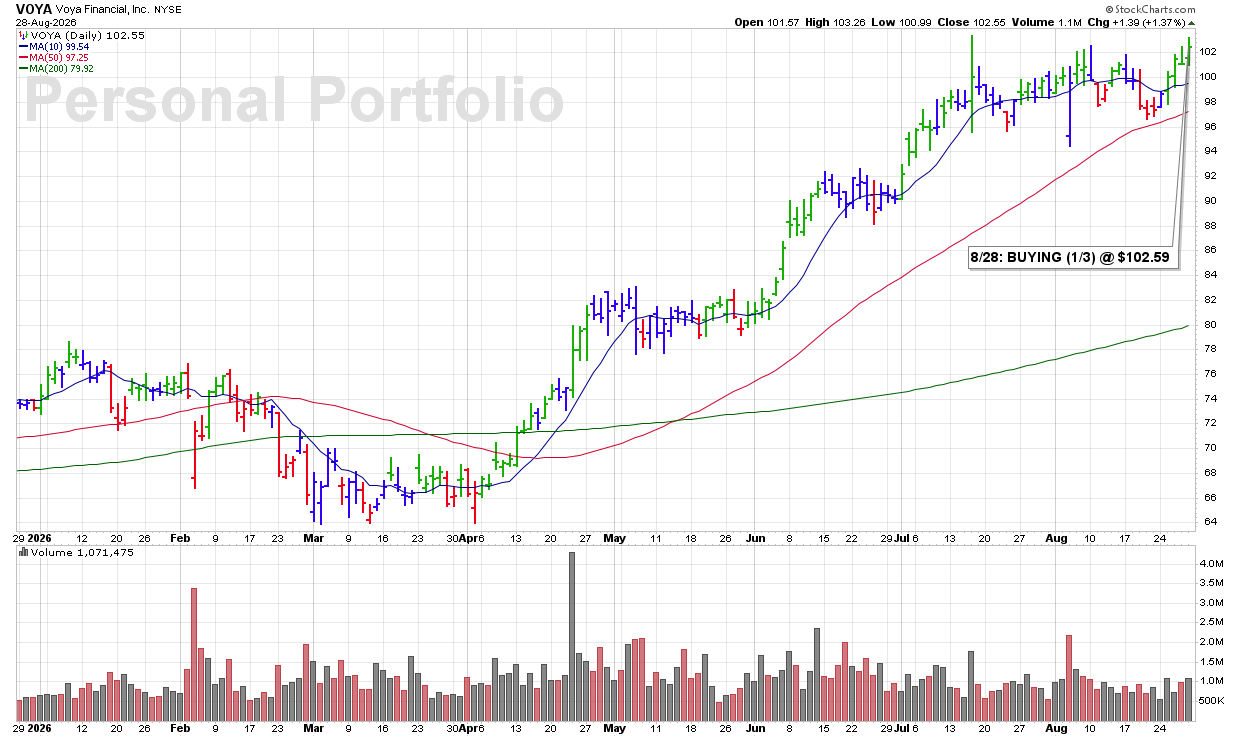
3:40 PM – Picking up a 1/3 position in this Insurance leader as shares push toward new all-time highs while volume runs above average. The combination of strong price action near record highs and increased volume gives me enough bullish technical evidence to initiate a position.
James’ Trader’s Tip: New Highs Show Leadership
• Stocks trading near all-time highs are demonstrating strong relative price action.
• Increased volume adds confirmation that buyers are supporting the advance.
• Starting with a 1/3 position allows us to participate while giving the stock room to further confirm its strength.
CLICK/TAP CHART TO ZOOM
Chart services courtesy of stockcharts.com. Annotations by James Taulman.
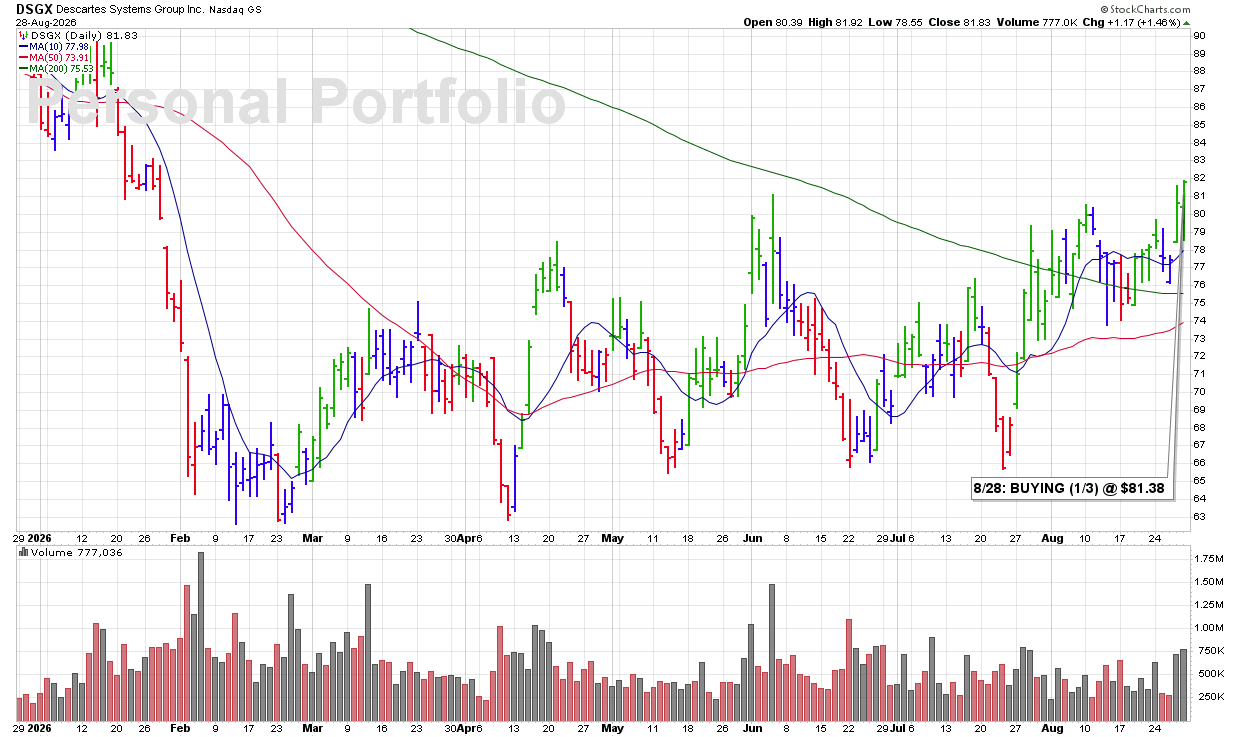
3:40 PM – Starting a 1/3 position in this Computer Software-Specialty Enterprise company as shares shoot higher from near the 10 DMA and look to be closing at a new recent high above $81.00 with a solid increase in volume. The combination of support at the 10 DMA, a move to new recent highs, and increased volume gives me a technical BUY SIGNAL.
James’ Trader’s Tip: Strength Should Be Confirmed by Volume
• An advance from near the 10 DMA shows that important short-term support is holding.
• Moving into new recent highs demonstrates improving price strength.
• Increased volume adds conviction by showing stronger demand behind the move.
CLICK/TAP CHART TO ZOOM
Chart services courtesy of stockcharts.com. Annotations by James Taulman.
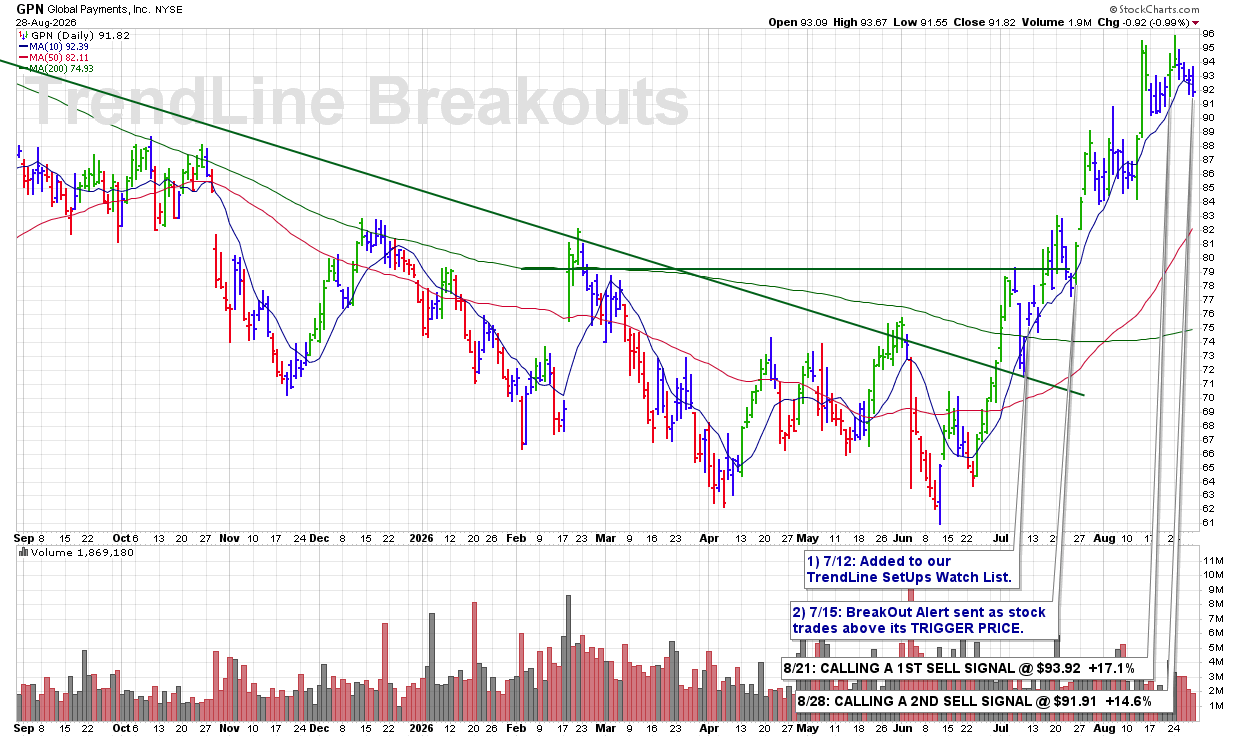
3:26 PM – Calling a 2ND SELL SIGNAL as shares are now clearly breaking below the 10 DMA while also forming a series of lower highs. That combination is a bearish technical development and can mark the beginning of a developing downtrend. With the position still showing a +14.6% gain, this is the type of weakness we want to respect rather than ignore.
ULTRA Trader’s Tip: Lower Highs Can Signal a Trend Change
• A series of lower highs shows that buyers are becoming less willing to push the stock back to previous levels.
• A break below the 10 DMA adds another important technical violation.
• When weakening price structure and a support break occur together, protect profits and follow the SELL rules.
CLICK/TAP CHART TO ZOOM
Chart services courtesy of stockcharts.com. Annotations by James Taulman.
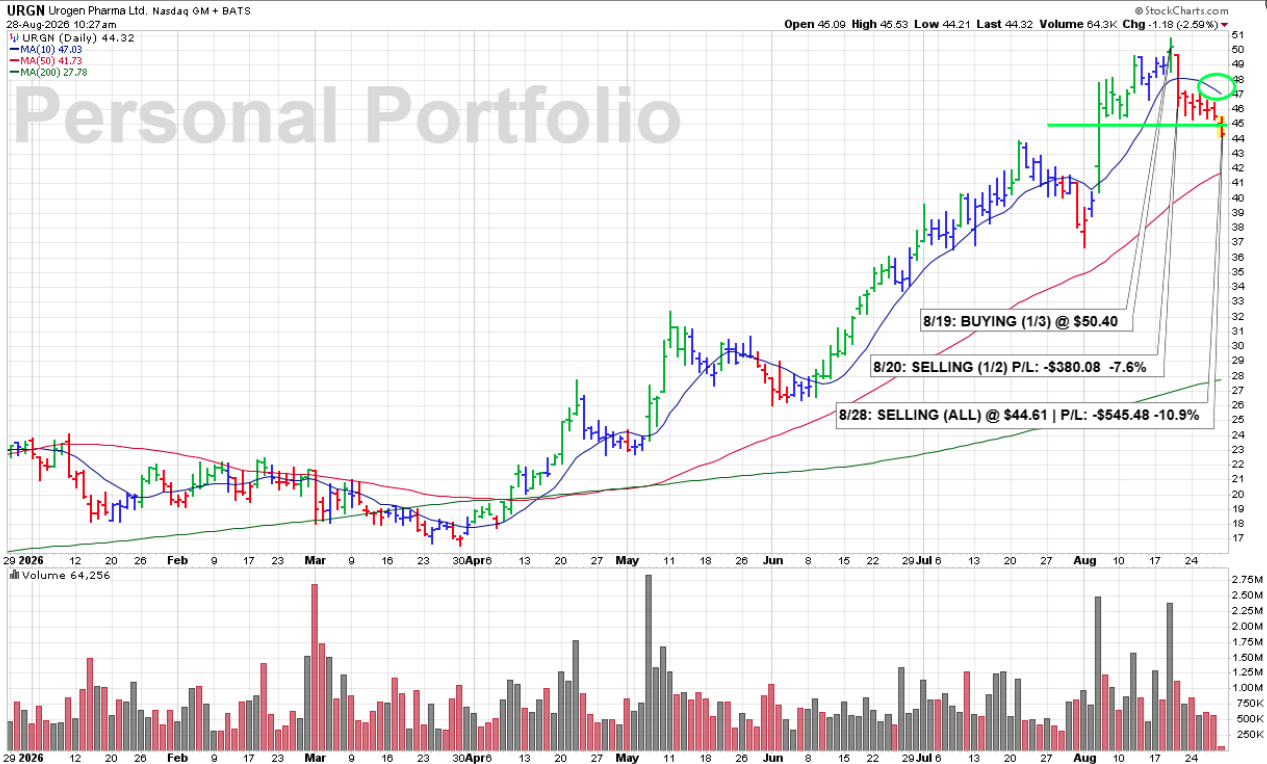
9:44 AM – Selling the back half of my URGN position here this morning and exiting the stock completely. After first breaking below the 10 DMA on 8/20, which triggered our 1ST SELL SIGNAL, shares are now falling below the ROUND-$45 level while the 10 DMA continues to roll over. Those are additional bearish technical signs, and I’m not willing to ignore the continued deterioration.
James’ Trader’s Tip: Weakness Often Builds in Stages
• The initial break below the 10 DMA was the first warning that short-term momentum had changed.
• Losing the ROUND-$45 level adds another technical violation.
• A rolling-over 10 DMA reinforces the bearish trend and supports getting completely out when weakness continues to build.
CLICK/TAP CHART TO ZOOM
Chart services courtesy of stockcharts.com. Annotations by James Taulman.
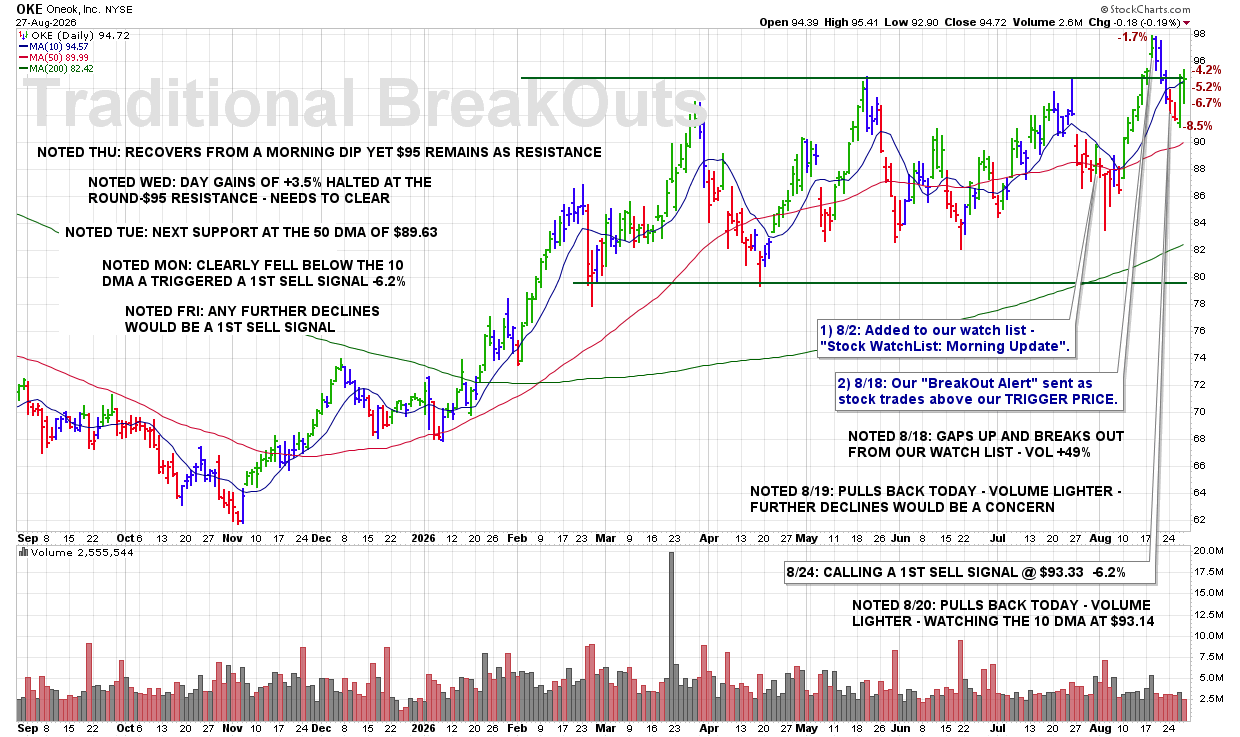
8:30 PM – Here is our latest chart update for this recent breakout from our Traditional BreakOuts Watch List.
CLICK/TAP CHART TO ZOOM
Chart services courtesy of stockcharts.com. Annotations by James Taulman.
We are currently reporting on this stock as an active holding and continue to monitor the stock closely for any technical SELL SIGNALS.
The focus always remains on price/volume action around key support levels, including the 10 DMA, 50 DMA, and any nearby trendline or ROUND-$ support.
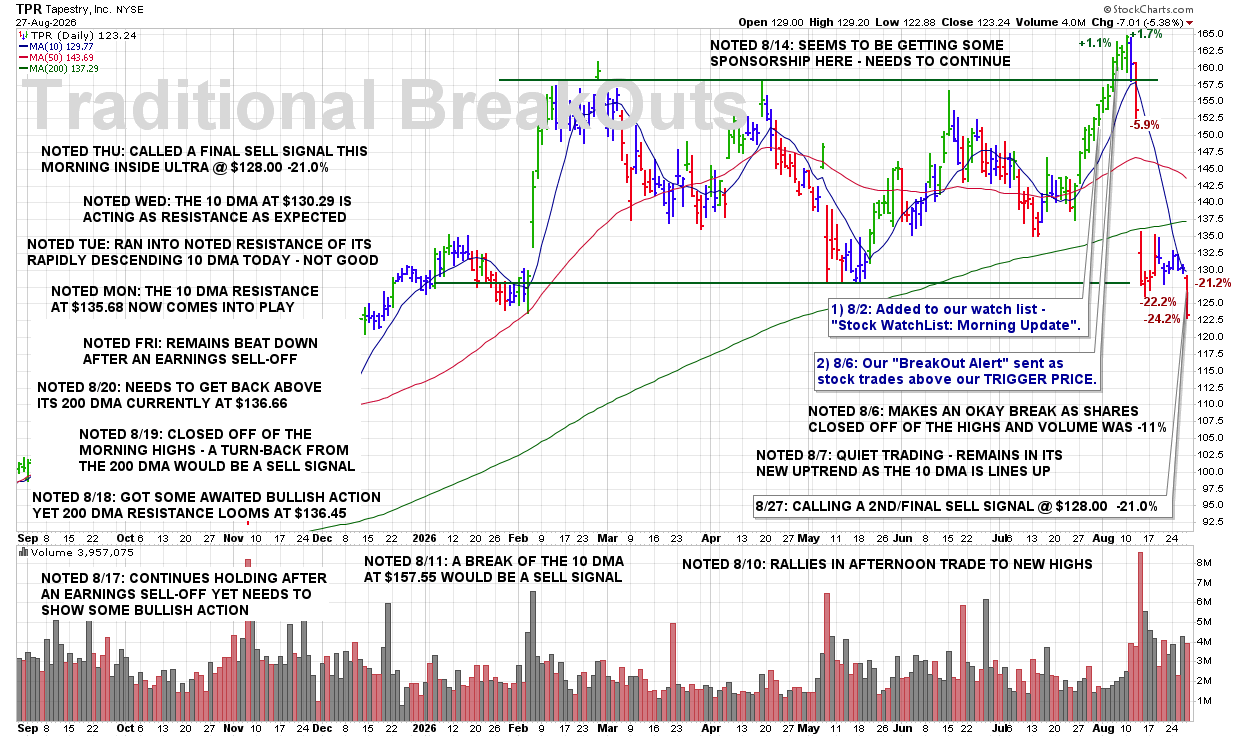
8:25 PM – Here is our latest chart update for this recent breakout from our Traditional BreakOuts Watch List.
CLICK/TAP CHART TO ZOOM
Chart services courtesy of stockcharts.com. Annotations by James Taulman.
We are currently reporting on this stock as an active holding and continue to monitor the stock closely for any technical SELL SIGNALS.
The focus always remains on price/volume action around key support levels, including the 10 DMA, 50 DMA, and any nearby trendline or ROUND-$ support.
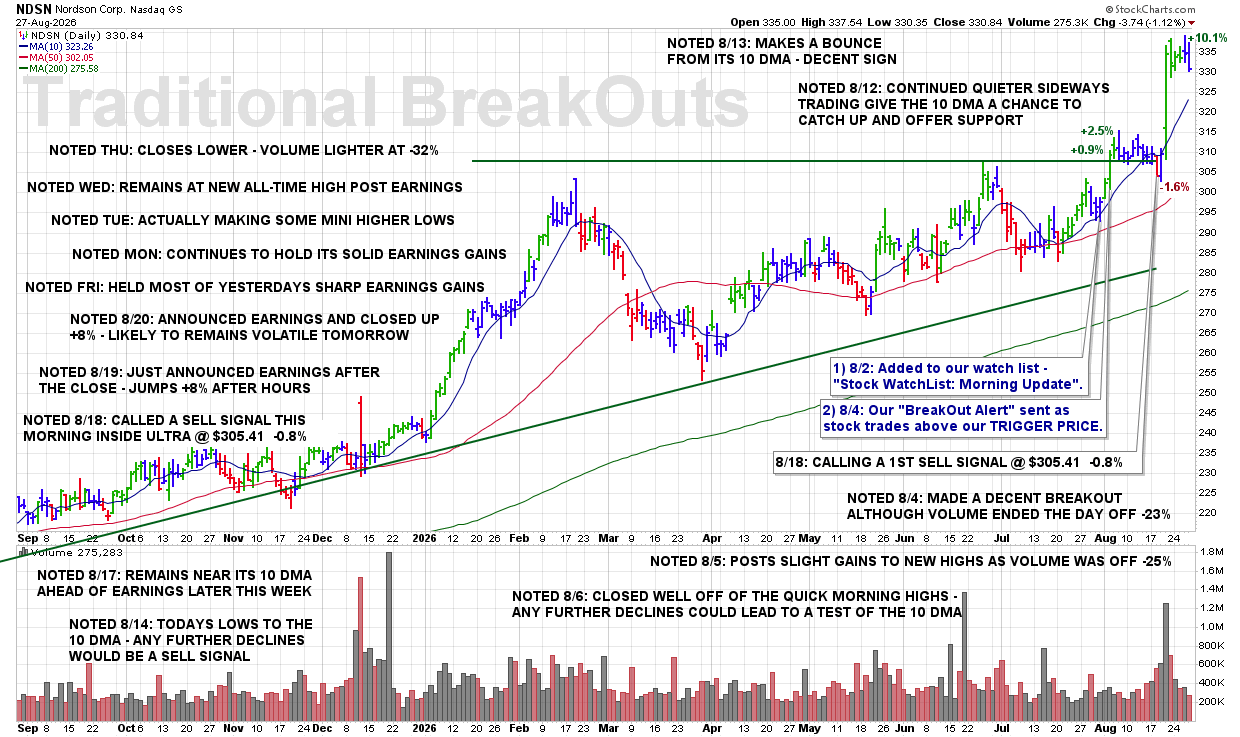
8:20 PM – Here is our latest chart update for this recent breakout from our Traditional BreakOuts Watch List
CLICK/TAP CHART TO ZOOM
Chart services courtesy of stockcharts.com. Annotations by James Taulman.
We are currently reporting on this stock as an active holding and continue to monitor the stock closely for any technical SELL SIGNALS.
The focus always remains on price/volume action around key support levels, including the 10 DMA, 50 DMA, and any nearby trendline or ROUND-$ support.
8:15 PM – Here is our latest chart update for this recent breakout from our Traditional BreakOuts Watch List
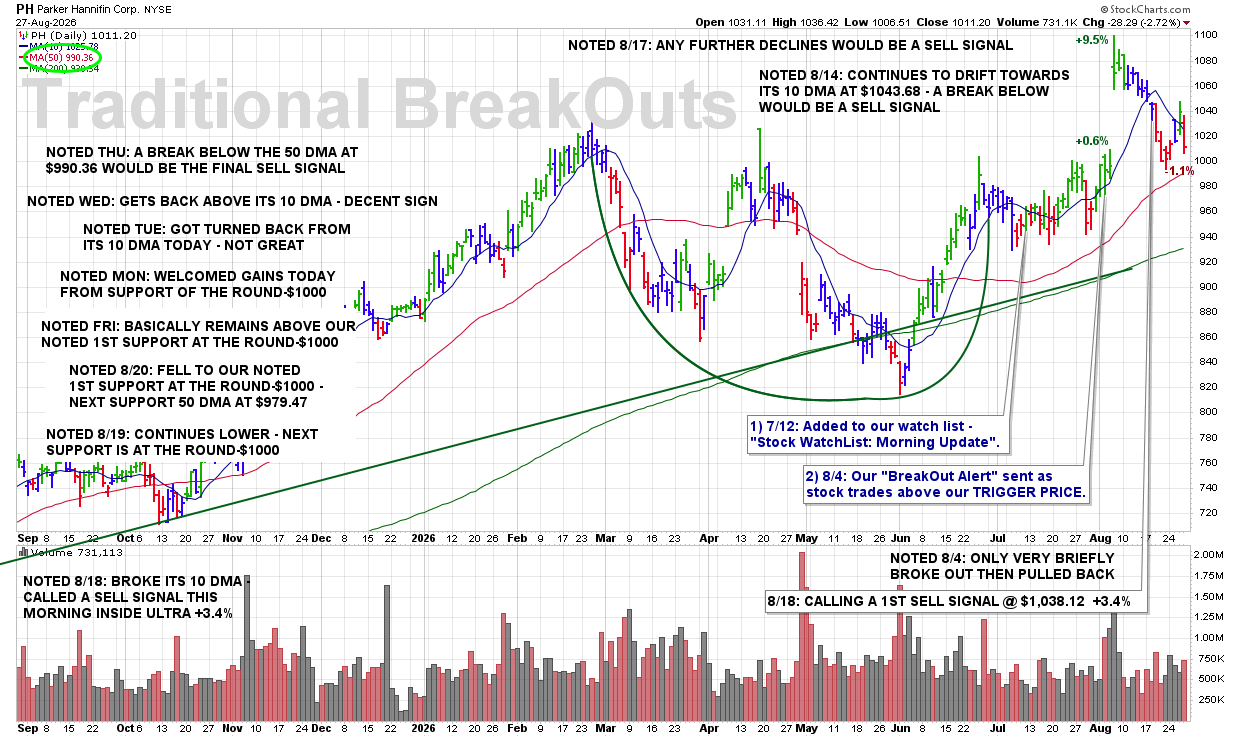
CLICK/TAP CHART TO ZOOM
Chart services courtesy of stockcharts.com. Annotations by James Taulman.
We are currently reporting on this stock as an active holding and continue to monitor the stock closely for any technical SELL SIGNALS.
The focus always remains on price/volume action around key support levels, including the 10 DMA, 50 DMA, and any nearby trendline or ROUND-$ support.
8:10 PM – Here is our latest chart update for this recent breakout from our Traditional BreakOuts Watch List.
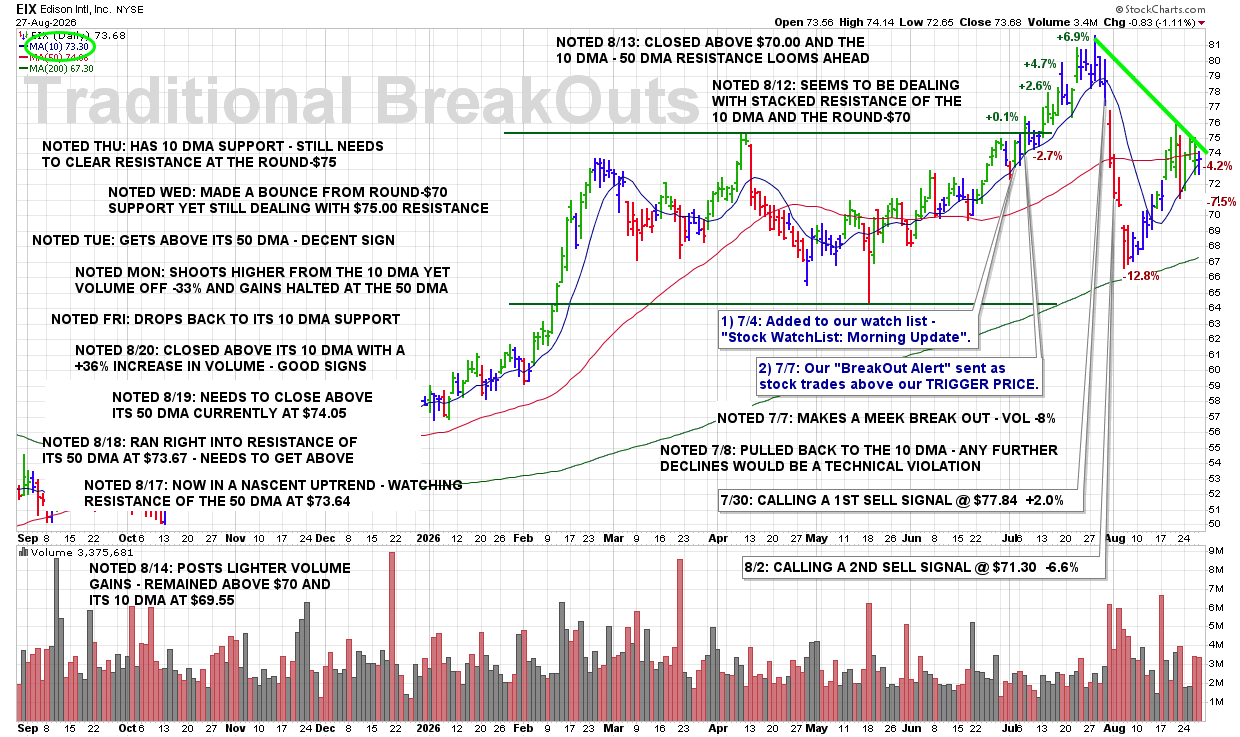
CLICK/TAP CHART TO ZOOM
Chart services courtesy of stockcharts.com. Annotations by James Taulman.
We are currently reporting on this stock as an active holding and continue to monitor the stock closely for any technical SELL SIGNALS.
The focus always remains on price/volume action around key support levels, including the 10 DMA, 50 DMA, and any nearby trendline or ROUND-$ support.
8:05 PM – Here is our latest chart update for this recent breakout from our Traditional BreakOuts Watch List.
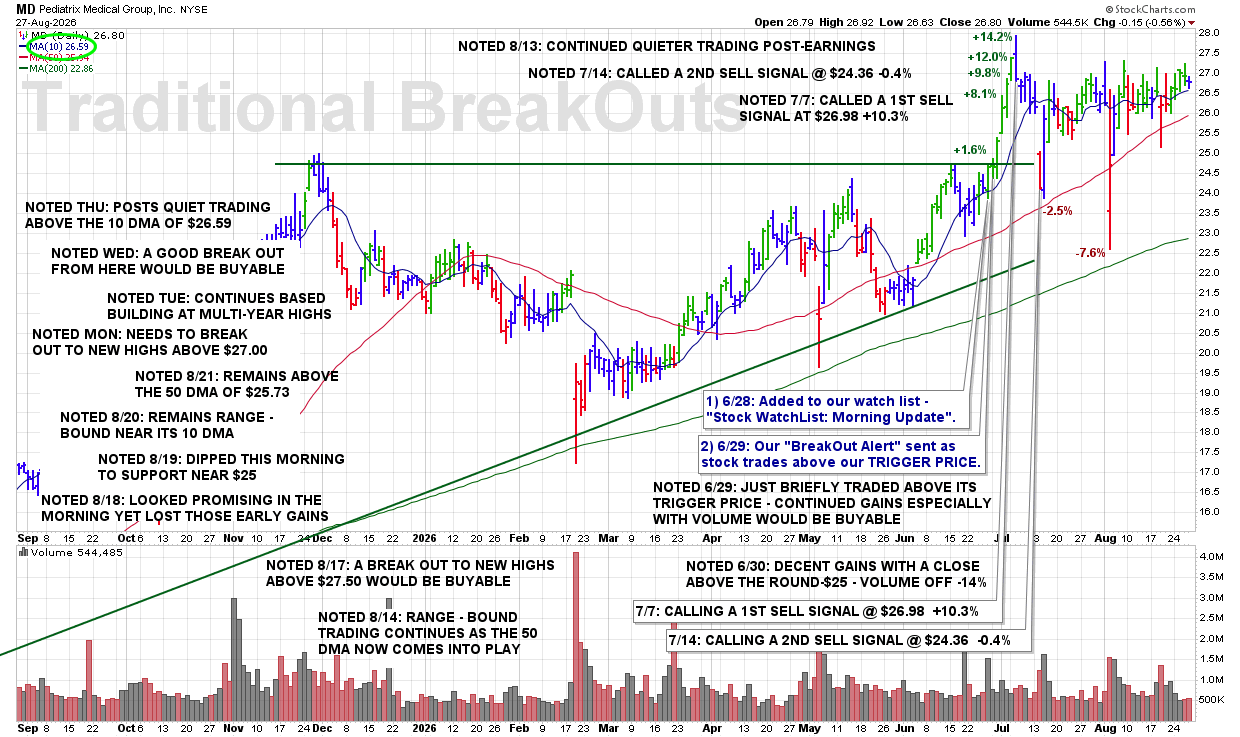
CLICK/TAP CHART TO ZOOM
Chart services courtesy of stockcharts.com. Annotations by James Taulman.
We are currently reporting on this stock as an active holding and continue to monitor the stock closely for any technical SELL SIGNALS.
The focus always remains on price/volume action around key support levels, including the 10 DMA, 50 DMA, and any nearby trendline or ROUND-$ support.
8:00 PM – Here is our latest chart update for this recent breakout from our Traditional BreakOuts Watch List.
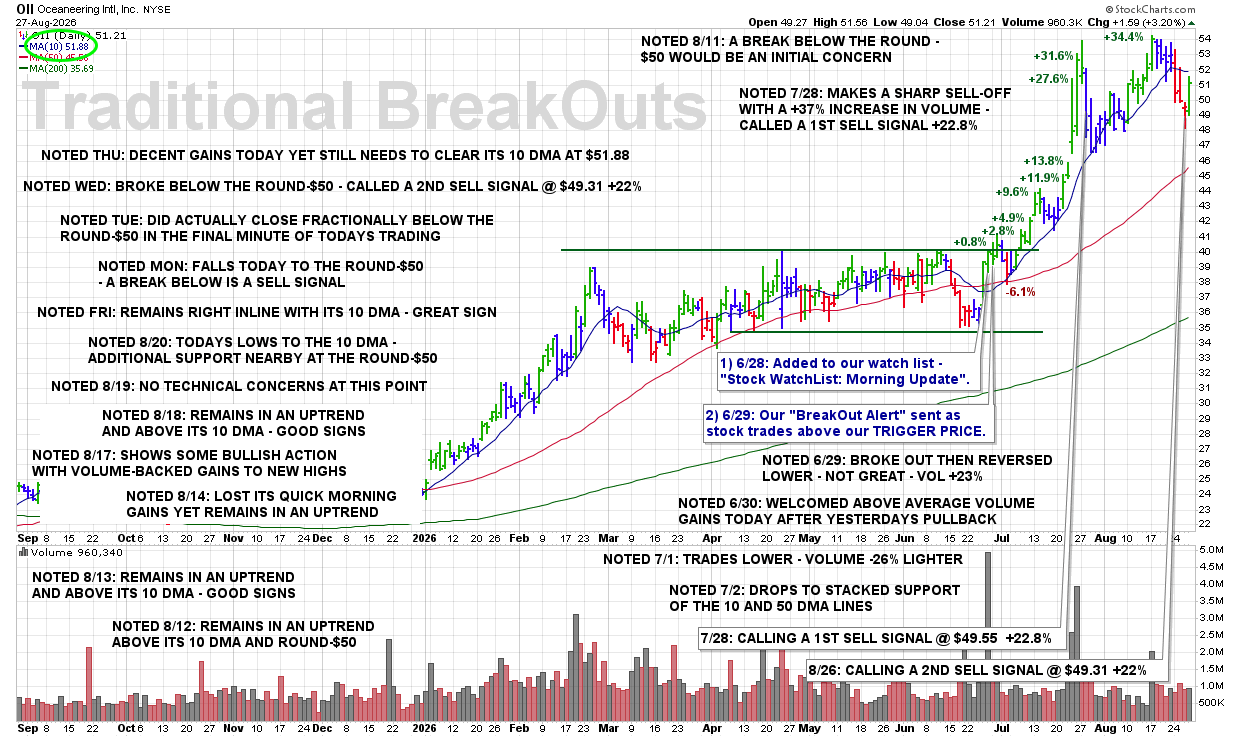
CLICK/TAP CHART TO ZOOM
Chart services courtesy of stockcharts.com. Annotations by James Taulman.
We are currently reporting on this stock as an active holding and continue to monitor the stock closely for any technical SELL SIGNALS.
The focus always remains on price/volume action around key support levels, including the 10 DMA, 50 DMA, and any nearby trendline or ROUND-$ support.
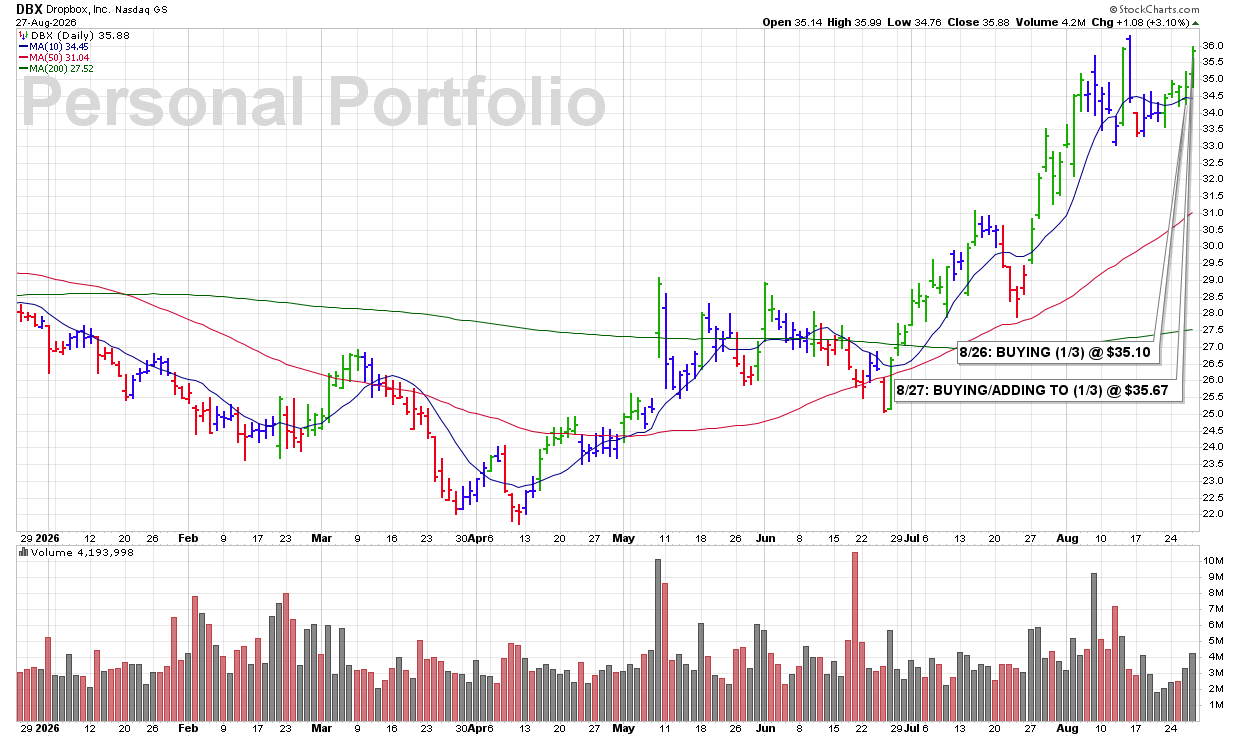
12:29 PM – Adding another 1/3 to my DBX position this afternoon as shares continue to show bullish technical action. The stock is pushing higher, although there is some near-term resistance at the ROUND-$36 level. A decisive move above $36 would provide additional bullish confirmation. This addition brings my total position to 2/3.
James’ Trader’s Tip: Add as the Stock Proves Itself
• Scaling into a position allows the stock to demonstrate additional strength before committing more capital.
• Nearby resistance gives us a clear technical level to monitor.
• A strong break above the ROUND-$36 level would confirm that buyers are successfully overcoming that final small area of resistance.
CLICK/TAP CHART TO ZOOM
Chart services courtesy of stockcharts.com. Annotations by James Taulman.
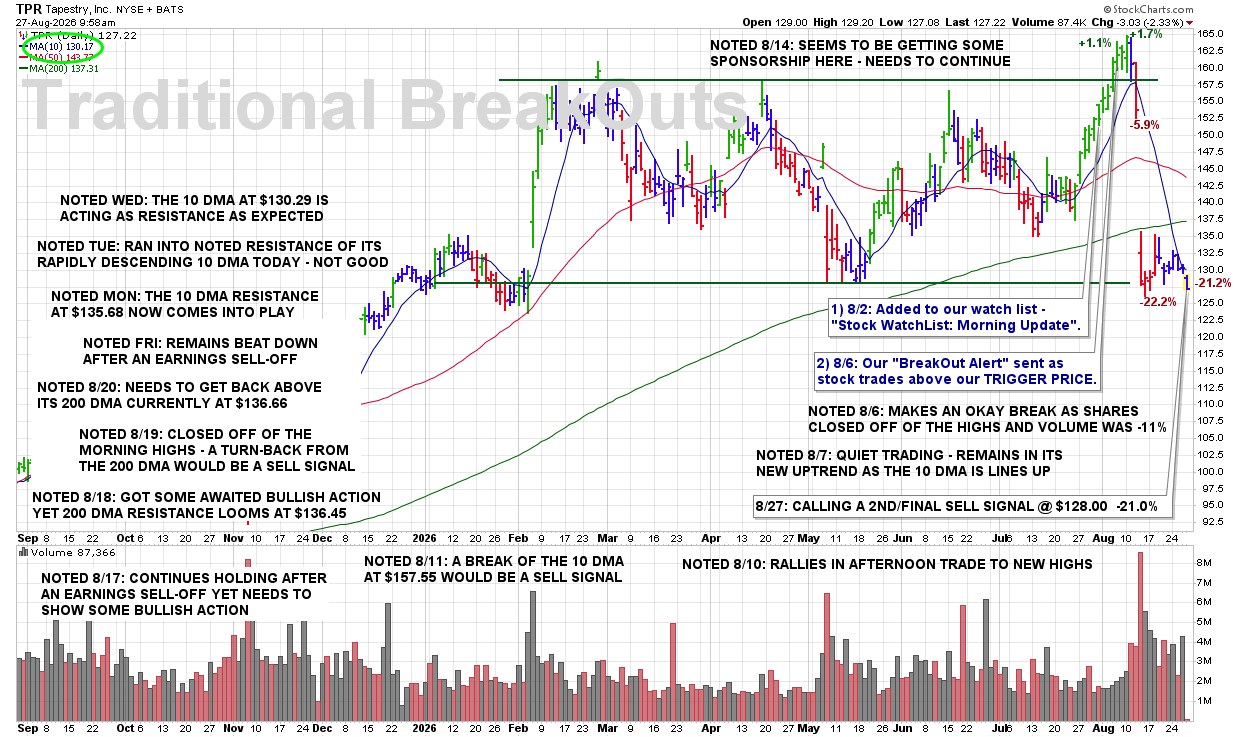
9:41 AM – Calling a 2ND and FINAL SELL SIGNAL after the stock was hit roughly 20% on earnings and has failed to develop any meaningful recovery. Shares are now being turned back from the 10 DMA, which has become the first level of resistance. Additional overhead resistance remains at the 200 DMA near $132.64, followed by the ROUND-$140 level and then the 50 DMA near $144.63. With significant technical damage and multiple layers of resistance overhead, we’re closing out coverage on this selection.
ULTRA Trader’s Tip: Former Support Can Become Resistance
• After a major breakdown, the 10 DMA can shift from support to the stock’s first resistance level.
• Multiple layers of overhead resistance make a meaningful recovery increasingly difficult.
• When a damaged stock repeatedly fails to recover, respect the technical evidence and move on.
CLICK/TAP CHART TO ZOOM
Chart services courtesy of stockcharts.com. Annotations by James Taulman.
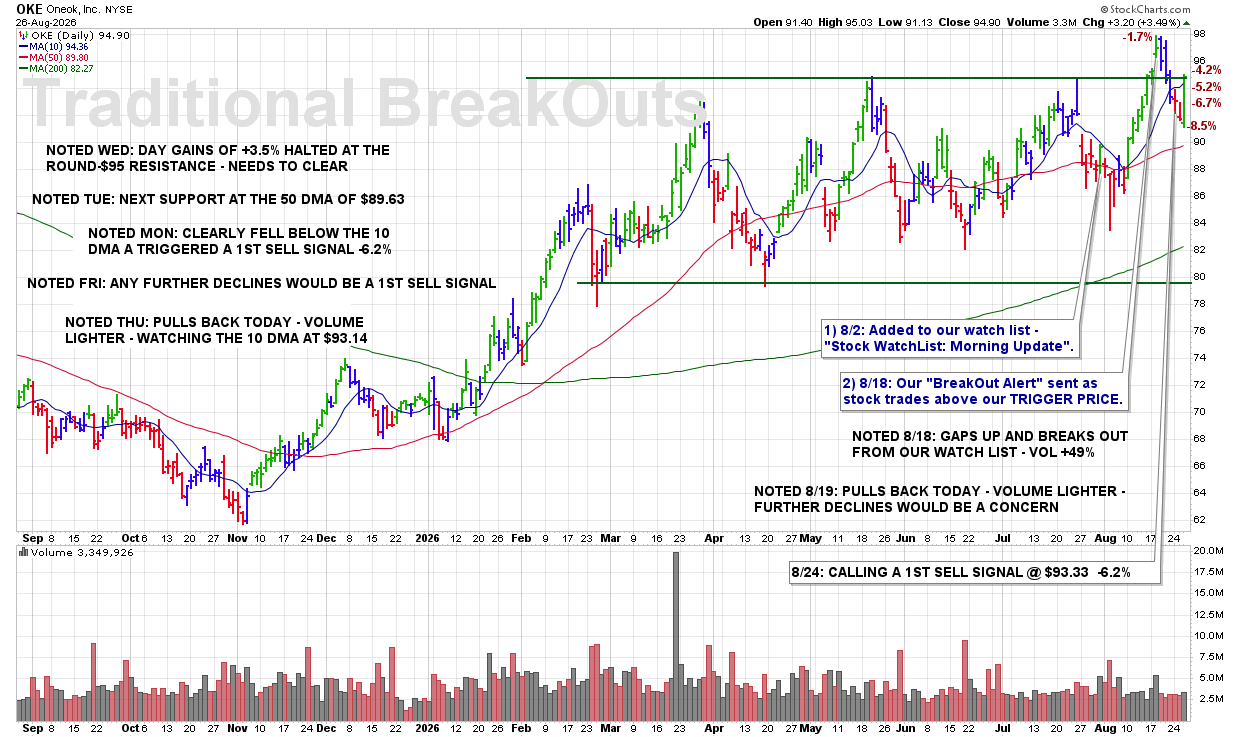
9:00 PM – Here is our latest chart update for this recent breakout from our Traditional BreakOuts Watch List.
CLICK/TAP CHART TO ZOOM
Chart services courtesy of stockcharts.com. Annotations by James Taulman.
We are currently reporting on this stock as an active holding and continue to monitor the stock closely for any technical SELL SIGNALS.
The focus always remains on price/volume action around key support levels, including the 10 DMA, 50 DMA, and any nearby trendline or ROUND-$ support.
8:55 PM – Here is our latest chart update for this recent breakout from our Traditional BreakOuts Watch List.

CLICK/TAP CHART TO ZOOM
Chart services courtesy of stockcharts.com. Annotations by James Taulman.
We are currently reporting on this stock as an active holding and continue to monitor the stock closely for any technical SELL SIGNALS.
The focus always remains on price/volume action around key support levels, including the 10 DMA, 50 DMA, and any nearby trendline or ROUND-$ support.
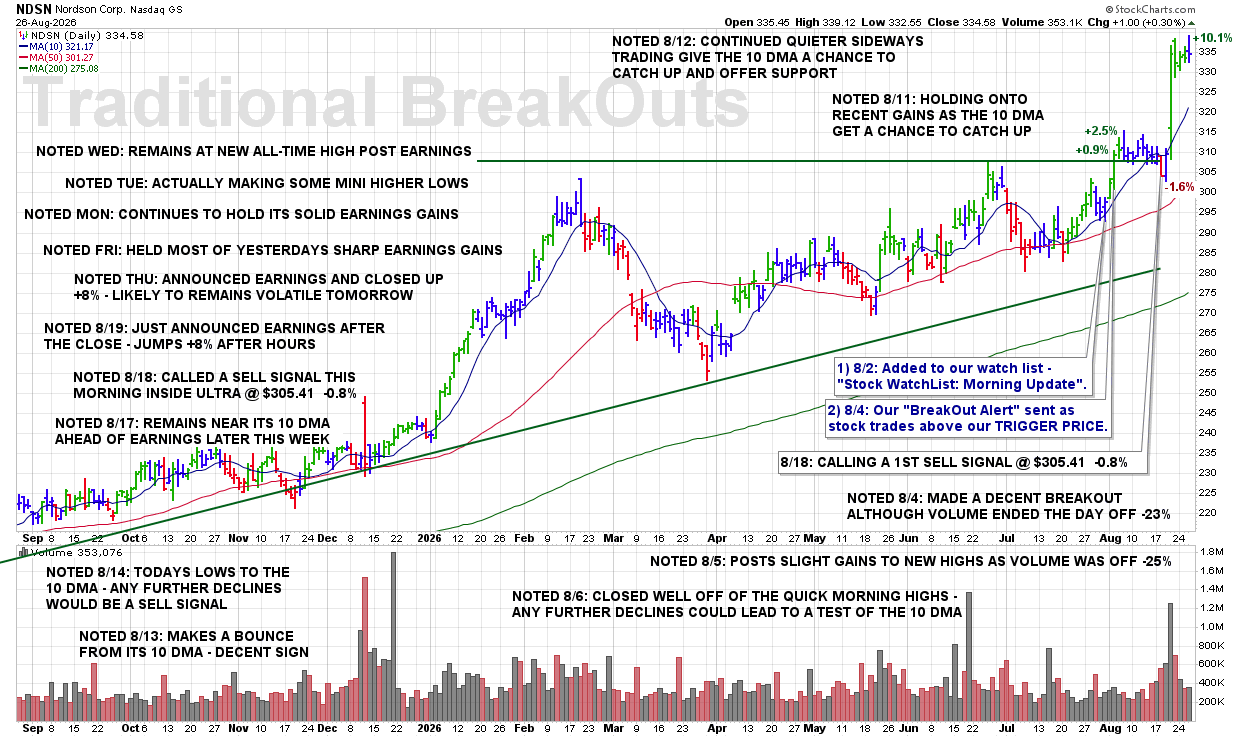
8:50 PM – Here is our latest chart update for this recent breakout from our Traditional BreakOuts Watch List
CLICK/TAP CHART TO ZOOM
Chart services courtesy of stockcharts.com. Annotations by James Taulman.
We are currently reporting on this stock as an active holding and continue to monitor the stock closely for any technical SELL SIGNALS.
The focus always remains on price/volume action around key support levels, including the 10 DMA, 50 DMA, and any nearby trendline or ROUND-$ support.
8:45 PM – Here is our latest chart update for this recent breakout from our Traditional BreakOuts Watch List
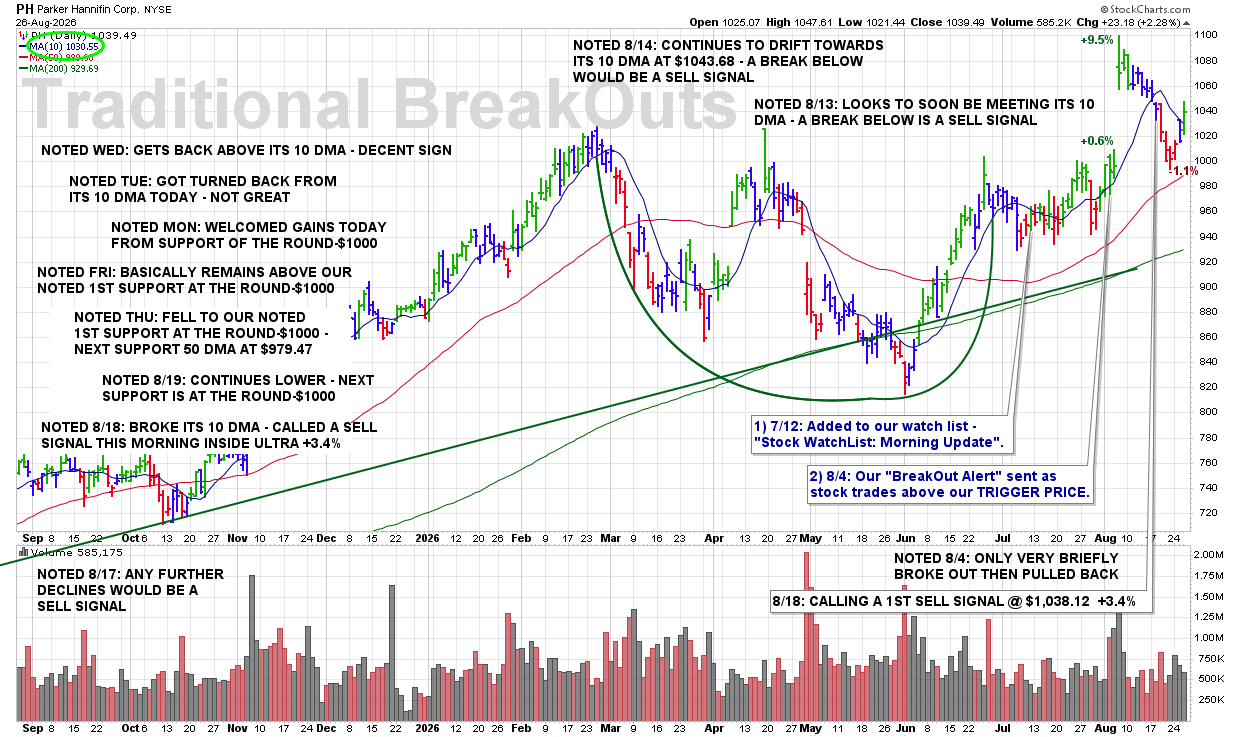
CLICK/TAP CHART TO ZOOM
Chart services courtesy of stockcharts.com. Annotations by James Taulman.
We are currently reporting on this stock as an active holding and continue to monitor the stock closely for any technical SELL SIGNALS.
The focus always remains on price/volume action around key support levels, including the 10 DMA, 50 DMA, and any nearby trendline or ROUND-$ support.
8:40 PM – Here is our latest chart update for this recent breakout from our Traditional BreakOuts Watch List.
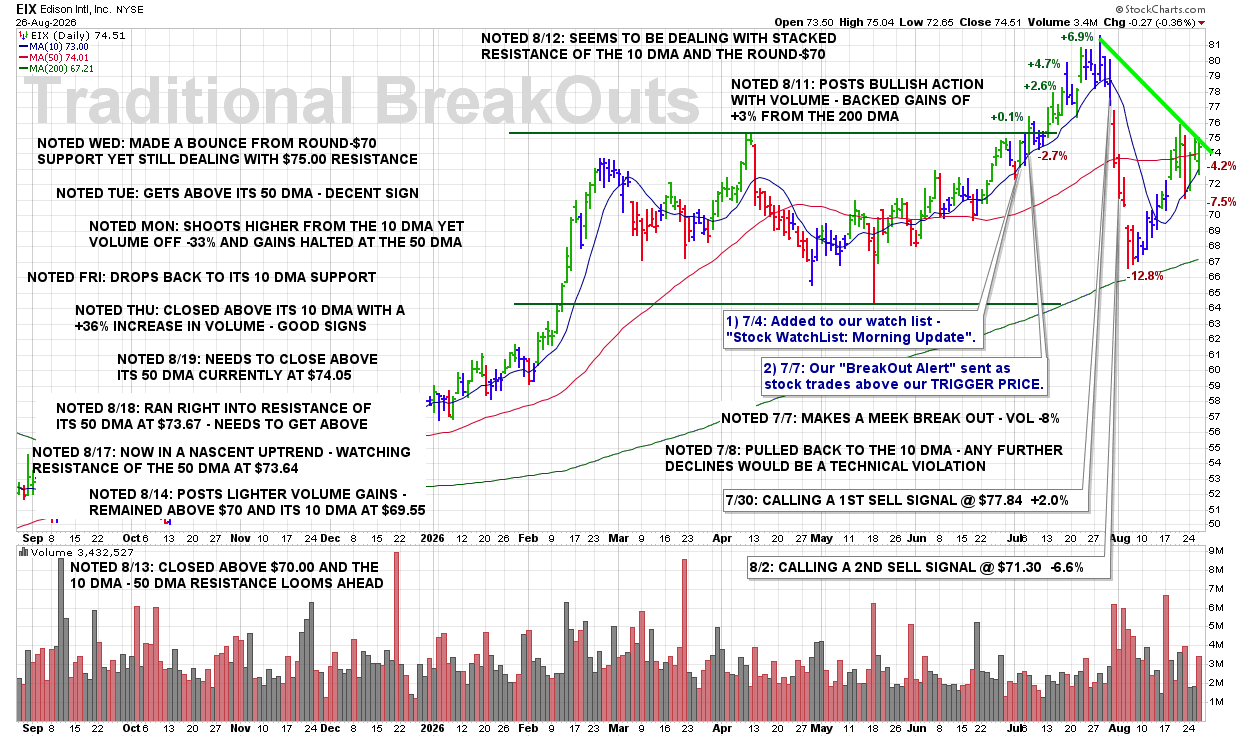
CLICK/TAP CHART TO ZOOM
Chart services courtesy of stockcharts.com. Annotations by James Taulman.
We are currently reporting on this stock as an active holding and continue to monitor the stock closely for any technical SELL SIGNALS.
The focus always remains on price/volume action around key support levels, including the 10 DMA, 50 DMA, and any nearby trendline or ROUND-$ support.
8:35 PM – Here is our latest chart update for this recent breakout from our Traditional BreakOuts Watch List.
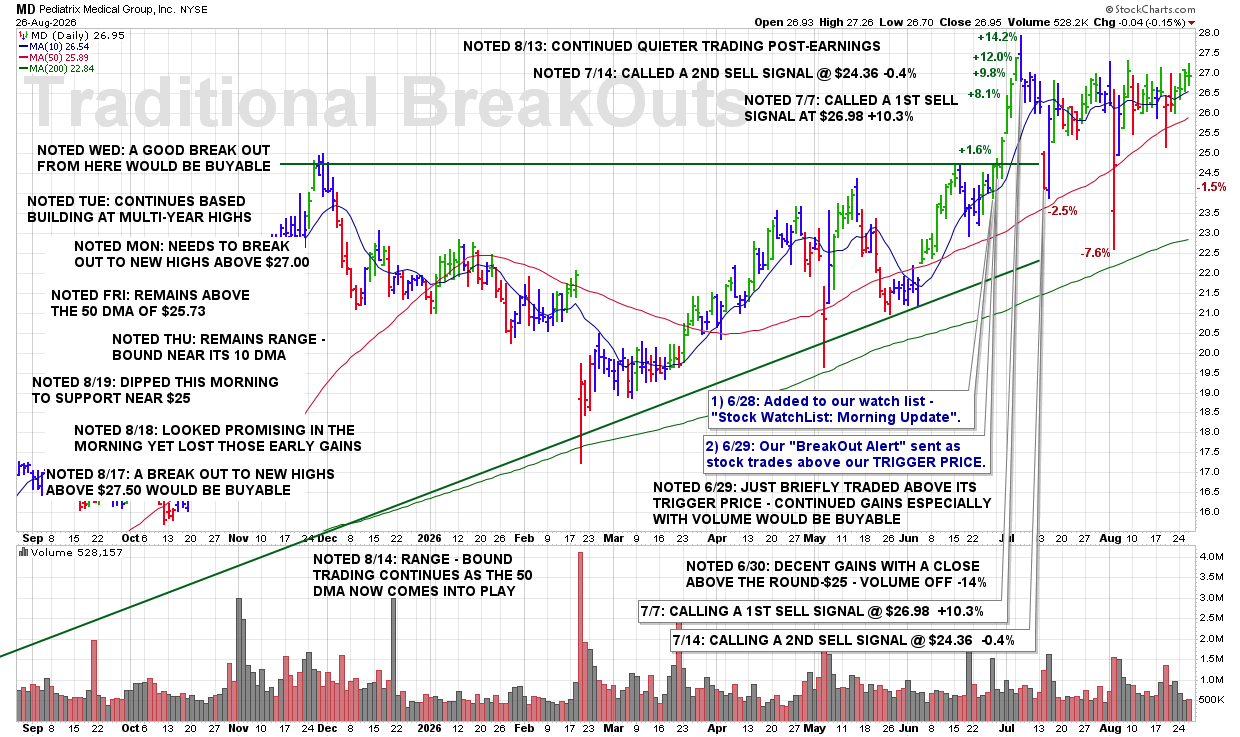
CLICK/TAP CHART TO ZOOM
Chart services courtesy of stockcharts.com. Annotations by James Taulman.
We are currently reporting on this stock as an active holding and continue to monitor the stock closely for any technical SELL SIGNALS.
The focus always remains on price/volume action around key support levels, including the 10 DMA, 50 DMA, and any nearby trendline or ROUND-$ support.
8:30 PM – Here is our latest chart update for this recent breakout from our Traditional BreakOuts Watch List.
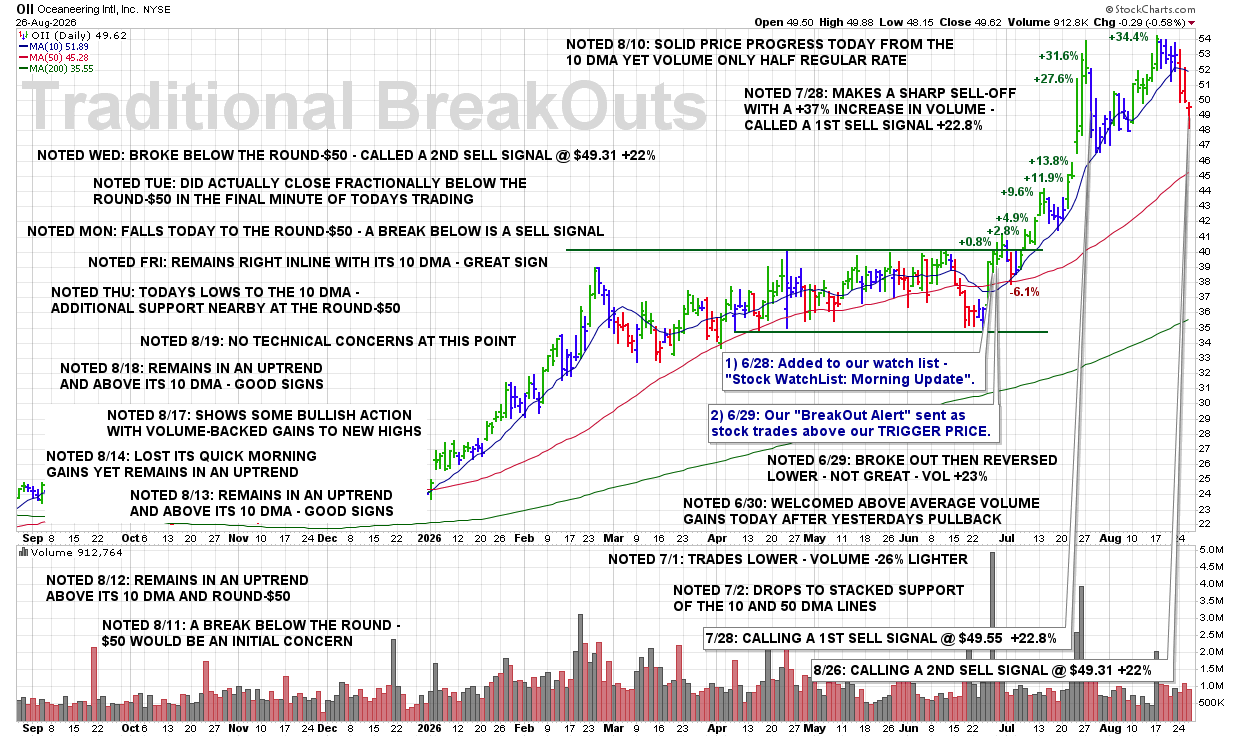
CLICK/TAP CHART TO ZOOM
Chart services courtesy of stockcharts.com. Annotations by James Taulman.
We are currently reporting on this stock as an active holding and continue to monitor the stock closely for any technical SELL SIGNALS.
The focus always remains on price/volume action around key support levels, including the 10 DMA, 50 DMA, and any nearby trendline or ROUND-$ support.
3:35 PM – Calling a 2ND SELL SIGNAL here before the close as shares continue to deteriorate technically. After recently breaking below the 10 DMA, the stock is now falling below our previously noted support at the ROUND-$50 level. That represents another technical violation under our rules.
ULTRA Trader’s Tip: One Violation Can Lead to the Next
• Losing the 10 DMA is often the first indication that short-term momentum is weakening.
• A subsequent break of another identified support level confirms that the weakness is continuing.
• Scaling out as technical violations accumulate allows you to systematically protect a substantial winner like this +22.2% gain.
CLICK/TAP CHART TO ZOOM
Chart services courtesy of stockcharts.com. Annotations by James Taulman.
10:04 AM – Picking up a 1/3 position in this Computer Software-Database stock as shares trade higher from the 10 DMA while volume is currently running 38% above average. That combination of support at the 10 DMA, advancing price, and increased volume gives me a technical BUY SIGNAL.
James’ Trader’s Tip: Volume Helps Confirm Support
• An advance from the 10 DMA shows that buyers are defending an important short-term support level.
• Above-average volume adds conviction to the move by showing stronger-than-normal demand.
• When price and volume improve together, the technical setup becomes more compelling.

CLICK/TAP CHART TO ZOOM
Chart services courtesy of stockcharts.com. Annotations by James Taulman.
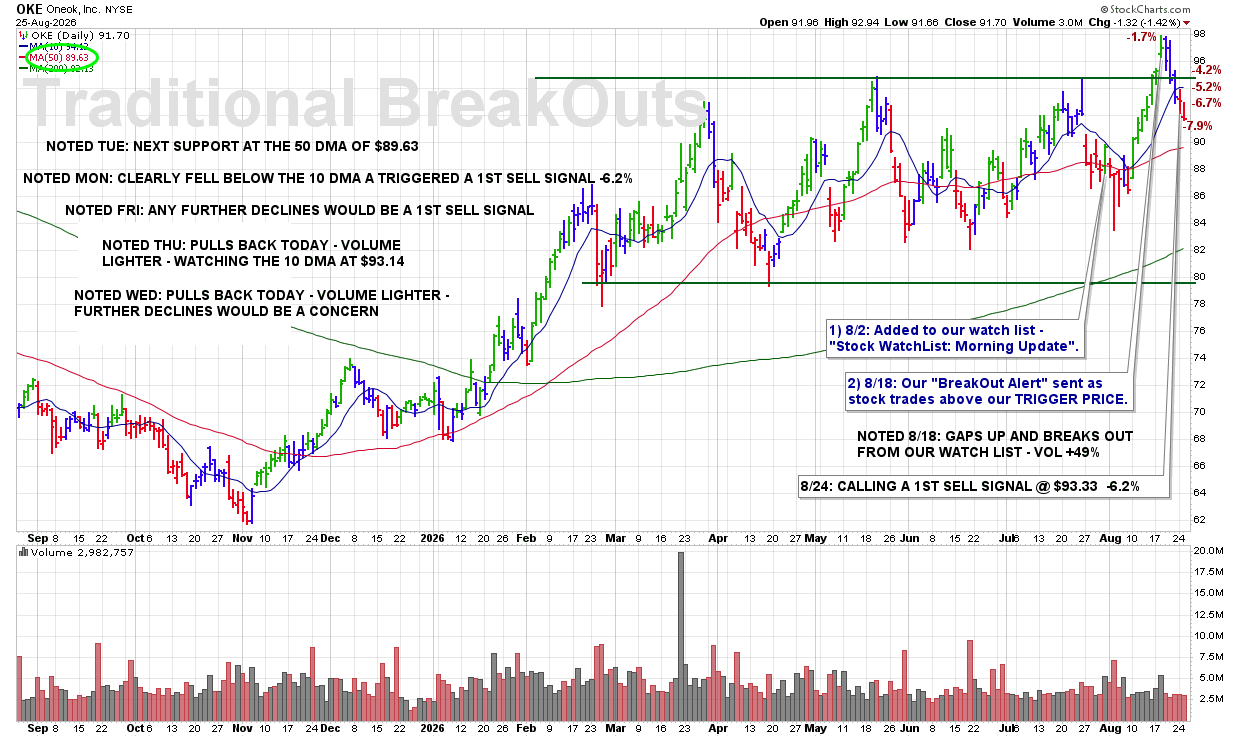
8:30 PM – Here is our latest chart update for this recent breakout from our Traditional BreakOuts Watch List.
CLICK/TAP CHART TO ZOOM
Chart services courtesy of stockcharts.com. Annotations by James Taulman.
We are currently reporting on this stock as an active holding and continue to monitor the stock closely for any technical SELL SIGNALS.
The focus always remains on price/volume action around key support levels, including the 10 DMA, 50 DMA, and any nearby trendline or ROUND-$ support.
8:25 PM – Here is our latest chart update for this recent breakout from our Traditional BreakOuts Watch List.

CLICK/TAP CHART TO ZOOM
Chart services courtesy of stockcharts.com. Annotations by James Taulman.
We are currently reporting on this stock as an active holding and continue to monitor the stock closely for any technical SELL SIGNALS.
The focus always remains on price/volume action around key support levels, including the 10 DMA, 50 DMA, and any nearby trendline or ROUND-$ support.
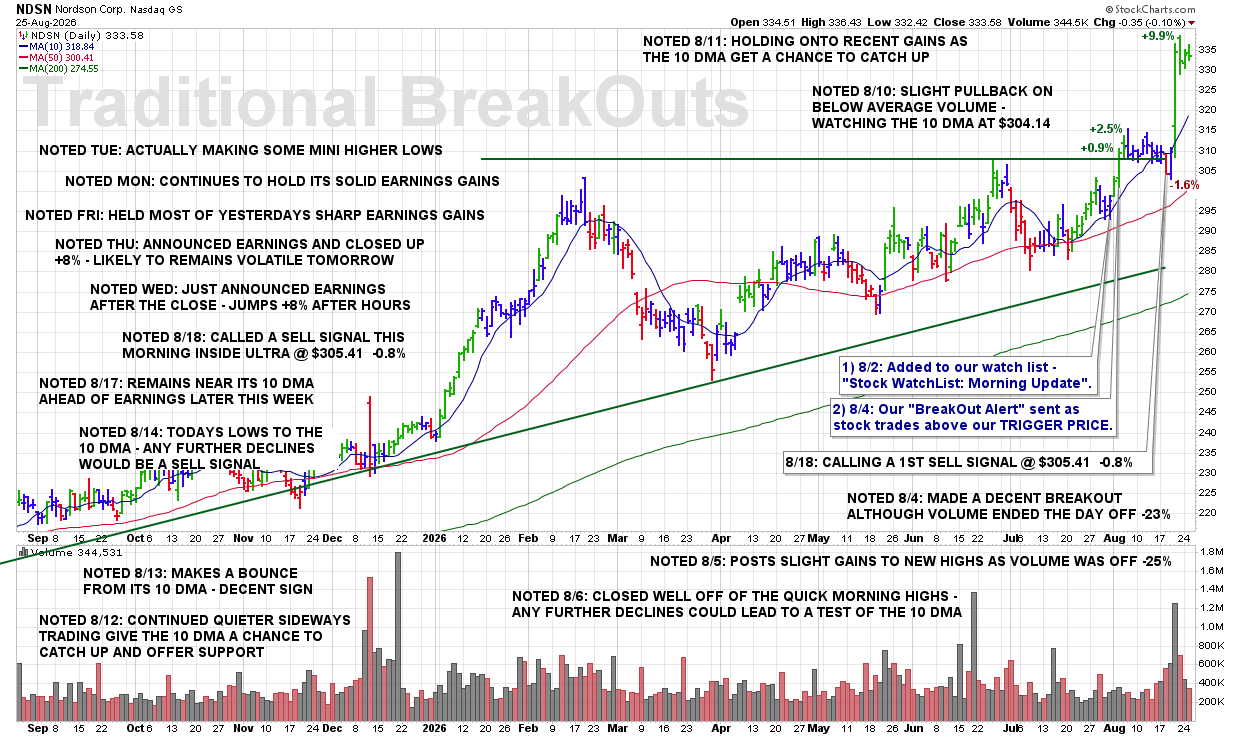
8:20 PM – Here is our latest chart update for this recent breakout from our Traditional BreakOuts Watch List
CLICK/TAP CHART TO ZOOM
Chart services courtesy of stockcharts.com. Annotations by James Taulman.
We are currently reporting on this stock as an active holding and continue to monitor the stock closely for any technical SELL SIGNALS.
The focus always remains on price/volume action around key support levels, including the 10 DMA, 50 DMA, and any nearby trendline or ROUND-$ support.
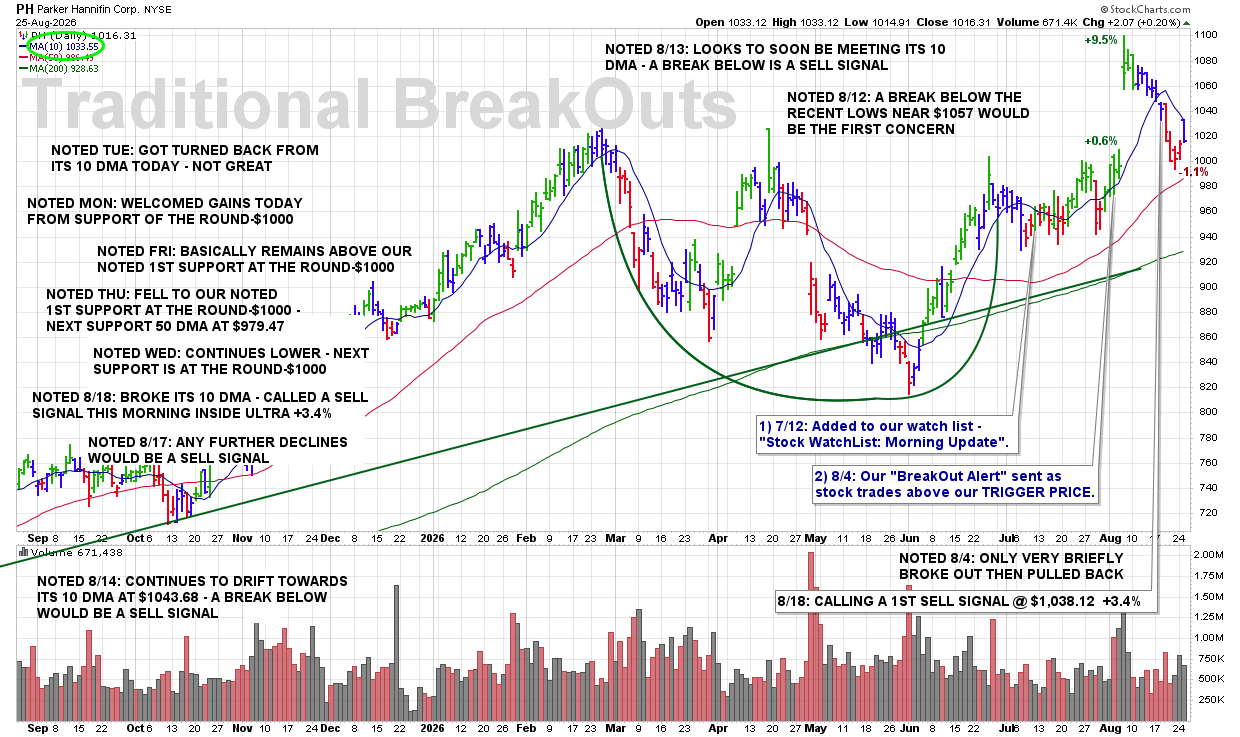
8:15 PM – Here is our latest chart update for this recent breakout from our Traditional BreakOuts Watch List
CLICK/TAP CHART TO ZOOM
Chart services courtesy of stockcharts.com. Annotations by James Taulman.
We are currently reporting on this stock as an active holding and continue to monitor the stock closely for any technical SELL SIGNALS.
The focus always remains on price/volume action around key support levels, including the 10 DMA, 50 DMA, and any nearby trendline or ROUND-$ support.
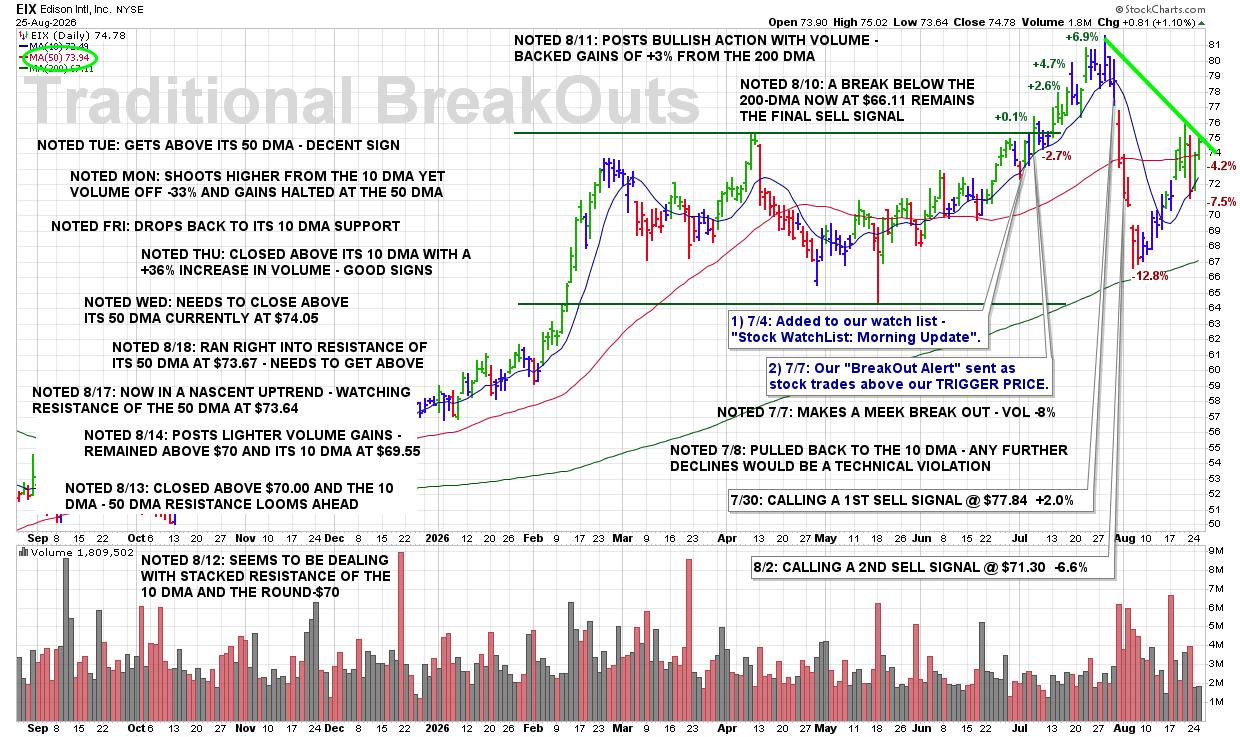
8:10 PM – Here is our latest chart update for this recent breakout from our Traditional BreakOuts Watch List.
CLICK/TAP CHART TO ZOOM
Chart services courtesy of stockcharts.com. Annotations by James Taulman.
We are currently reporting on this stock as an active holding and continue to monitor the stock closely for any technical SELL SIGNALS.
The focus always remains on price/volume action around key support levels, including the 10 DMA, 50 DMA, and any nearby trendline or ROUND-$ support.
8:05 PM – Here is our latest chart update for this recent breakout from our Traditional BreakOuts Watch List.
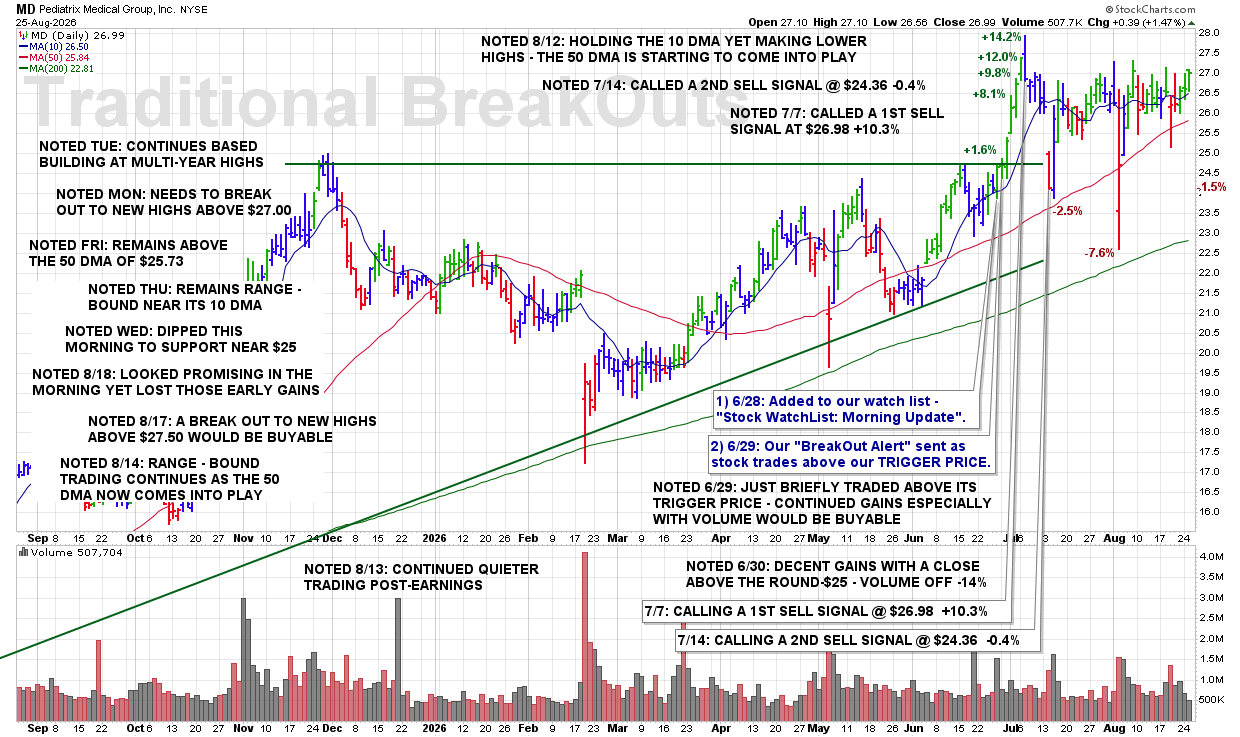
CLICK/TAP CHART TO ZOOM
Chart services courtesy of stockcharts.com. Annotations by James Taulman.
We are currently reporting on this stock as an active holding and continue to monitor the stock closely for any technical SELL SIGNALS.
The focus always remains on price/volume action around key support levels, including the 10 DMA, 50 DMA, and any nearby trendline or ROUND-$ support.
8:00 PM – Here is our latest chart update for this recent breakout from our Traditional BreakOuts Watch List.
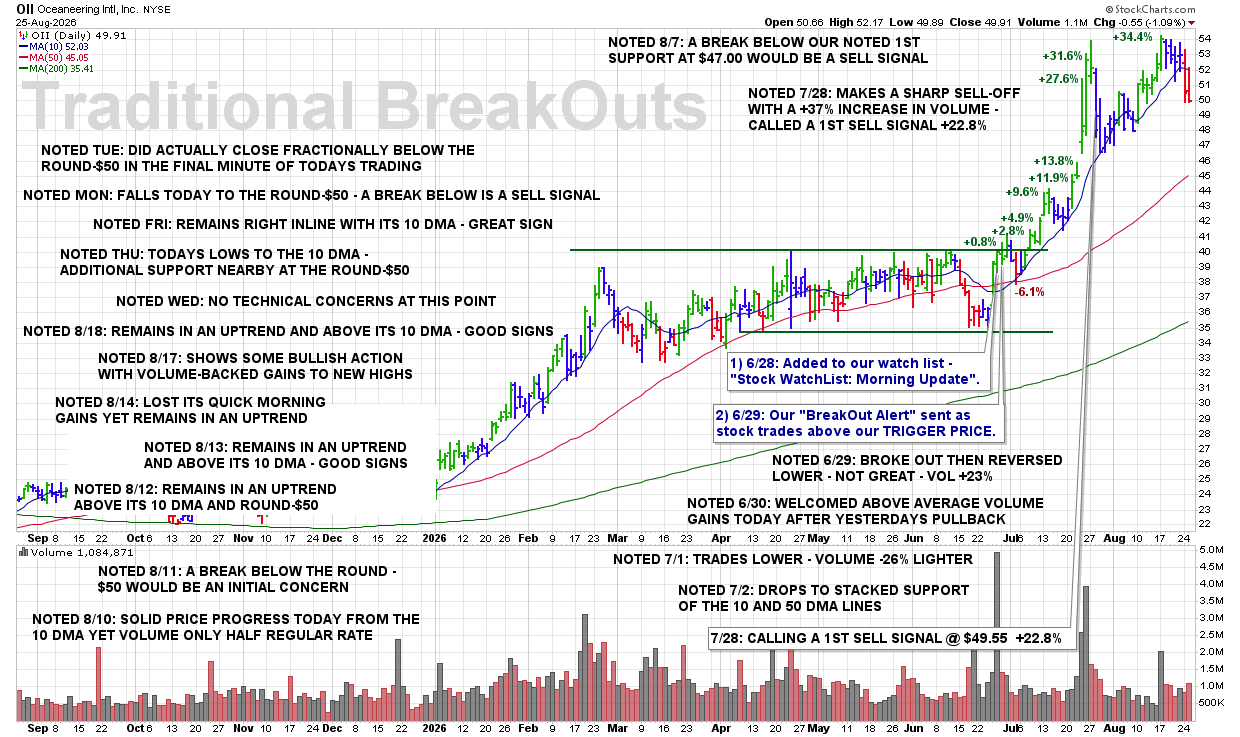
CLICK/TAP CHART TO ZOOM
Chart services courtesy of stockcharts.com. Annotations by James Taulman.
We are currently reporting on this stock as an active holding and continue to monitor the stock closely for any technical SELL SIGNALS.
The focus always remains on price/volume action around key support levels, including the 10 DMA, 50 DMA, and any nearby trendline or ROUND-$ support.
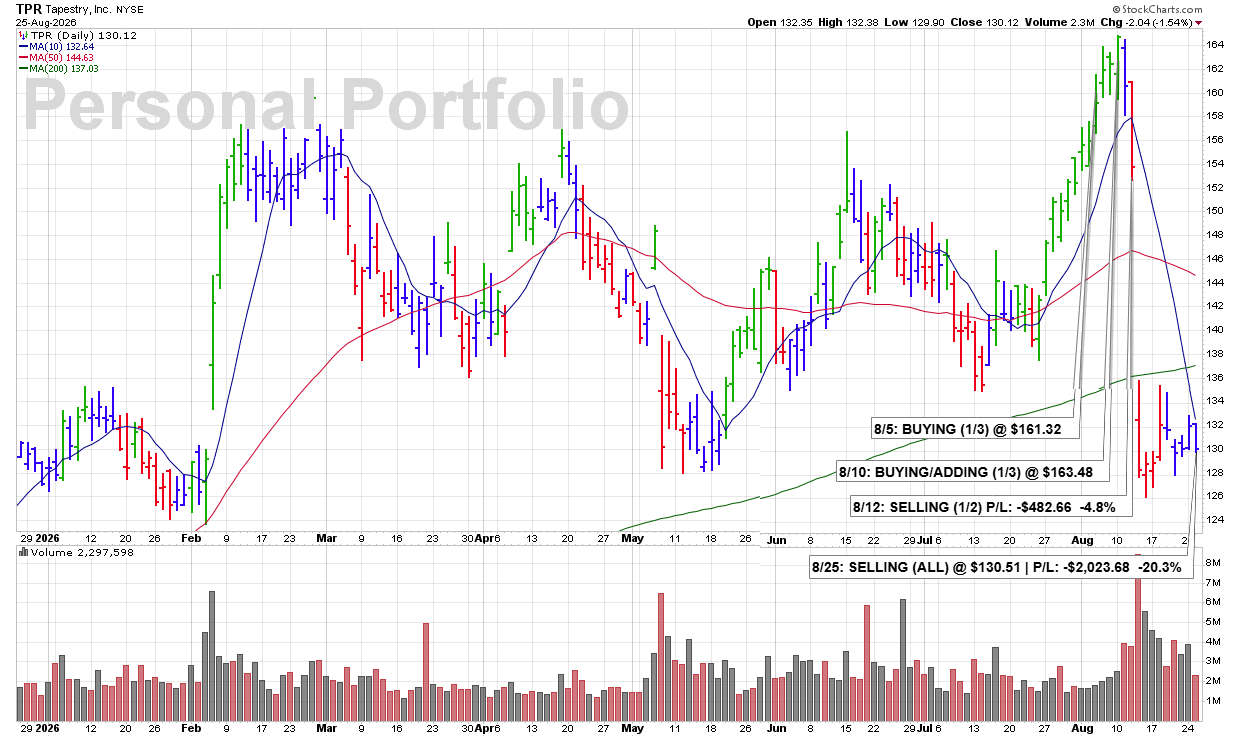
3:34 PM – Selling all my TPR here after getting hit roughly 20% on earnings and seeing no meaningful recovery develop. Shares are currently being turned back from the 10 DMA, which is now the first level of resistance. Additional resistance sits just overhead at the 200 DMA near $132.64, followed by the ROUND-$140 level and then the 50 DMA near $144.63.
At this point, there is simply too much technical damage and too much overhead resistance. I would rather redeploy this capital into a fresh breakout or BUY SIGNAL showing substantially better technical conditions.
James’ Trader’s Tip: Capital Has an Opportunity Cost
• A deeply damaged stock may require significant time just to work through multiple layers of overhead resistance.
• Even if a recovery eventually develops, that capital may be tied up while stronger opportunities emerge elsewhere.
• Sometimes the best decision is not waiting for a damaged position to recover—it is moving the money into a stock with a cleaner technical setup.
CLICK/TAP CHART TO ZOOM
Chart services courtesy of stockcharts.com. Annotations by James Taulman.
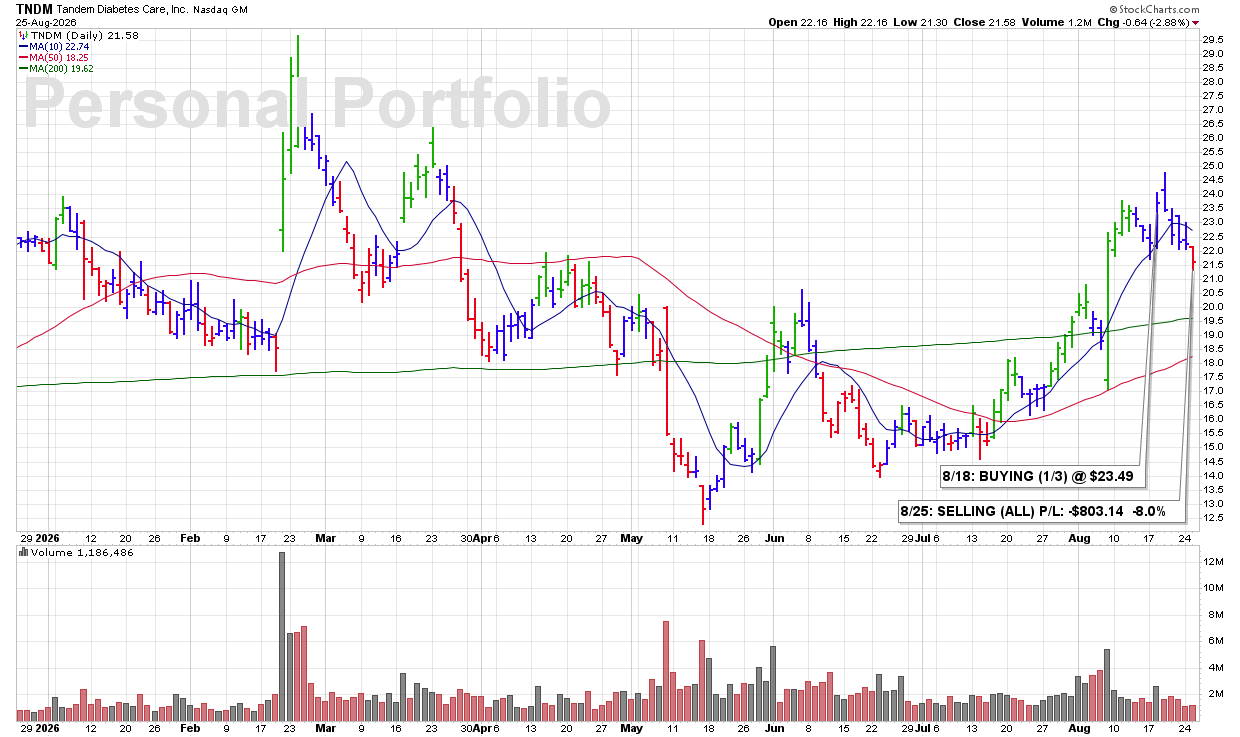
10:06 AM – Getting out of TNDM this morning as the technical picture continues to deteriorate. Shares have been (1) posting a series of lower highs, (2) making new recent lows, and (3) trading with the 10 DMA now clearly rolling over. At the same time, my loss has reached roughly 8%, which is about as far as I generally allow a position to move against me under my risk-management guidelines. I’m exiting here and protecting capital.
ULTRA Trader’s Tip: Respect Your Maximum Loss
• Lower highs and new lows show that the stock is moving in the wrong direction.
• A rolling-over 10 DMA confirms that short-term momentum is deteriorating.
• Once a loss reaches your predetermined threshold, discipline matters more than hope—take the loss and move on.
CLICK/TAP CHART TO ZOOM
Chart services courtesy of stockcharts.com. Annotations by James Taulman.
8:30 PM – Here is our latest chart update for this recent breakout from our Traditional BreakOuts Watch List.
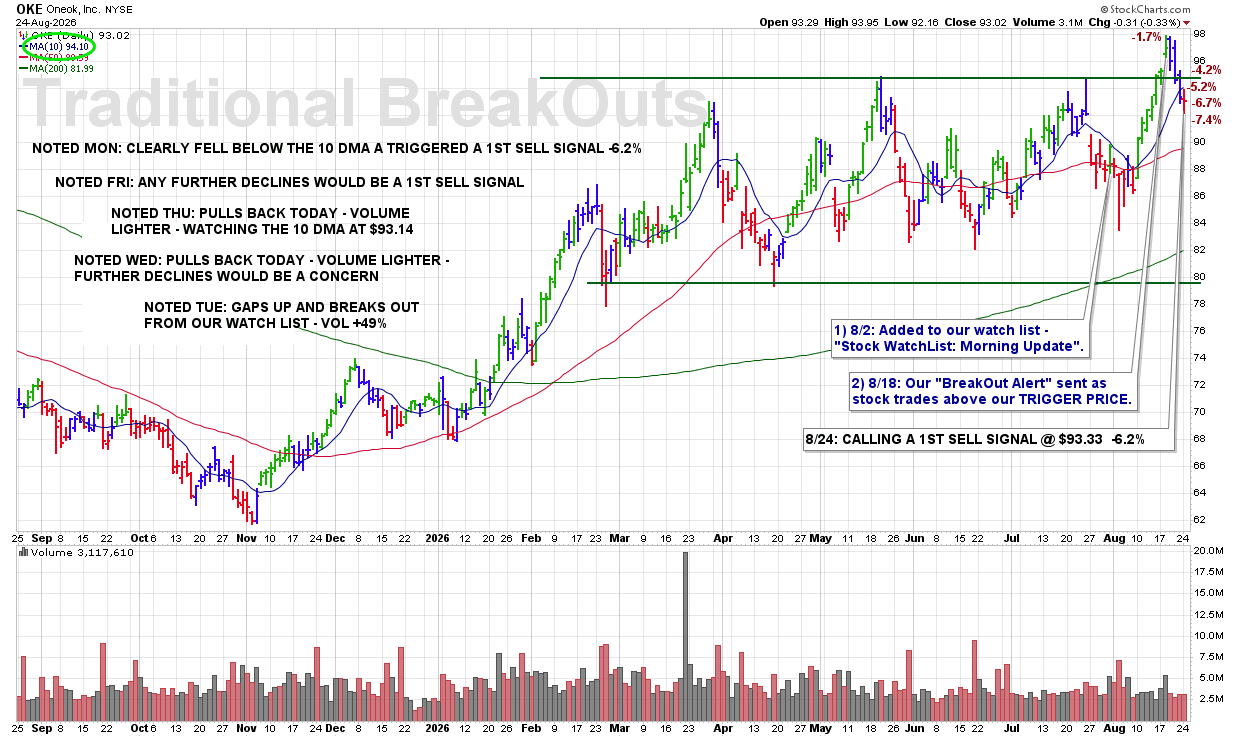
CLICK/TAP CHART TO ZOOM
Chart services courtesy of stockcharts.com. Annotations by James Taulman.
We are currently reporting on this stock as an active holding and continue to monitor the stock closely for any technical SELL SIGNALS.
The focus always remains on price/volume action around key support levels, including the 10 DMA, 50 DMA, and any nearby trendline or ROUND-$ support.
8:25 PM – Here is our latest chart update for this recent breakout from our Traditional BreakOuts Watch List.

CLICK/TAP CHART TO ZOOM
Chart services courtesy of stockcharts.com. Annotations by James Taulman.
We are currently reporting on this stock as an active holding and continue to monitor the stock closely for any technical SELL SIGNALS.
The focus always remains on price/volume action around key support levels, including the 10 DMA, 50 DMA, and any nearby trendline or ROUND-$ support.
8:20 PM – Here is our latest chart update for this recent breakout from our Traditional BreakOuts Watch List
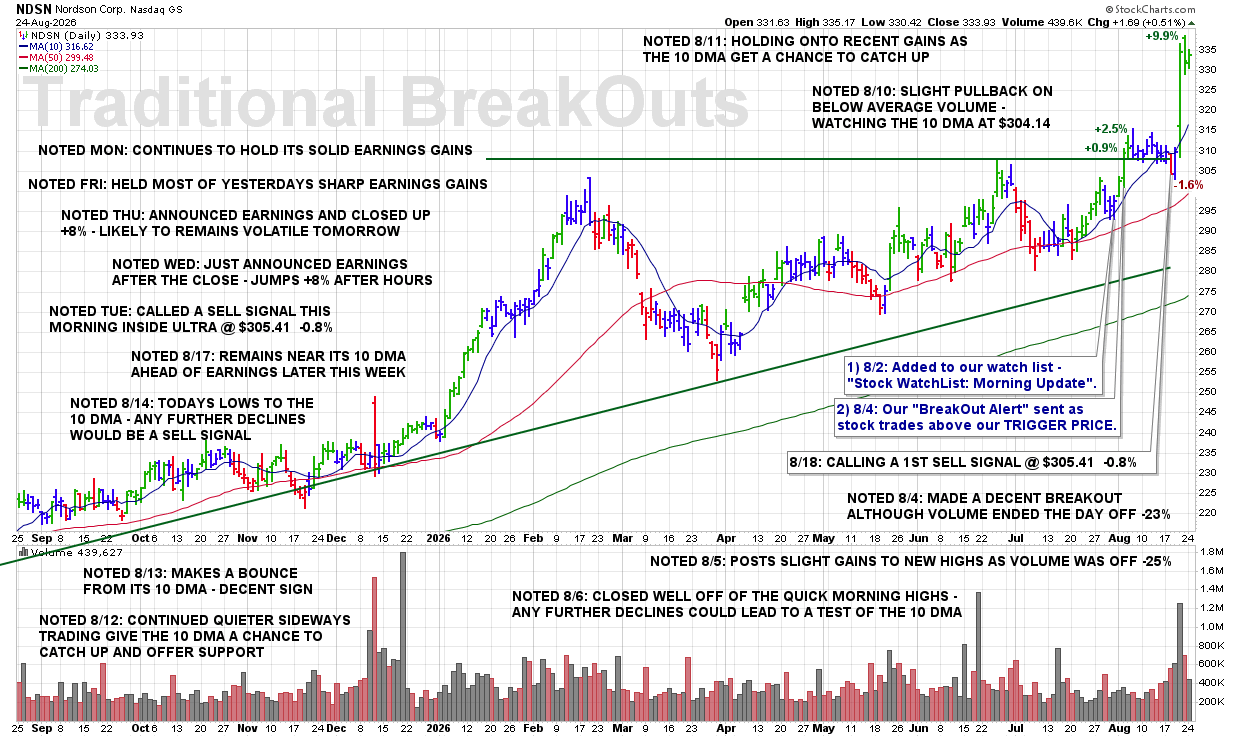
CLICK/TAP CHART TO ZOOM
Chart services courtesy of stockcharts.com. Annotations by James Taulman.
We are currently reporting on this stock as an active holding and continue to monitor the stock closely for any technical SELL SIGNALS.
The focus always remains on price/volume action around key support levels, including the 10 DMA, 50 DMA, and any nearby trendline or ROUND-$ support.
8:15 PM – Here is our latest chart update for this recent breakout from our Traditional BreakOuts Watch List
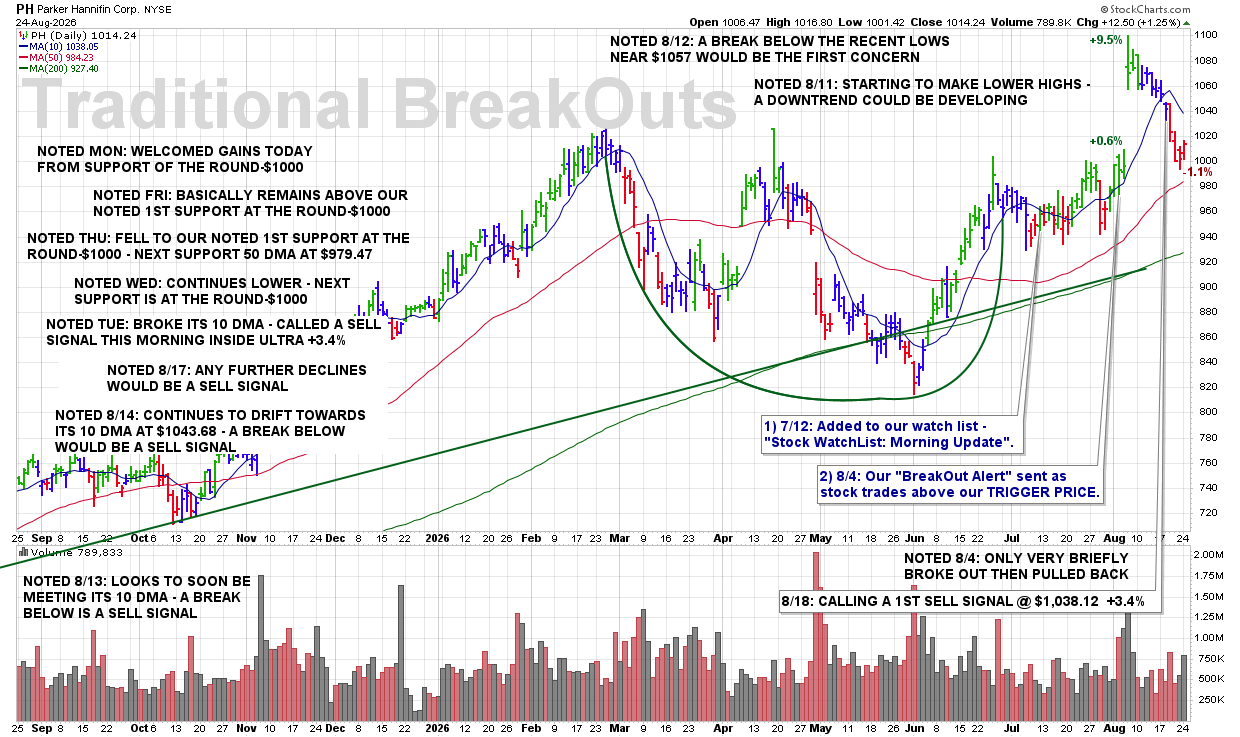
CLICK/TAP CHART TO ZOOM
Chart services courtesy of stockcharts.com. Annotations by James Taulman.
We are currently reporting on this stock as an active holding and continue to monitor the stock closely for any technical SELL SIGNALS.
The focus always remains on price/volume action around key support levels, including the 10 DMA, 50 DMA, and any nearby trendline or ROUND-$ support.
8:10 PM – Here is our latest chart update for this recent breakout from our Traditional BreakOuts Watch List.
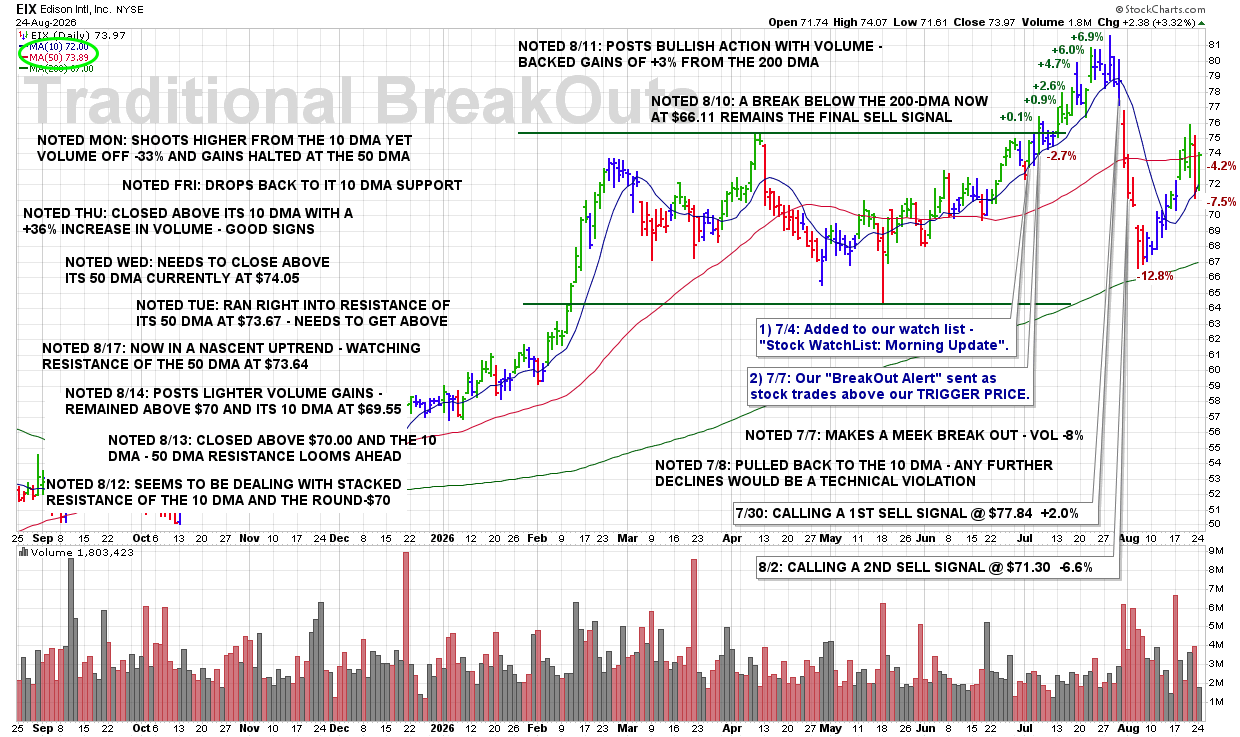
CLICK/TAP CHART TO ZOOM
Chart services courtesy of stockcharts.com. Annotations by James Taulman.
We are currently reporting on this stock as an active holding and continue to monitor the stock closely for any technical SELL SIGNALS.
The focus always remains on price/volume action around key support levels, including the 10 DMA, 50 DMA, and any nearby trendline or ROUND-$ support.
8:05 PM – Here is our latest chart update for this recent breakout from our Traditional BreakOuts Watch List.
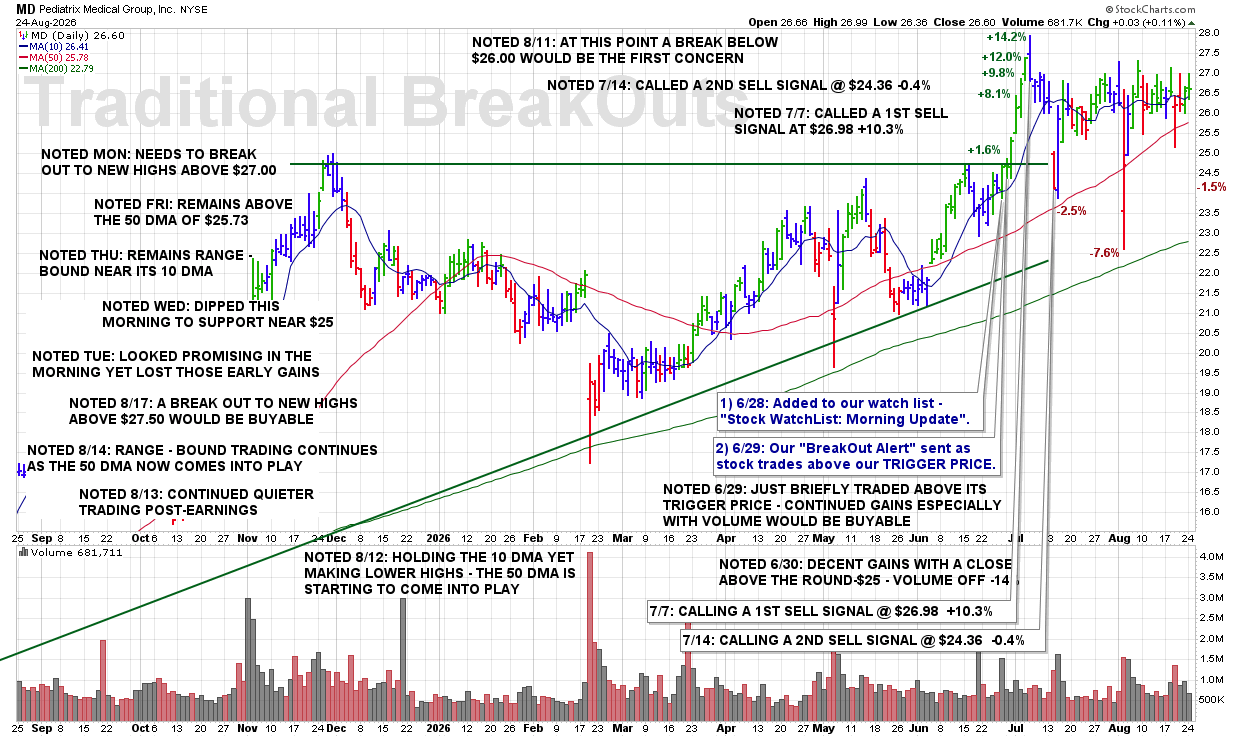
CLICK/TAP CHART TO ZOOM
Chart services courtesy of stockcharts.com. Annotations by James Taulman.
We are currently reporting on this stock as an active holding and continue to monitor the stock closely for any technical SELL SIGNALS.
The focus always remains on price/volume action around key support levels, including the 10 DMA, 50 DMA, and any nearby trendline or ROUND-$ support.
8:00 PM – Here is our latest chart update for this recent breakout from our Traditional BreakOuts Watch List.
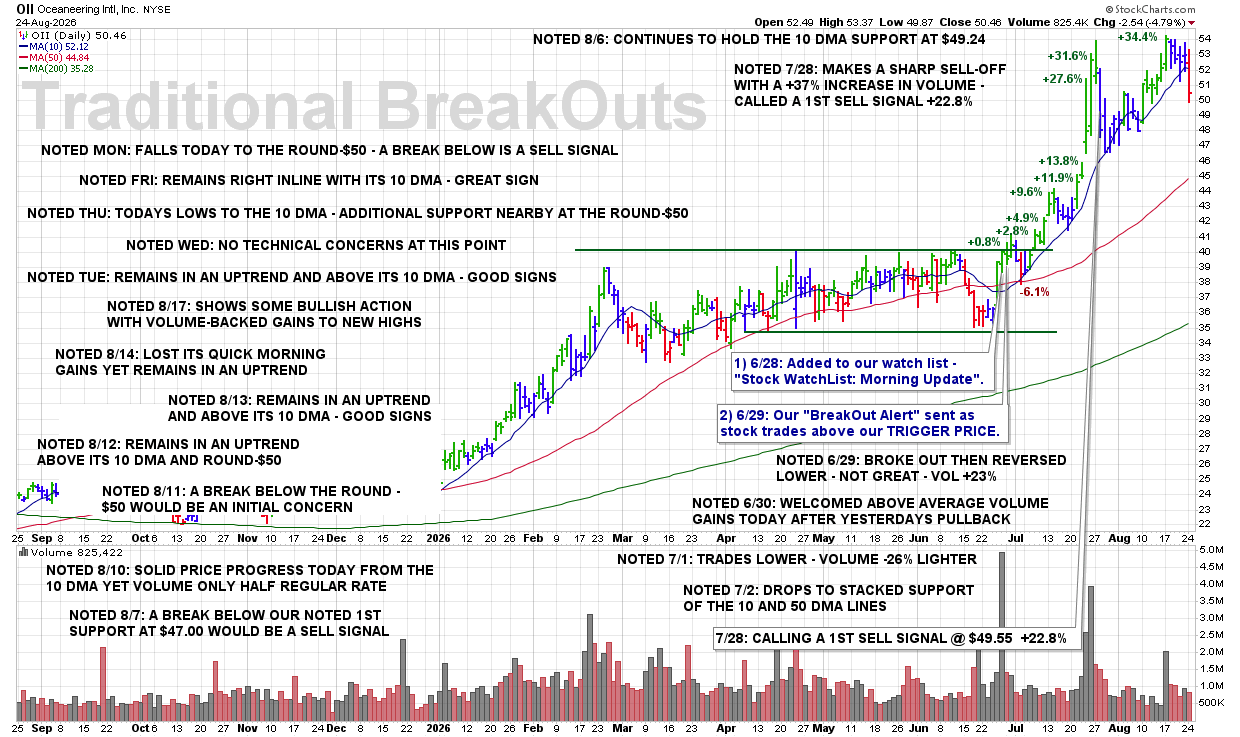
CLICK/TAP CHART TO ZOOM
Chart services courtesy of stockcharts.com. Annotations by James Taulman.
We are currently reporting on this stock as an active holding and continue to monitor the stock closely for any technical SELL SIGNALS.
The focus always remains on price/volume action around key support levels, including the 10 DMA, 50 DMA, and any nearby trendline or ROUND-$ support.
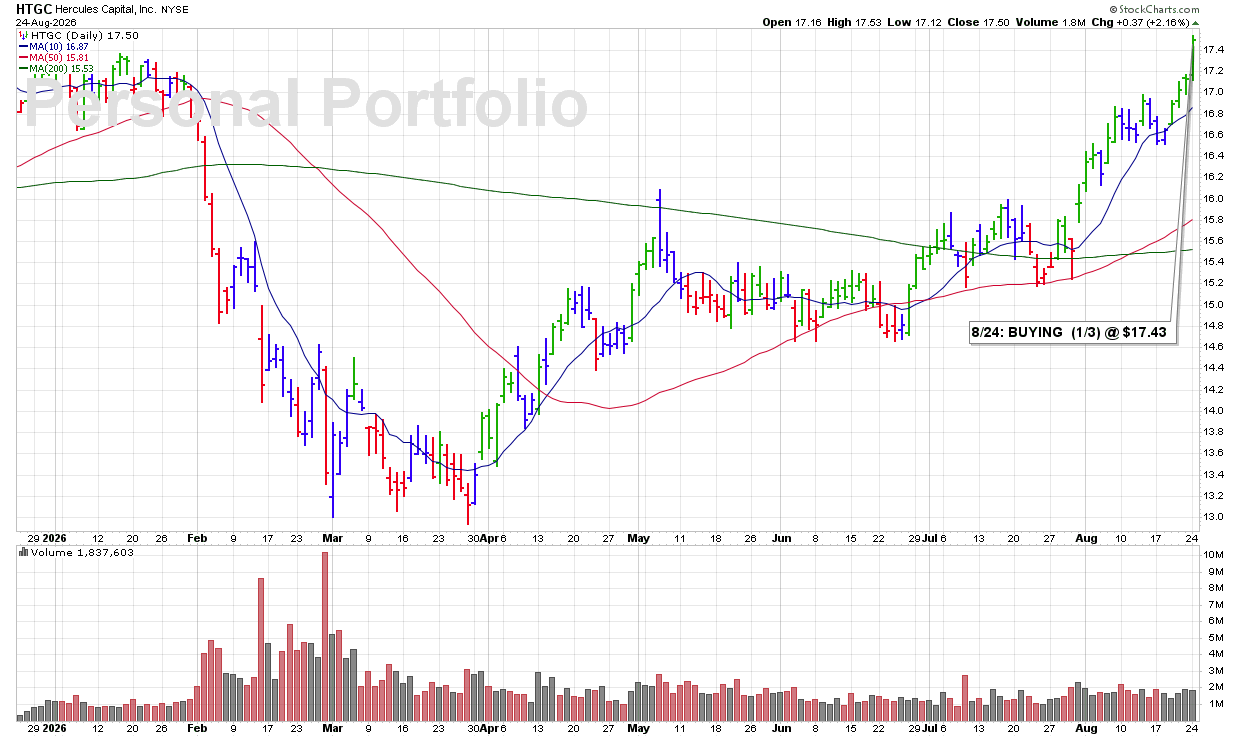
3:39 PM – Picking up a 1/3 position in this Finance-Investment Management company as shares trade higher from near the 10 DMA and break above previous highs near $17.35, while volume runs 21% above average. The combination of support at the 10 DMA, a move through previous resistance, and expanding volume represents the type of bullish technical action I look for in a BUY SIGNAL.
James’ Trader’s Tip: Look for Confirmation From Multiple Signals
• Advancing from the 10 DMA shows that short-term support is holding.
• Breaking above previous highs confirms that resistance is being cleared.
• Above-average volume adds conviction to the move and strengthens the bullish technical evidence.
CLICK/TAP CHART TO ZOOM
Chart services courtesy of stockcharts.com. Annotations by James Taulman.
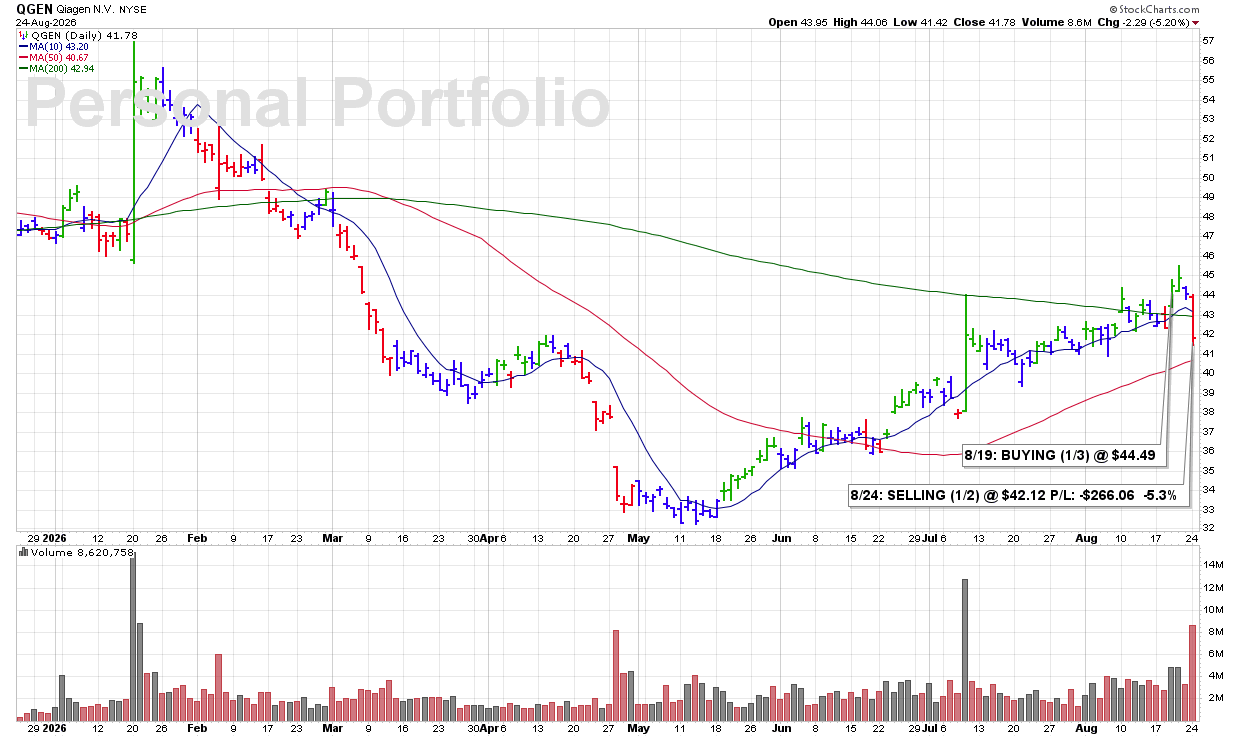
3:27 PM – Selling half my QGEN position here as shares break below the 10 DMA while volume runs 177% above average. That combination of a key support violation and extremely heavy selling volume represents bearish technical action I cannot ignore, so I’m reducing the position here.
James’ Trader’s Tip: Heavy Volume Makes Weakness More Meaningful
• A break below the 10 DMA is already a technical warning.
• When that break occurs on dramatically increased volume, it suggests much stronger selling pressure.
• Reducing exposure quickly when price and volume both turn bearish helps keep risk under control.
CLICK/TAP CHART TO ZOOM
Chart services courtesy of stockcharts.com. Annotations by James Taulman.
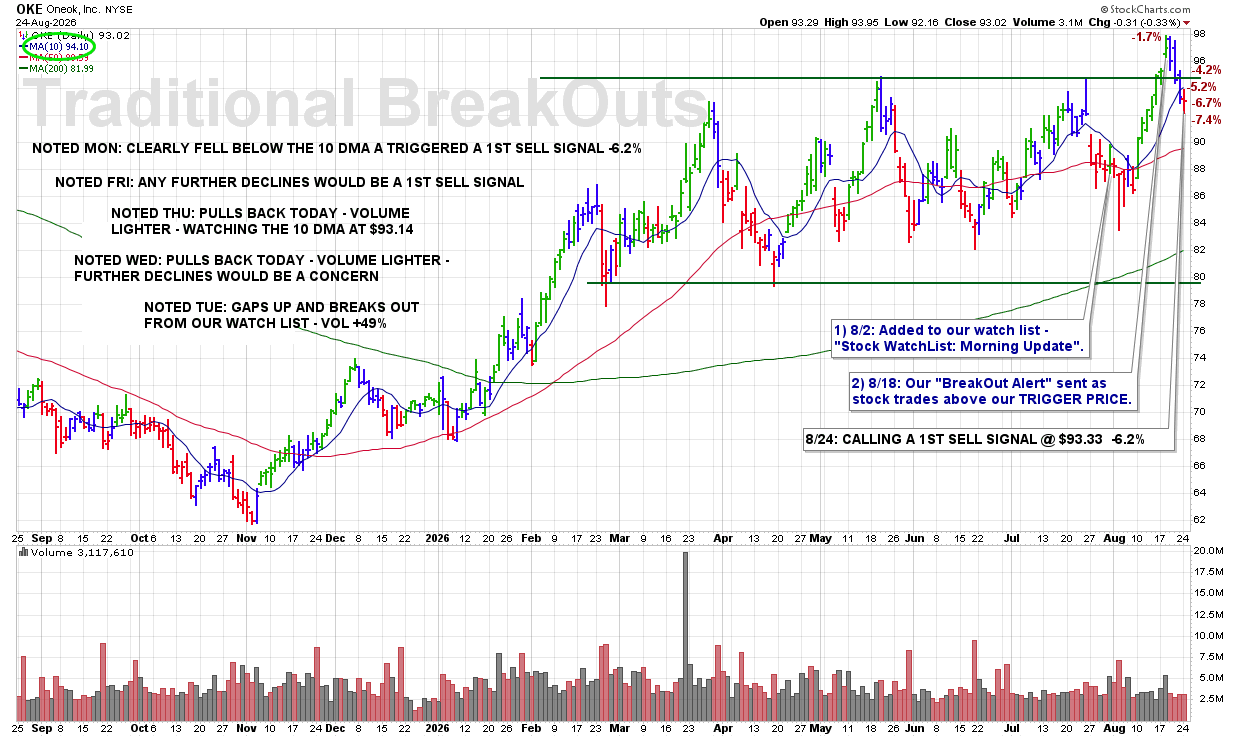
3:17 PM – Calling a 1ST SELL SIGNAL as the stock has clearly broken below its 10 DMA. That loss of our key short-term support level is a technical violation and a default SELL SIGNAL under our rules.
ULTRA Trader’s Tip: Follow the Rule, Not the Emotion
• The 10 DMA is one of our primary technical guideposts.
• A clear break below that line tells us the technical condition has changed.
• Predetermined SELL rules eliminate guesswork—when the violation occurs, respect the signal.
CLICK/TAP CHART TO ZOOM
Chart services courtesy of stockcharts.com. Annotations by James Taulman.
3:14 PM – Calling a 3RD and FINAL SELL SIGNAL here before the close as shares dip into their 50 DMA support after already showing several bearish technical signs. With weakness continuing to build and major support now being tested, I’m closing out this selection under our rules.
ULTRA Trader’s Tip: Multiple Weakness Signals Add Up
• One bearish sign may be manageable, but several technical violations together deserve more attention.
• A test of the 50 DMA becomes more significant when the stock has already been showing ongoing weakness.
• When bearish evidence continues to stack up, follow the rules and reduce exposure.

CLICK/TAP CHART TO ZOOM
Chart services courtesy of stockcharts.com. Annotations by James Taulman.
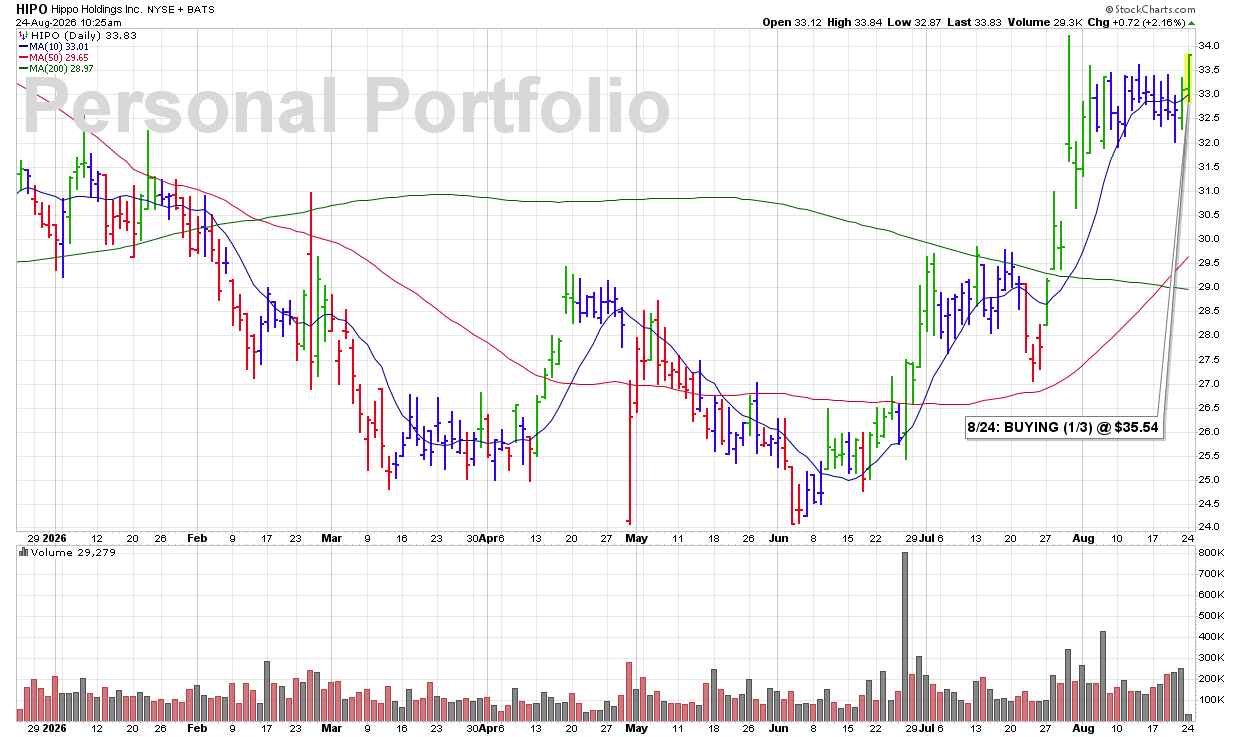
10:15 AM – Starting a 1/3 position in this insurance stock as shares trade higher from the 10 DMA, break above recent highs near $33.00, and do so with volume currently running 143% above average. That combination of support, breakout strength, and sharply expanding volume gives us a strong technical BUY SIGNAL.
James’ Trader’s Tip: Breakouts Are Stronger When Volume Confirms
• Advancing from the 10 DMA shows that short-term support is holding.
• Clearing recent highs confirms that resistance is being overcome.
• When the breakout comes with a 143% increase in volume, the move carries significantly more technical conviction.
CLICK/TAP CHART TO ZOOM
Chart services courtesy of stockcharts.com. Annotations by James Taulman.
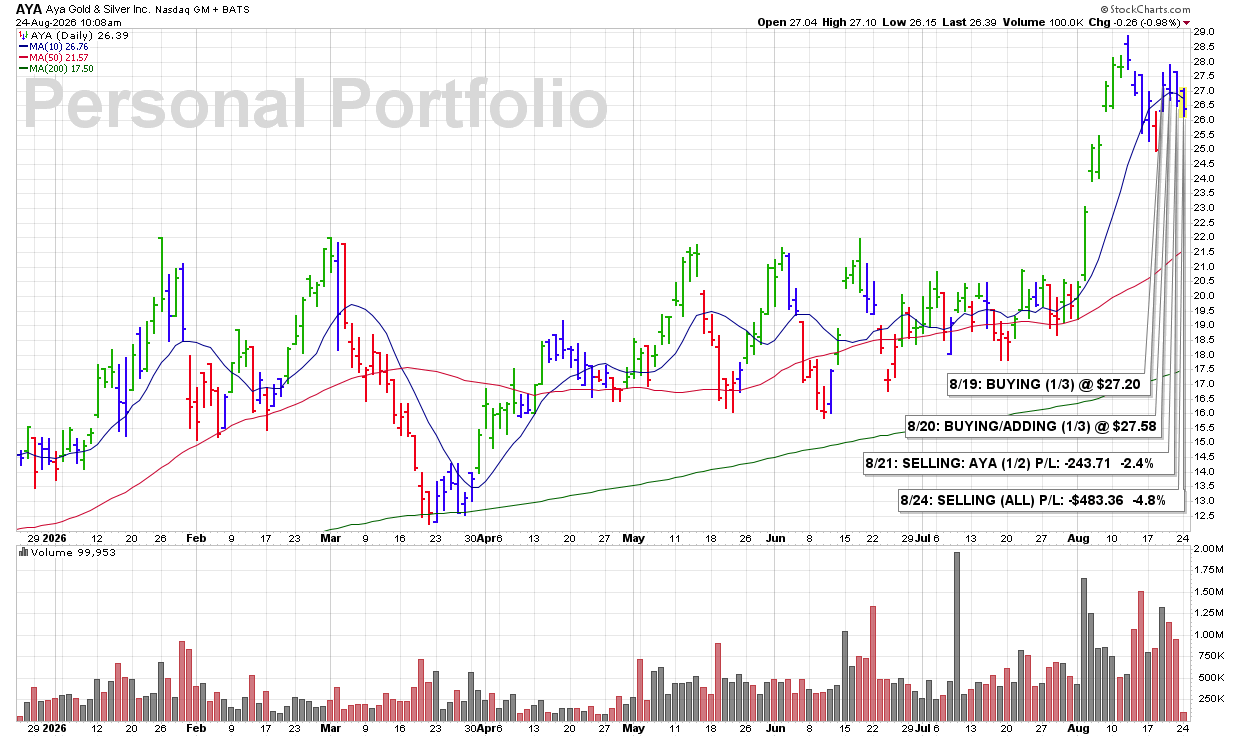
10:03 AM – Selling my remaining 1/2 position in AYA as the stock continues to exhibit bearish technical action. Today’s move is essentially another turnback from the 10 DMA, with shares printing new recent lows while trading lower on increased volume. With multiple signs of weakness continuing to stack up, I’m fully exiting the position here.
James’ Trader’s Tip: Ongoing Weakness Is a Sell Signal
• Repeated rejection at the 10 DMA shows that former support has become resistance.
• New recent lows confirm that downside pressure remains in control.
• When bearish price action continues on increasing volume, the technical evidence is telling you to reduce exposure.
CLICK/TAP CHART TO ZOOM
Chart services courtesy of stockcharts.com. Annotations by James Taulman.
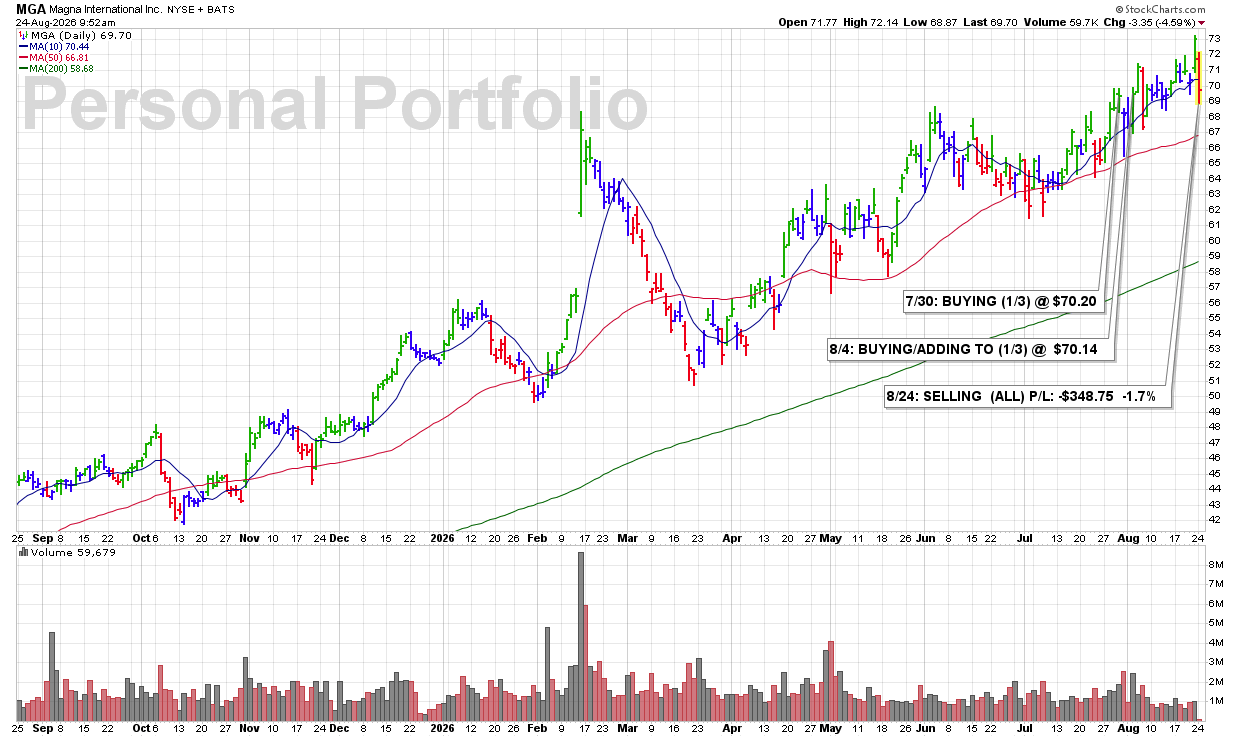
9:41 AM – Selling all my MGA shares quickly this morning as the stock sells off sharply on a huge increase in volume and breaks below the ROUND-$70 support level. The combination of heavy selling pressure, a key support violation, and expanding volume is enough technical deterioration for me to exit the position and move on.
James’ Trader’s Tip: Sharp Selling on Heavy Volume Demands Action
• A break below a key support level is already a technical warning.
• When that break comes with a major increase in volume, the signal becomes much more meaningful.
• Heavy-volume weakness should be respected quickly before a manageable loss has the chance to become something larger.
CLICK/TAP CHART TO ZOOM
Chart services courtesy of stockcharts.com. Annotations by James Taulman.
9:00 PM – Here is our latest chart update for this recent breakout from our Traditional BreakOuts Watch List.
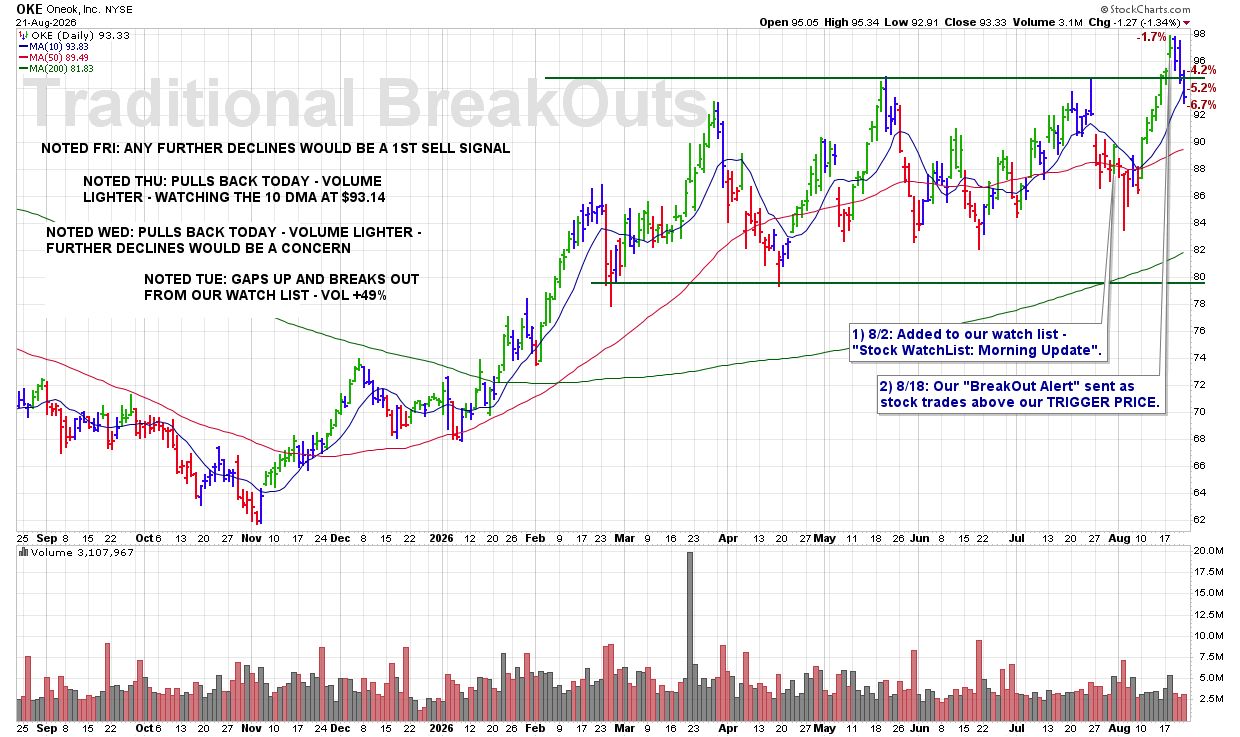
CLICK/TAP CHART TO ZOOM
Chart services courtesy of stockcharts.com. Annotations by James Taulman.
We are currently reporting on this stock as an active holding and continue to monitor the stock closely for any technical SELL SIGNALS.
The focus always remains on price/volume action around key support levels, including the 10 DMA, 50 DMA, and any nearby trendline or ROUND-$ support.
8:55 PM – Here is our latest chart update for this recent breakout from our Traditional BreakOuts Watch List.
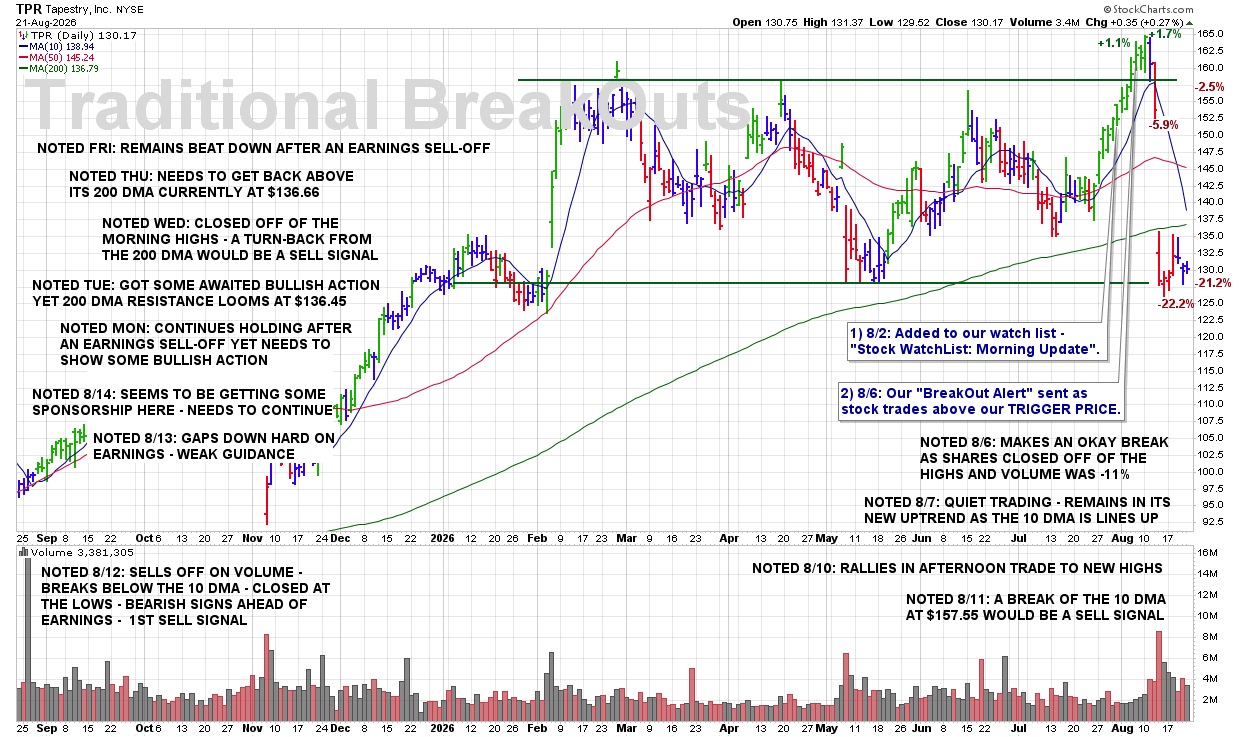
CLICK/TAP CHART TO ZOOM
Chart services courtesy of stockcharts.com. Annotations by James Taulman.
We are currently reporting on this stock as an active holding and continue to monitor the stock closely for any technical SELL SIGNALS.
The focus always remains on price/volume action around key support levels, including the 10 DMA, 50 DMA, and any nearby trendline or ROUND-$ support.
8:50 PM – Here is our latest chart update for this recent breakout from our Traditional BreakOuts Watch List
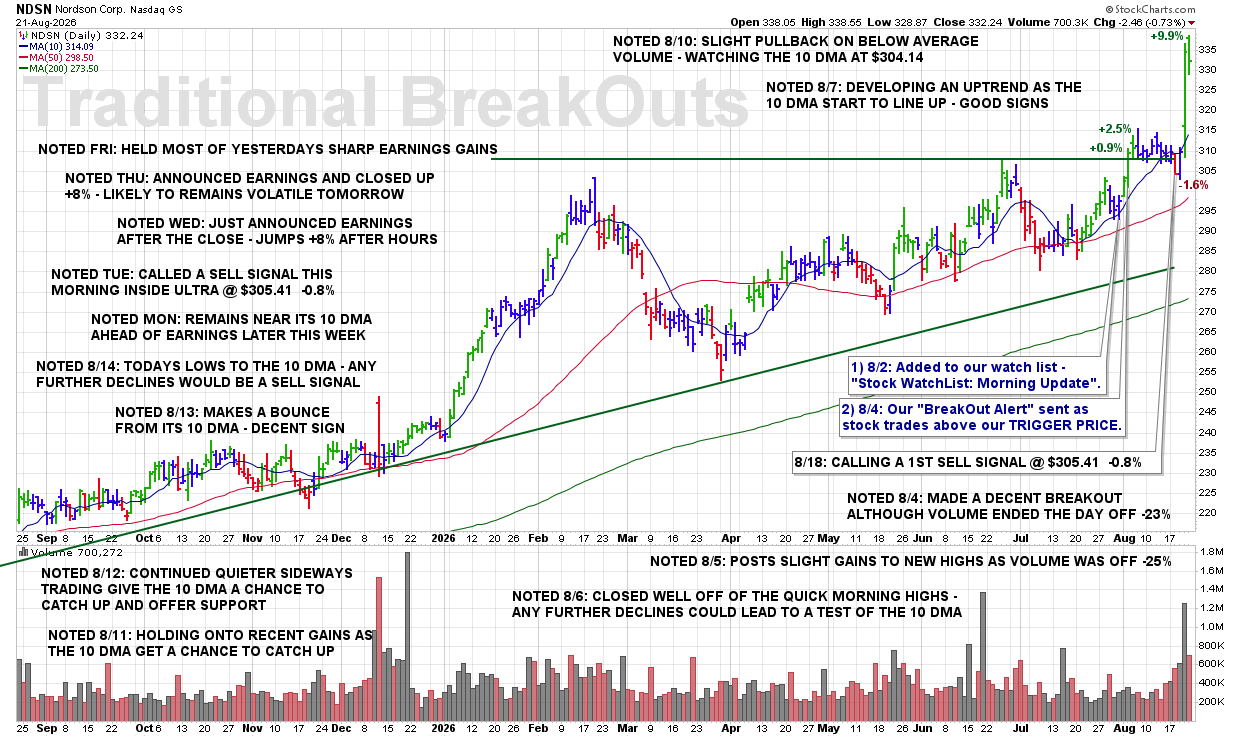
CLICK/TAP CHART TO ZOOM
Chart services courtesy of stockcharts.com. Annotations by James Taulman.
We are currently reporting on this stock as an active holding and continue to monitor the stock closely for any technical SELL SIGNALS.
The focus always remains on price/volume action around key support levels, including the 10 DMA, 50 DMA, and any nearby trendline or ROUND-$ support.
8:45 PM – Here is our latest chart update for this recent breakout from our Traditional BreakOuts Watch List
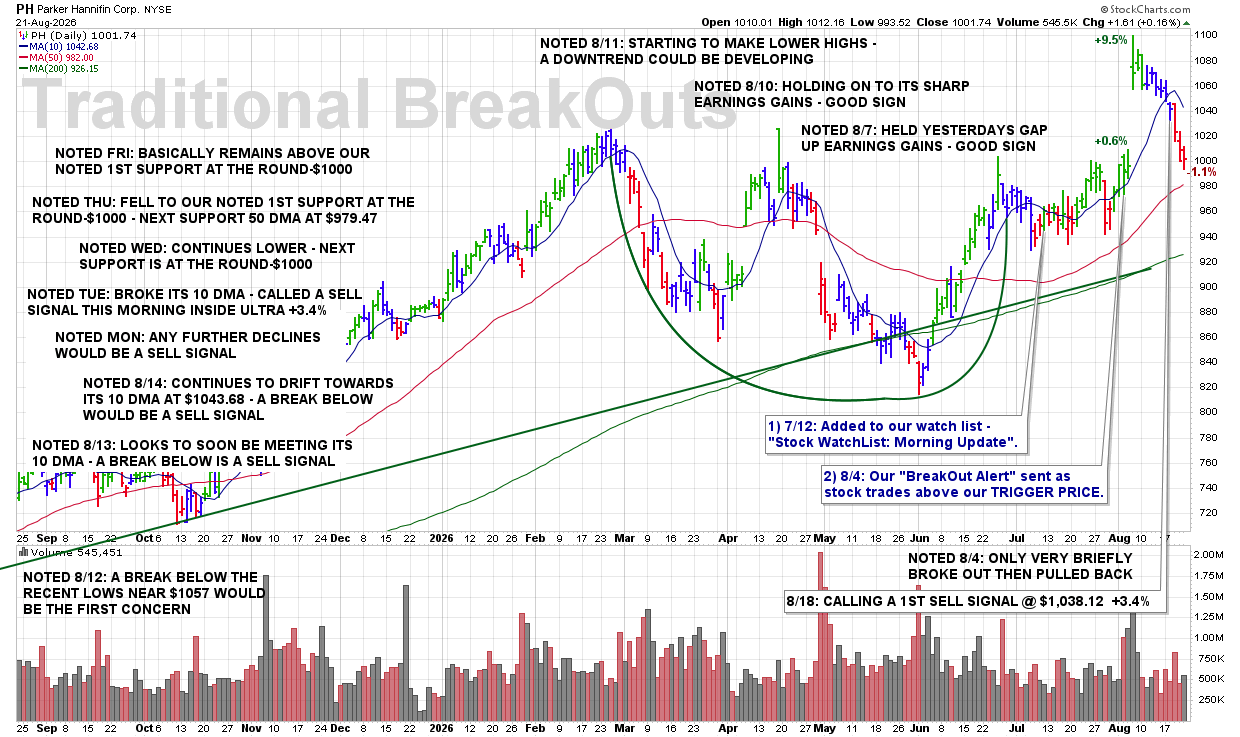
CLICK/TAP CHART TO ZOOM
Chart services courtesy of stockcharts.com. Annotations by James Taulman.
We are currently reporting on this stock as an active holding and continue to monitor the stock closely for any technical SELL SIGNALS.
The focus always remains on price/volume action around key support levels, including the 10 DMA, 50 DMA, and any nearby trendline or ROUND-$ support.
8:40 PM – Here is our latest chart update for this recent breakout from our Traditional BreakOuts Watch List.
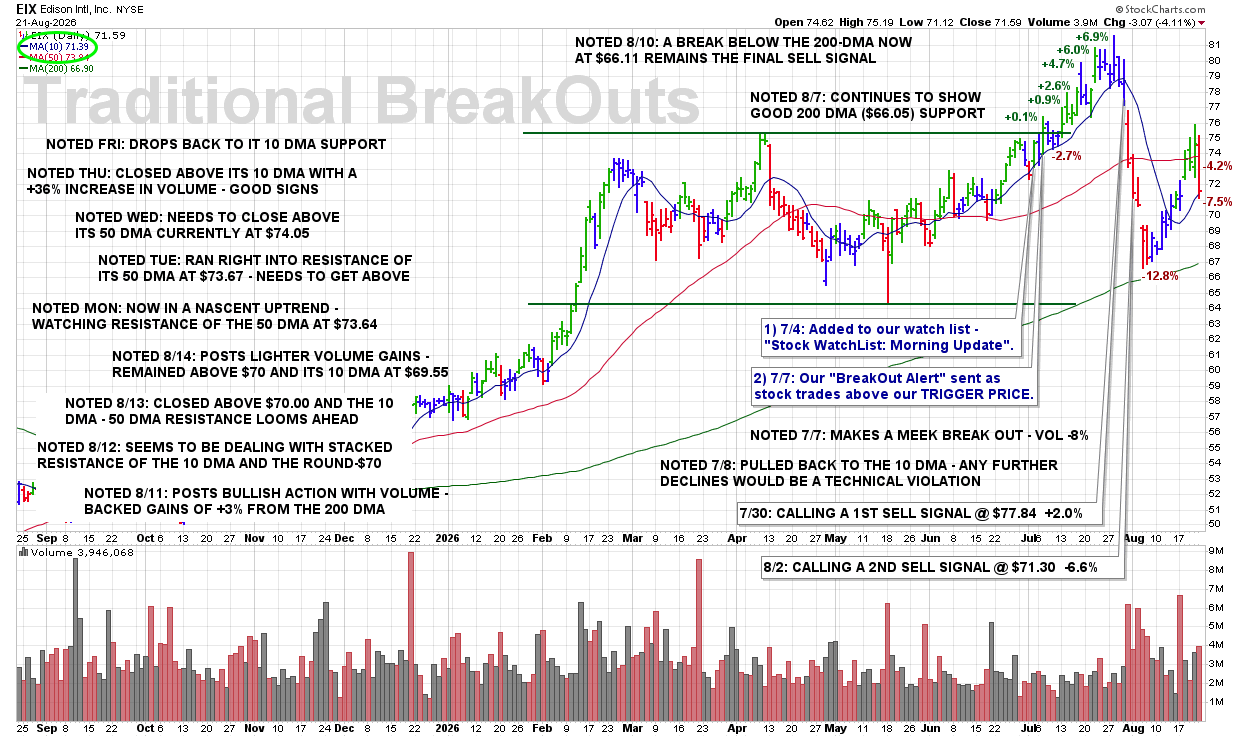
CLICK/TAP CHART TO ZOOM
Chart services courtesy of stockcharts.com. Annotations by James Taulman.
We are currently reporting on this stock as an active holding and continue to monitor the stock closely for any technical SELL SIGNALS.
The focus always remains on price/volume action around key support levels, including the 10 DMA, 50 DMA, and any nearby trendline or ROUND-$ support.
8:35 PM – Here is our latest chart update for this recent breakout from our Traditional BreakOuts Watch List.
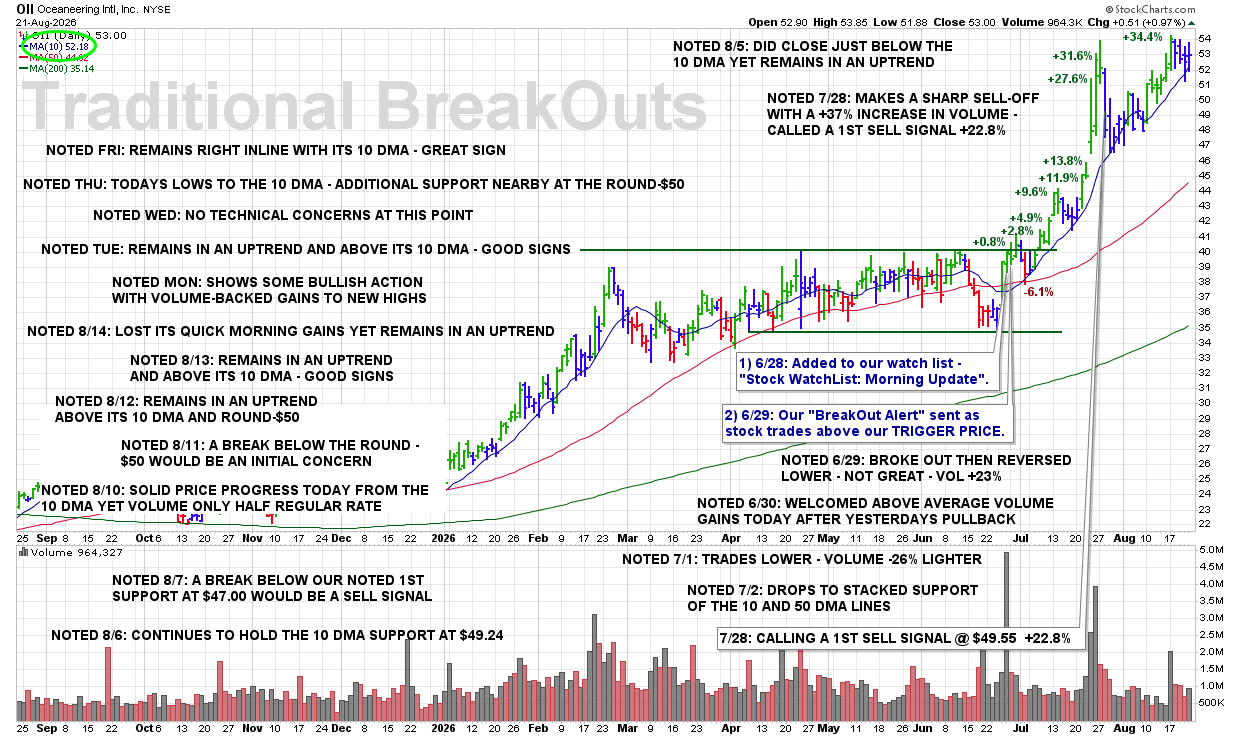
CLICK/TAP CHART TO ZOOM
Chart services courtesy of stockcharts.com. Annotations by James Taulman.
We are currently reporting on this stock as an active holding and continue to monitor the stock closely for any technical SELL SIGNALS.
The focus always remains on price/volume action around key support levels, including the 10 DMA, 50 DMA, and any nearby trendline or ROUND-$ support.
8:30 PM – Here is our latest chart update for this recent breakout from our Traditional BreakOuts Watch List.
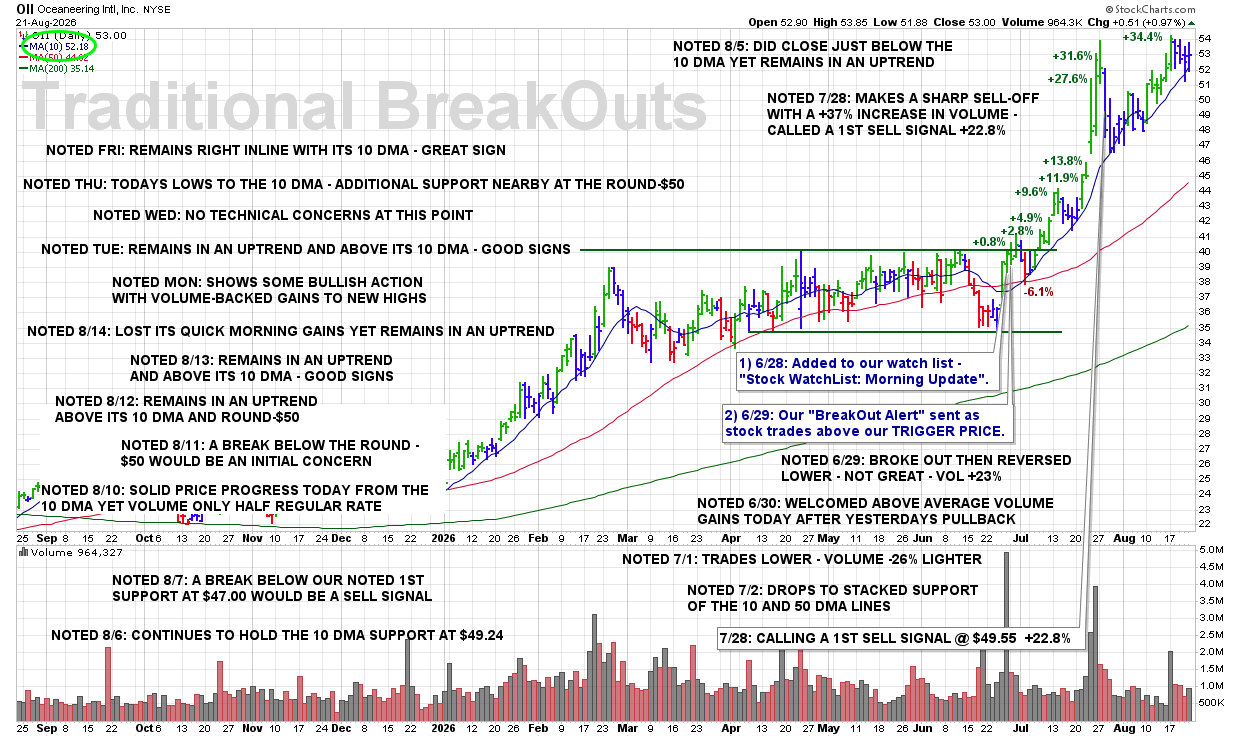
CLICK/TAP CHART TO ZOOM
Chart services courtesy of stockcharts.com. Annotations by James Taulman.
We are currently reporting on this stock as an active holding and continue to monitor the stock closely for any technical SELL SIGNALS.
The focus always remains on price/volume action around key support levels, including the 10 DMA, 50 DMA, and any nearby trendline or ROUND-$ support.
3:59 PM – Calling a 2ND and FINAL SELL SIGNAL just before the close as shares sell off this afternoon and break below the ROUND-$55 support level while volume runs 28% above average. The combination of continued price weakness, a loss of support, and increased selling volume confirms further technical deterioration and closes out coverage on this selection.
ULTRA Trader’s Tip: Increased Volume Confirms the Weakness
• Breaking a previously identified support level is an important technical violation.
• When that break occurs on above-average volume, it adds conviction to the bearish action.
• When price and volume confirm continued weakness, follow the signal and move on.
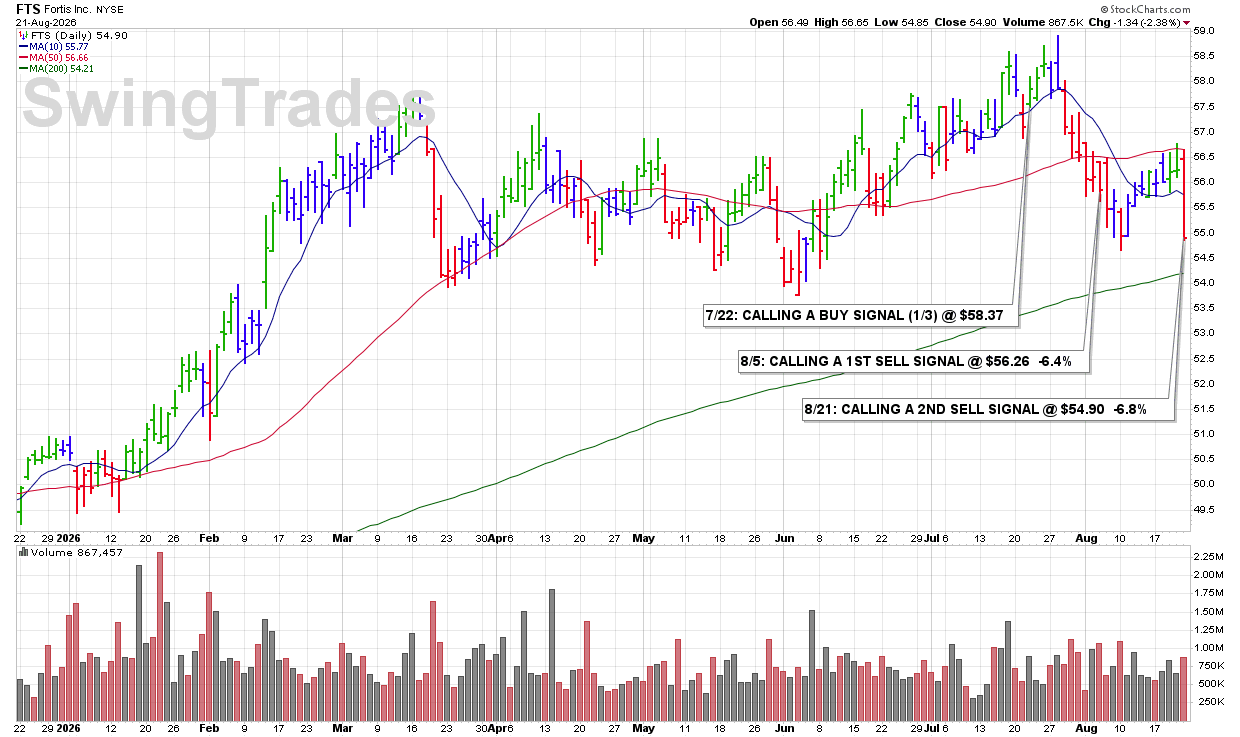
CLICK/TAP CHART TO ZOOM
Chart services courtesy of stockcharts.com. Annotations by James Taulman.
3:55 PM – Selling the remainder of my GPN position as we head into the close. Shares are trading higher this afternoon, but volume is running below average, which takes some conviction out of the move. With a solid +16.6% gain still intact, I’m locking in the rest of the profit and moving on.
James’ Trader’s Tip: Price Strength Is Better When Volume Confirms It
• A stock can move higher on light volume, but the move carries less technical conviction.
• When volume fails to confirm a price advance, it can be a good opportunity to protect profits.
• Strong gains are worth protecting—especially when the technical evidence begins to lose some strength.

CLICK/TAP CHART TO ZOOM
Chart services courtesy of stockcharts.com. Annotations by James Taulman.
3:43 PM – Starting a 1/3 position in this Medical-Systems company as shares blast higher from the 10 DMA to new recent highs while volume runs 127% above the normal daily rate. That combination of price strength and sharply expanding volume gives us a strong technical BUY SIGNAL. A close above the ROUND-$20 level would add even more bullish technical significance to the move.
James’ Trader’s Tip: Strong Volume Adds Conviction
• Advancing from the 10 DMA shows that key short-term support is holding.
• New recent highs confirm improving price strength.
• When volume expands by more than 100%, the move deserves attention because it signals unusually strong demand.

CLICK/TAP CHART TO ZOOM
Chart services courtesy of stockcharts.com. Annotations by James Taulman.
3:38 PM – Selling half of my AYA position here before the close as shares fall below the 10 DMA on a 38% increase in volume. That combination of a key support violation and heavier selling volume is bearish technical action I do not want to ignore, so I’m reducing exposure here.
James’ Trader’s Tip: Reduce Risk When Price and Volume Turn Bearish
• A break below the 10 DMA is an important technical warning.
• Increased volume on the decline gives the weakness more significance.
• Selling part of the position allows you to reduce risk while still leaving room for the stock to recover.

CLICK/TAP CHART TO ZOOM
Chart services courtesy of stockcharts.com. Annotations by James Taulman.
8:30 PM – Here is our latest chart update for this recent breakout from our Traditional BreakOuts Watch List.
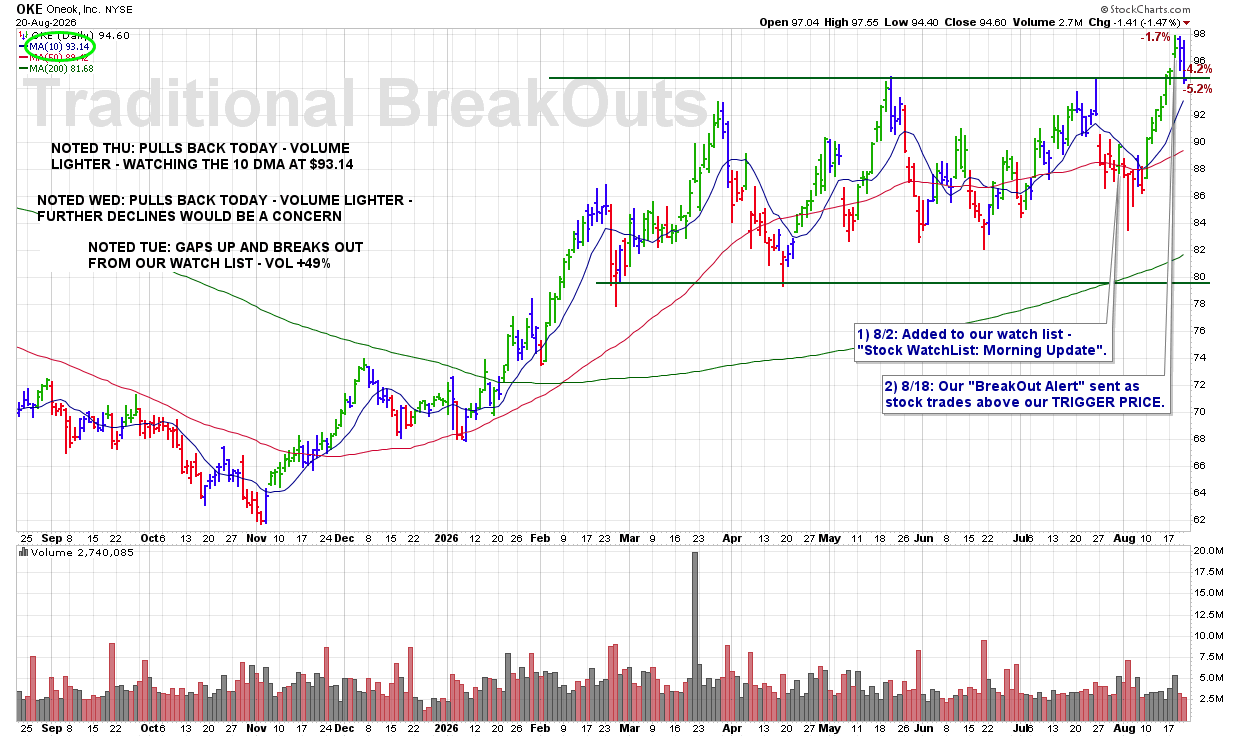
CLICK/TAP CHART TO ZOOM
Chart services courtesy of stockcharts.com. Annotations by James Taulman.
We are currently reporting on this stock as an active holding and continue to monitor the stock closely for any technical SELL SIGNALS.
The focus always remains on price/volume action around key support levels, including the 10 DMA, 50 DMA, and any nearby trendline or ROUND-$ support.
8:25 PM – Here is our latest chart update for this recent breakout from our Traditional BreakOuts Watch List.
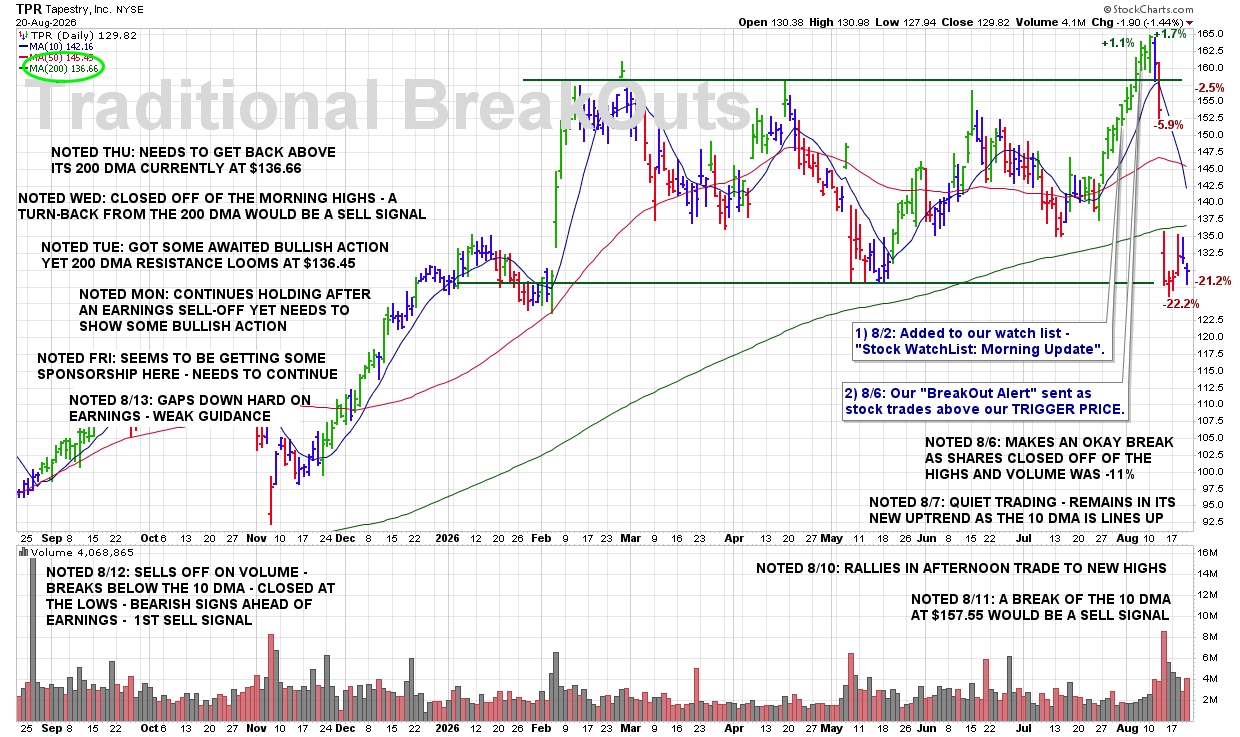
CLICK/TAP CHART TO ZOOM
Chart services courtesy of stockcharts.com. Annotations by James Taulman.
We are currently reporting on this stock as an active holding and continue to monitor the stock closely for any technical SELL SIGNALS.
The focus always remains on price/volume action around key support levels, including the 10 DMA, 50 DMA, and any nearby trendline or ROUND-$ support.
8:20 PM – Here is our latest chart update for this recent breakout from our Traditional BreakOuts Watch List
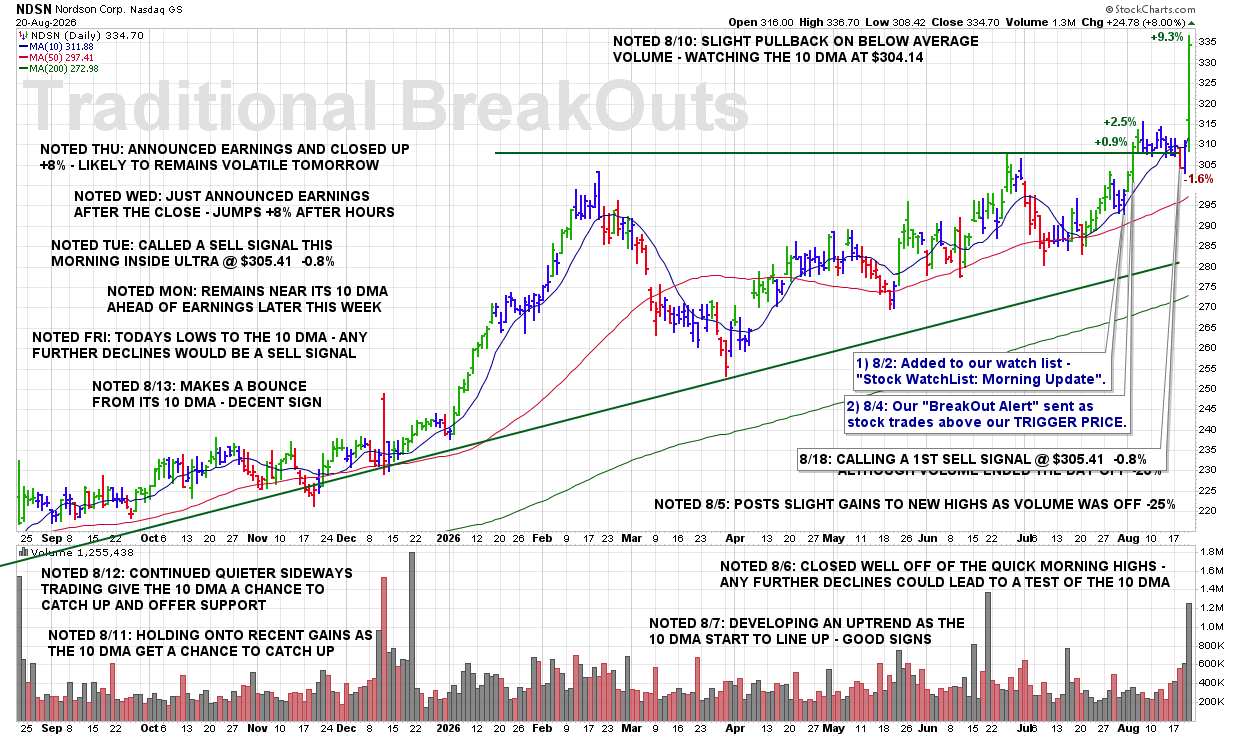
CLICK/TAP CHART TO ZOOM
Chart services courtesy of stockcharts.com. Annotations by James Taulman.
We are currently reporting on this stock as an active holding and continue to monitor the stock closely for any technical SELL SIGNALS.
The focus always remains on price/volume action around key support levels, including the 10 DMA, 50 DMA, and any nearby trendline or ROUND-$ support.
8:15 PM – Here is our latest chart update for this recent breakout from our Traditional BreakOuts Watch List
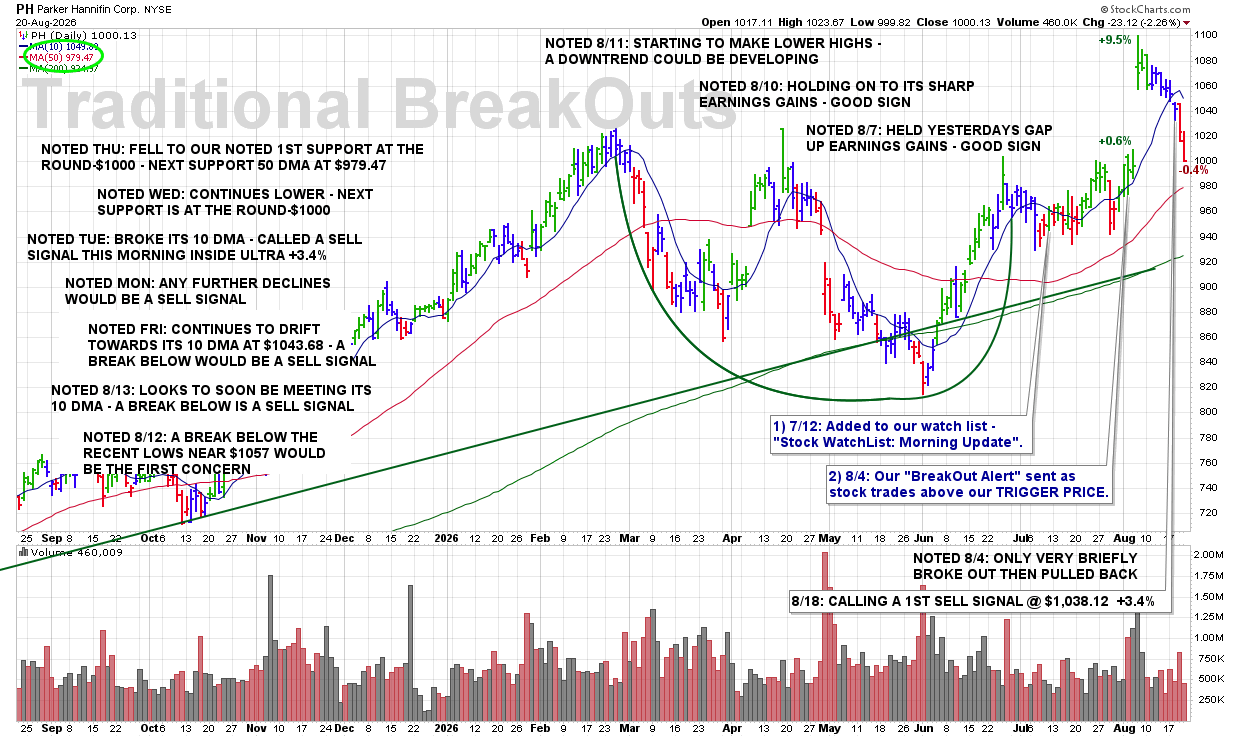
CLICK/TAP CHART TO ZOOM
Chart services courtesy of stockcharts.com. Annotations by James Taulman.
We are currently reporting on this stock as an active holding and continue to monitor the stock closely for any technical SELL SIGNALS.
The focus always remains on price/volume action around key support levels, including the 10 DMA, 50 DMA, and any nearby trendline or ROUND-$ support.
8:10 PM – Here is our latest chart update for this recent breakout from our Traditional BreakOuts Watch List.
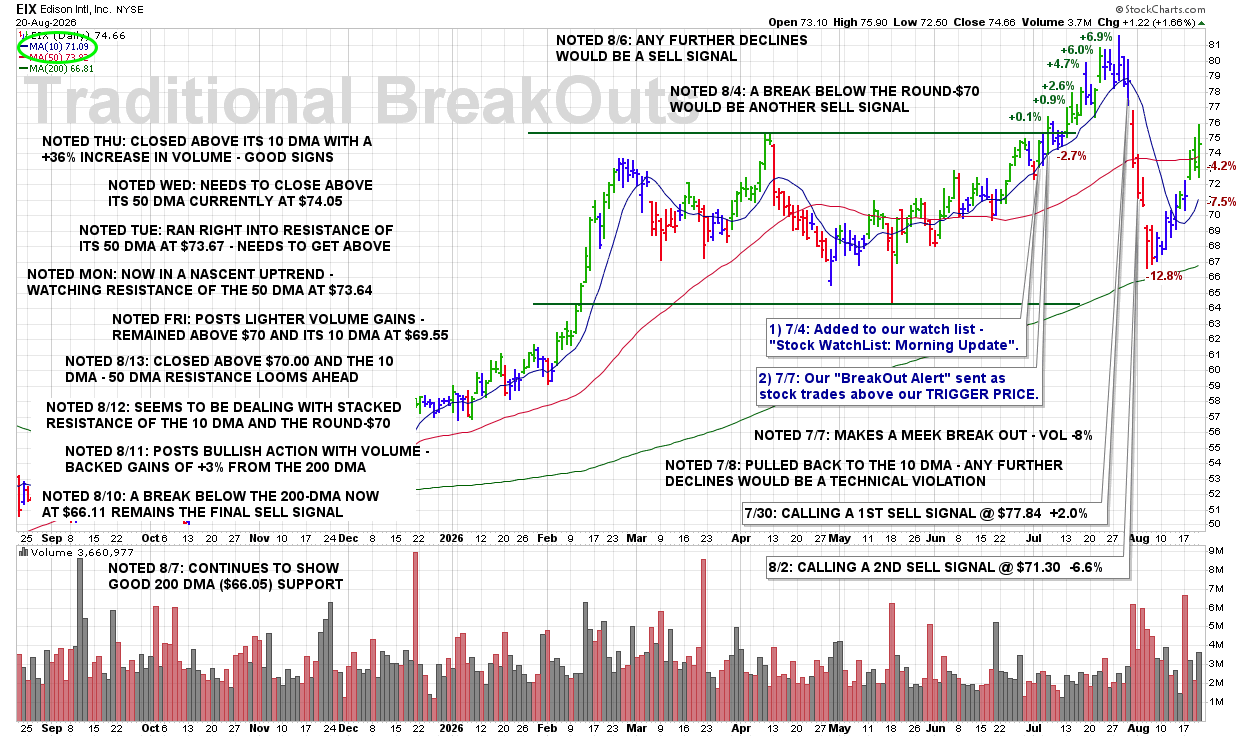
CLICK/TAP CHART TO ZOOM
Chart services courtesy of stockcharts.com. Annotations by James Taulman.
We are currently reporting on this stock as an active holding and continue to monitor the stock closely for any technical SELL SIGNALS.
The focus always remains on price/volume action around key support levels, including the 10 DMA, 50 DMA, and any nearby trendline or ROUND-$ support.
8:05 PM – Here is our latest chart update for this recent breakout from our Traditional BreakOuts Watch List.
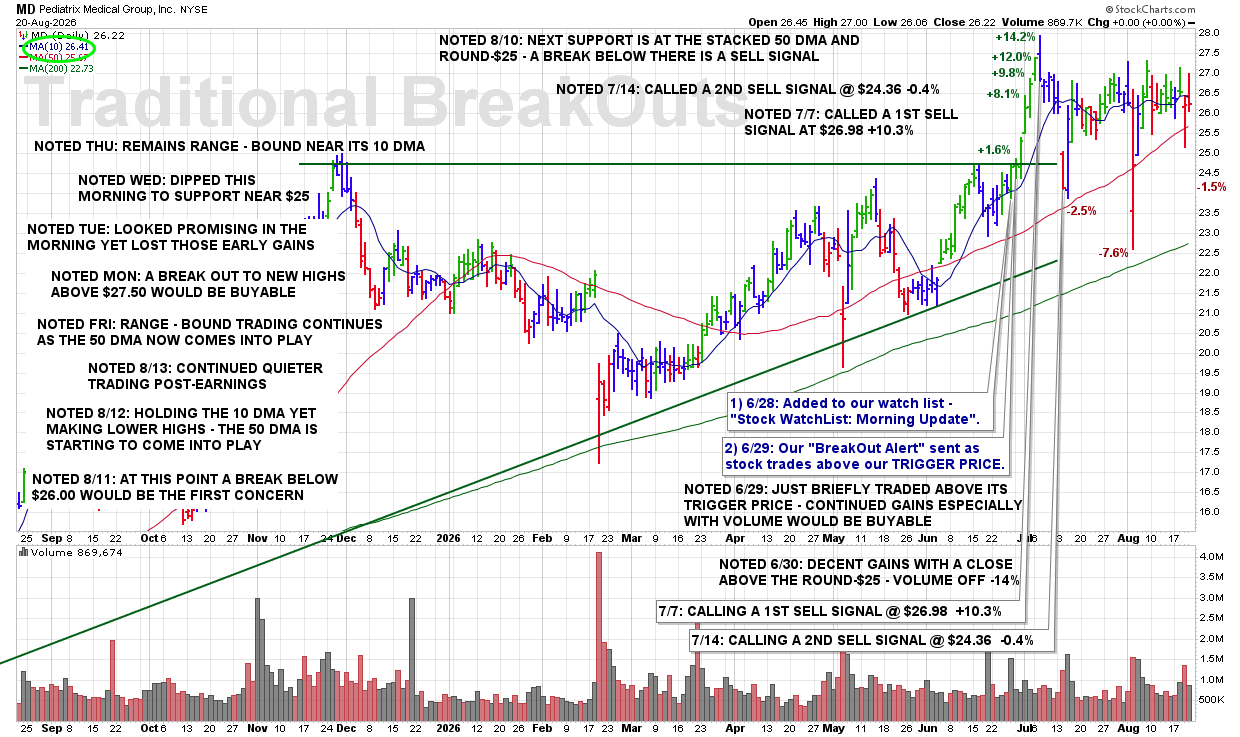
CLICK/TAP CHART TO ZOOM
Chart services courtesy of stockcharts.com. Annotations by James Taulman.
We are currently reporting on this stock as an active holding and continue to monitor the stock closely for any technical SELL SIGNALS.
The focus always remains on price/volume action around key support levels, including the 10 DMA, 50 DMA, and any nearby trendline or ROUND-$ support.
8:00 PM – Here is our latest chart update for this recent breakout from our Traditional BreakOuts Watch List.
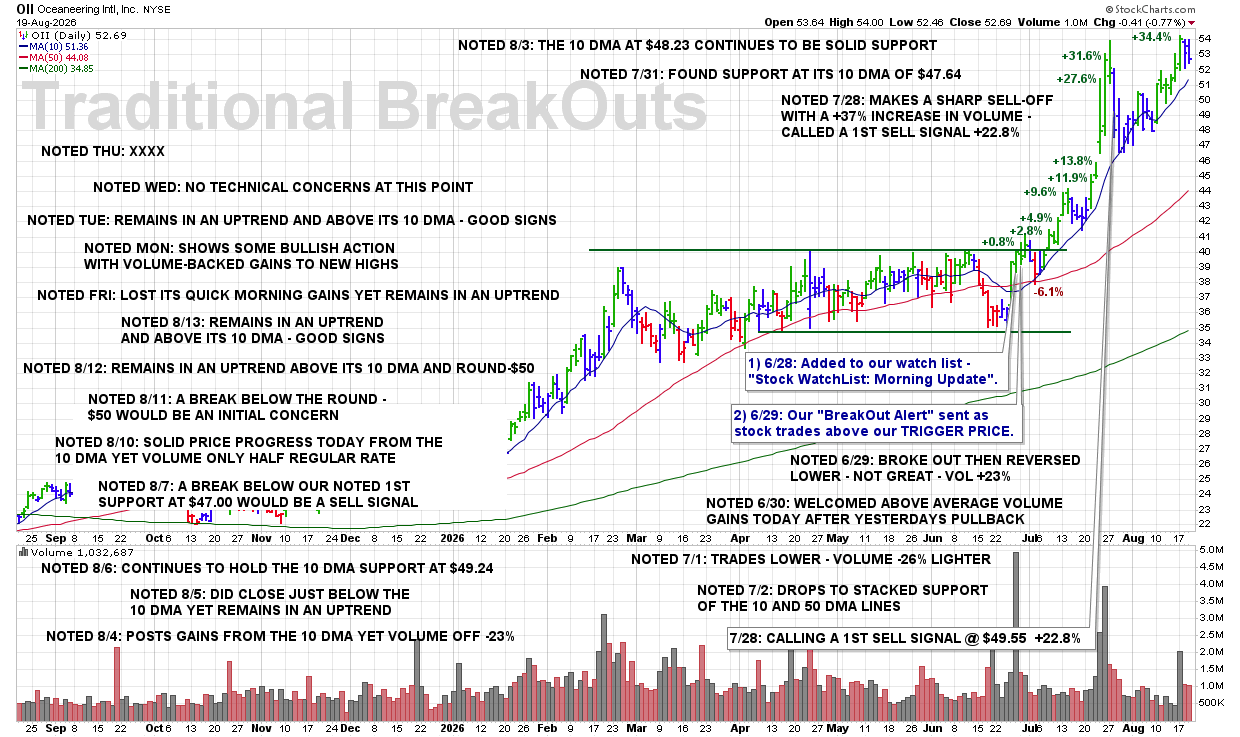
CLICK/TAP CHART TO ZOOM
Chart services courtesy of stockcharts.com. Annotations by James Taulman.
We are currently reporting on this stock as an active holding and continue to monitor the stock closely for any technical SELL SIGNALS.
The focus always remains on price/volume action around key support levels, including the 10 DMA, 50 DMA, and any nearby trendline or ROUND-$ support.
3:44 PM – Selling half of my URGN position here as shares have clearly broken below their 10 DMA support. That is a technical violation and a SELL SIGNAL under our rules. I’m reducing the position here rather than ignoring the weakness.
James’ Trader’s Tip: Respect the Technical Violation
• A clear break below the 10 DMA tells us that important short-term support has failed.
• Once a stock violates a key technical level, the rules—not hope—should determine our response.
• Selling part of the position immediately reduces risk while giving the remaining shares an opportunity to recover.
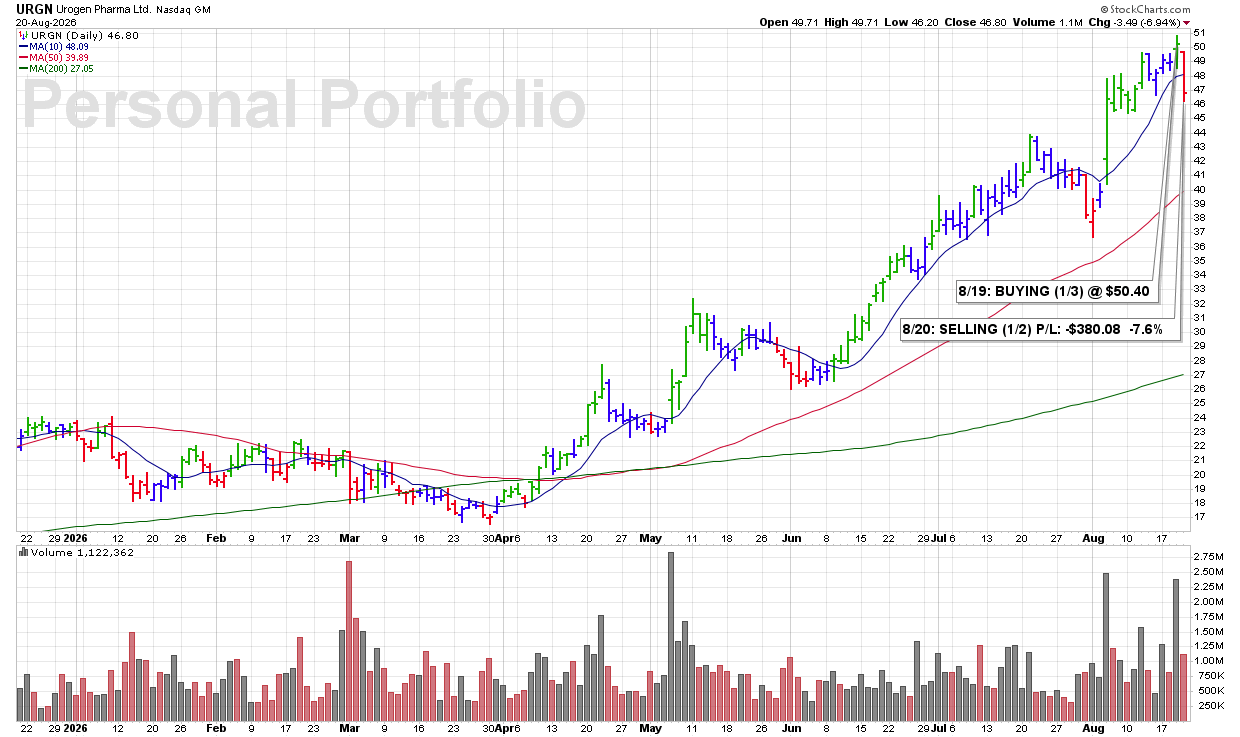
CLICK/TAP CHART TO ZOOM
Chart services courtesy of stockcharts.com. Annotations by James Taulman.
3:44 PM – Selling half of my ECPG position here as shares gap lower and break below the 10 DMA. That loss of our key short-term support is a clear technical violation and a SELL SIGNAL under our rules.
James’ Trader’s Tip: Respect the 10 DMA
• The 10 DMA is our primary technical indicator for identifying changes in short-term price strength.
• A decisive break below the line signals that the stock’s technical condition is weakening.
• Scaling out allows us to reduce risk immediately while leaving part of the position in place if the stock recovers.

CLICK/TAP CHART TO ZOOM
Chart services courtesy of stockcharts.com. Annotations by James Taulman.
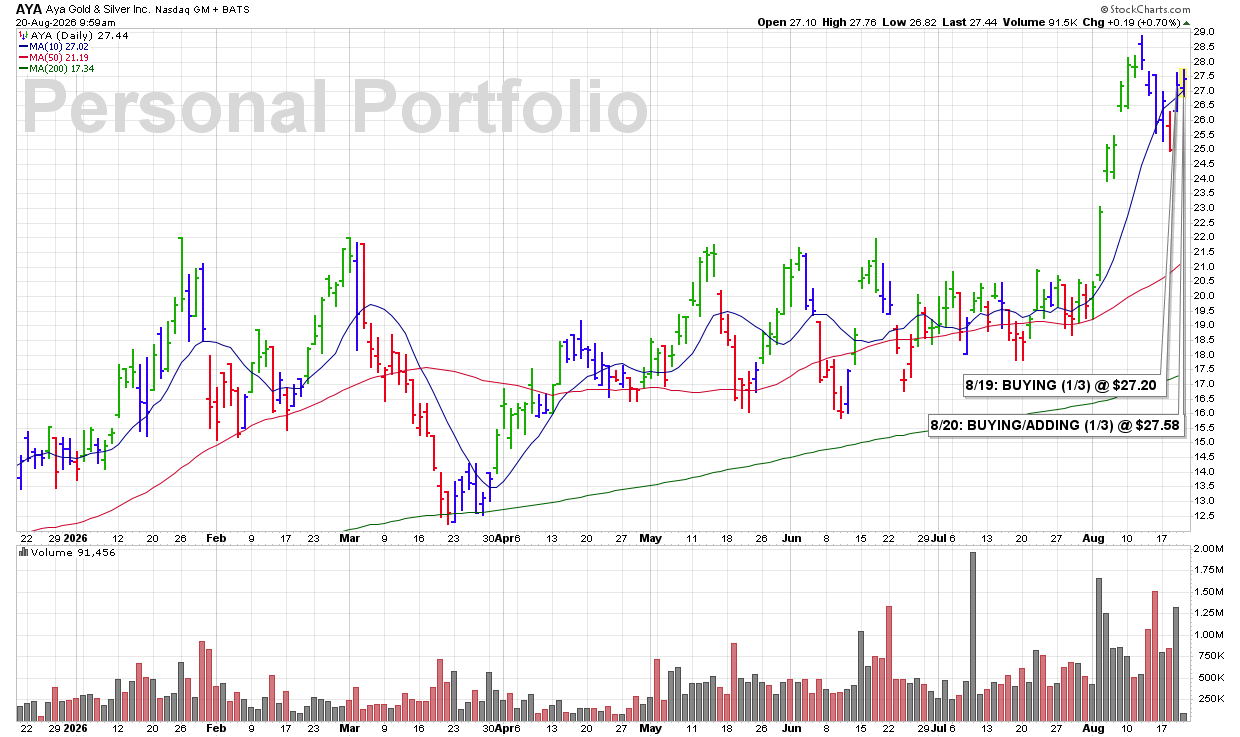
9:40 AM – Adding another 1/3 to my position in this gold-related stock this morning as shares advance from near the 10 DMA. The stock is continuing to show bullish support at this key technical level, giving me enough confirmation to increase my position to 2/3.
James’ Trader’s Tip: Add When the Stock Confirms Your Trade
• Starting with 1/3 keeps initial risk controlled.
• When the stock continues to respect the 10 DMA and advances, it provides additional technical confirmation.
• Scaling into strength allows the stock to earn additional capital rather than committing a full position all at once.
CLICK/TAP CHART TO ZOOM
Chart services courtesy of stockcharts.com. Annotations by James Taulman.
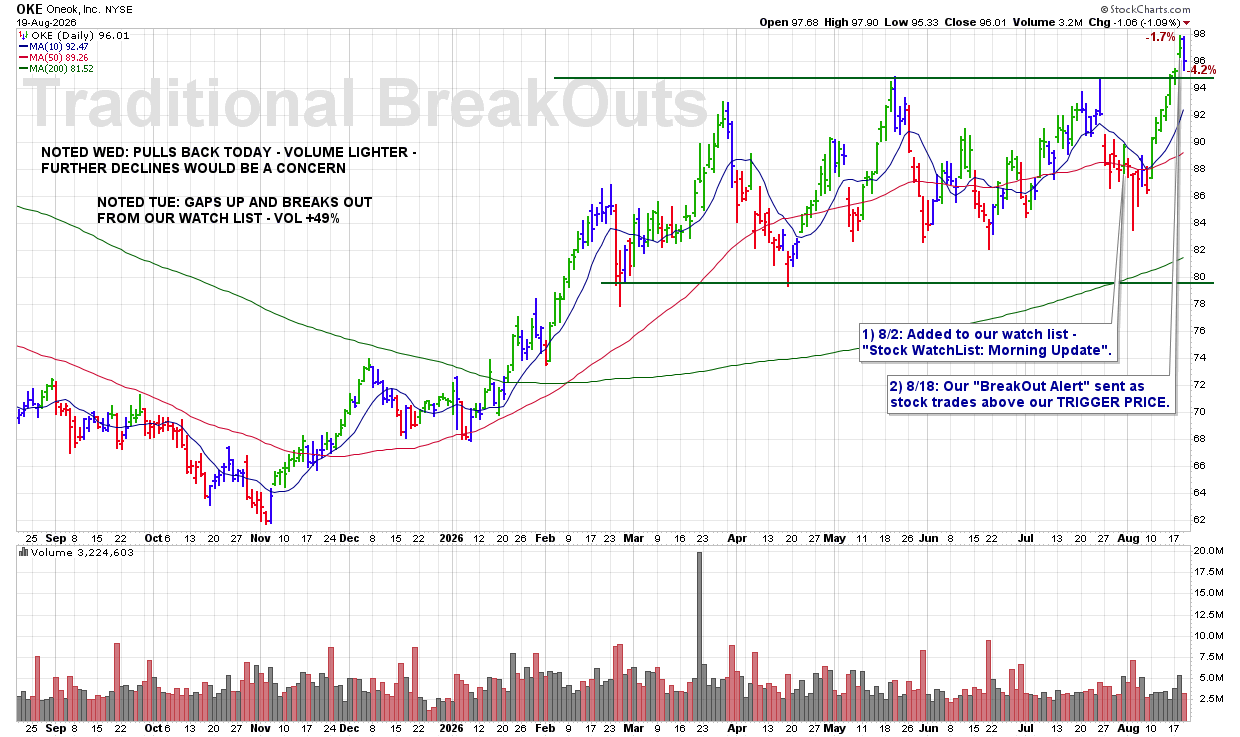
9:30 PM – Here is our latest chart update for this recent breakout from our Traditional BreakOuts Watch List.
CLICK/TAP CHART TO ZOOM
Chart services courtesy of stockcharts.com. Annotations by James Taulman.
We are currently reporting on this stock as an active holding and continue to monitor the stock closely for any technical SELL SIGNALS.
The focus always remains on price/volume action around key support levels, including the 10 DMA, 50 DMA, and any nearby trendline or ROUND-$ support.
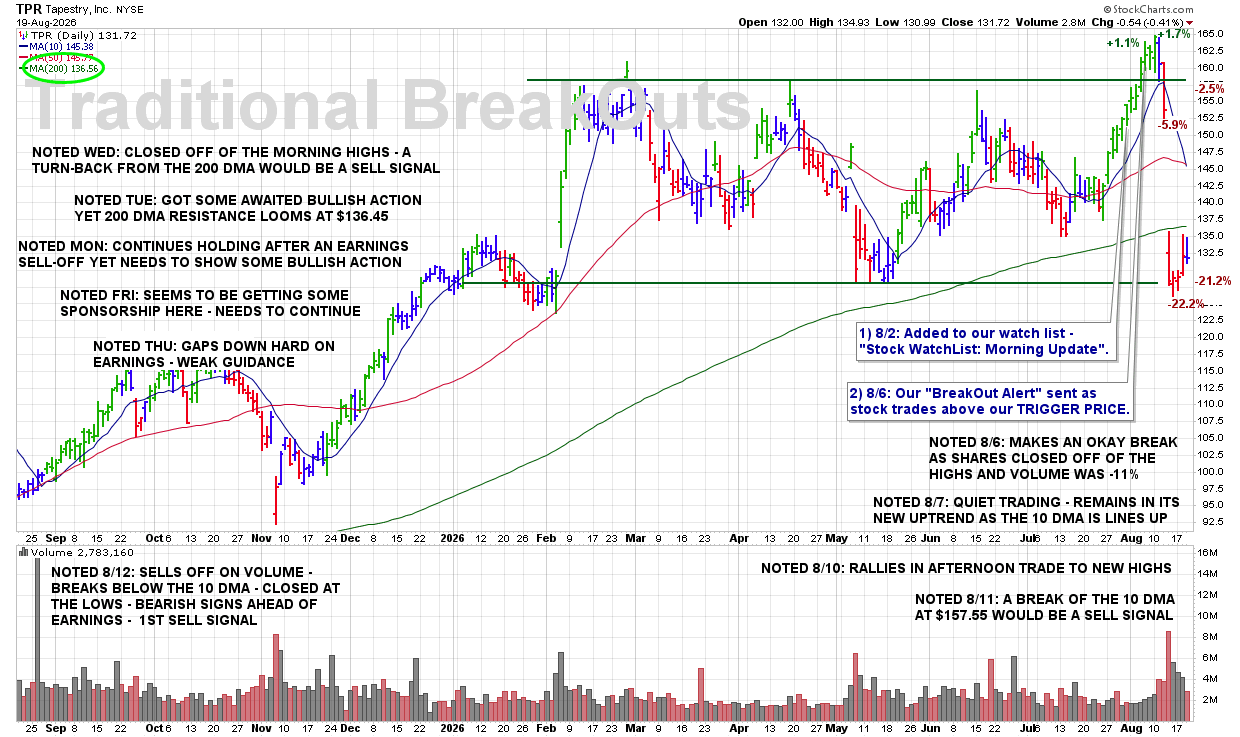
9:25 PM – Here is our latest chart update for this recent breakout from our Traditional BreakOuts Watch List.
CLICK/TAP CHART TO ZOOM
Chart services courtesy of stockcharts.com. Annotations by James Taulman.
We are currently reporting on this stock as an active holding and continue to monitor the stock closely for any technical SELL SIGNALS.
The focus always remains on price/volume action around key support levels, including the 10 DMA, 50 DMA, and any nearby trendline or ROUND-$ support.
9:20 PM – Here is our latest chart update for this recent breakout from our Traditional BreakOuts Watch List

CLICK/TAP CHART TO ZOOM
Chart services courtesy of stockcharts.com. Annotations by James Taulman.
We are currently reporting on this stock as an active holding and continue to monitor the stock closely for any technical SELL SIGNALS.
The focus always remains on price/volume action around key support levels, including the 10 DMA, 50 DMA, and any nearby trendline or ROUND-$ support.
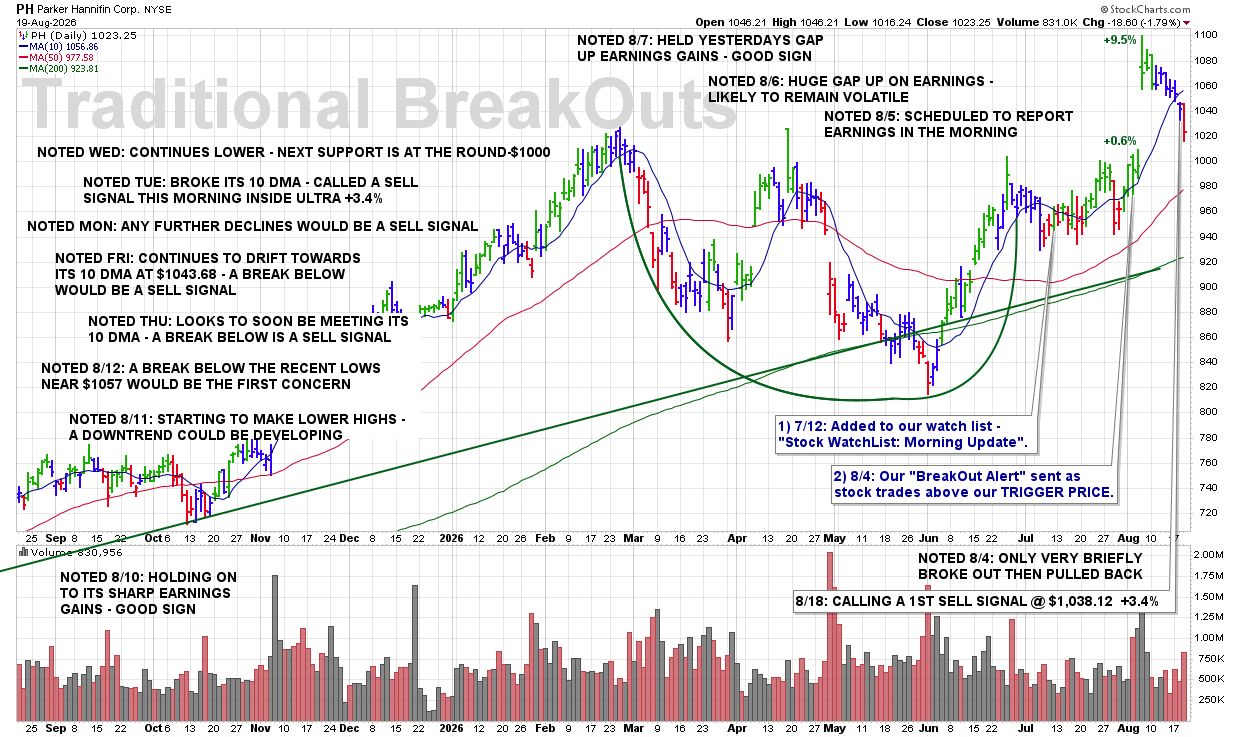
9:15 PM – Here is our latest chart update for this recent breakout from our Traditional BreakOuts Watch List
CLICK/TAP CHART TO ZOOM
Chart services courtesy of stockcharts.com. Annotations by James Taulman.
We are currently reporting on this stock as an active holding and continue to monitor the stock closely for any technical SELL SIGNALS.
The focus always remains on price/volume action around key support levels, including the 10 DMA, 50 DMA, and any nearby trendline or ROUND-$ support.
9:10 PM – Here is our latest chart update for this recent breakout from our Traditional BreakOuts Watch List.
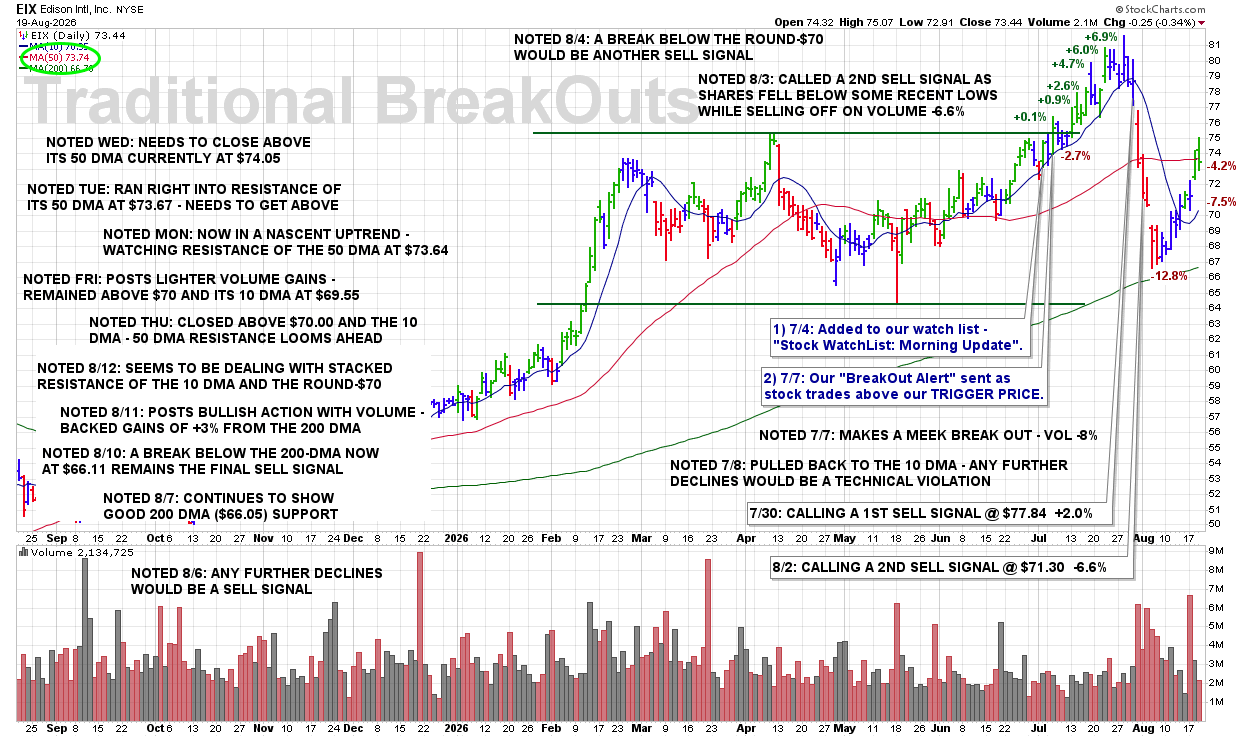
CLICK/TAP CHART TO ZOOM
Chart services courtesy of stockcharts.com. Annotations by James Taulman.
We are currently reporting on this stock as an active holding and continue to monitor the stock closely for any technical SELL SIGNALS.
The focus always remains on price/volume action around key support levels, including the 10 DMA, 50 DMA, and any nearby trendline or ROUND-$ support.
9:05 PM – Here is our latest chart update for this recent breakout from our Traditional BreakOuts Watch List.
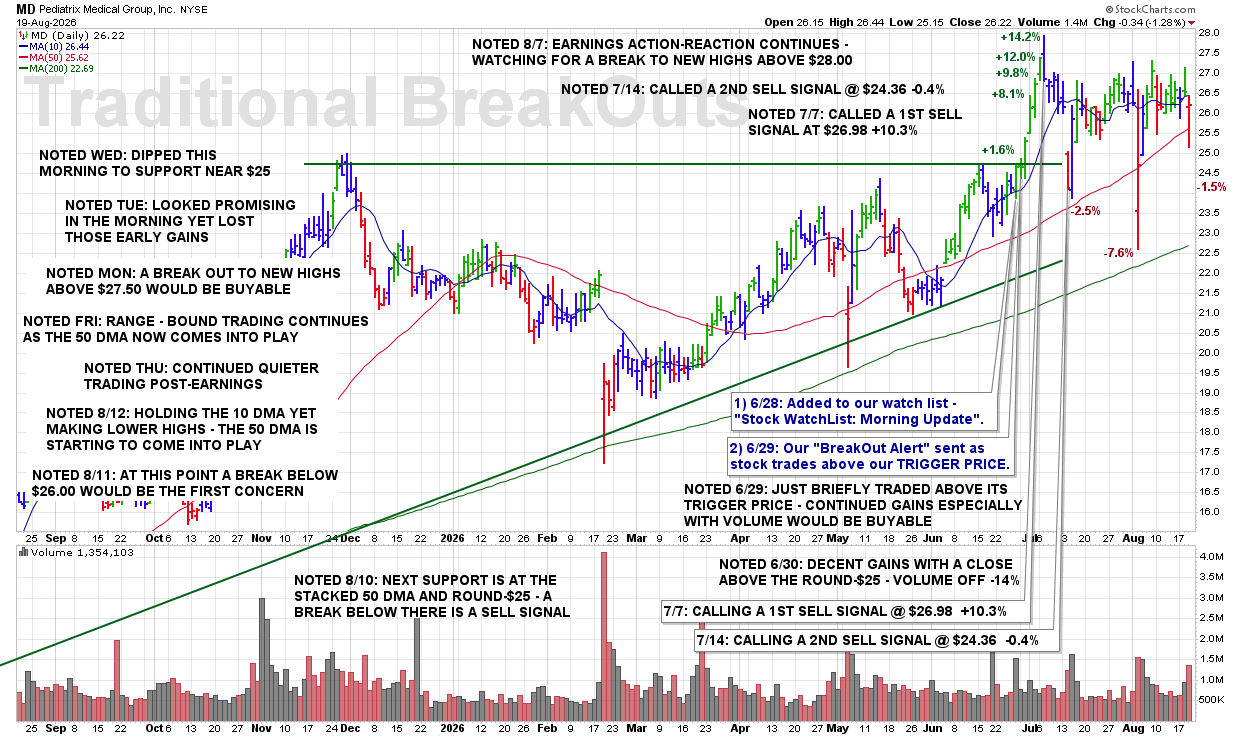
CLICK/TAP CHART TO ZOOM
Chart services courtesy of stockcharts.com. Annotations by James Taulman.
We are currently reporting on this stock as an active holding and continue to monitor the stock closely for any technical SELL SIGNALS.
The focus always remains on price/volume action around key support levels, including the 10 DMA, 50 DMA, and any nearby trendline or ROUND-$ support.
9:00 PM – Here is our latest chart update for this recent breakout from our Traditional BreakOuts Watch List.

CLICK/TAP CHART TO ZOOM
Chart services courtesy of stockcharts.com. Annotations by James Taulman.
We are currently reporting on this stock as an active holding and continue to monitor the stock closely for any technical SELL SIGNALS.
The focus always remains on price/volume action around key support levels, including the 10 DMA, 50 DMA, and any nearby trendline or ROUND-$ support.
3:57 PM – Picking up a 1/3 position in this gold-mining stock as gold-related names show noticeable strength this afternoon, and I’m looking to participate in that move. AYA shares are advancing from the 10 DMA on a 76% increase in volume. That combination of support at the 10 DMA, rising price, and sharply expanding volume is one of my standard technical BUY SIGNALS.
James’ Trader’s Tip: Follow the Price-and-Volume Evidence
• An advance from the 10 DMA shows that an important technical support level is holding.
• A 76% increase in volume adds significant confirmation that demand is strengthening.
• When price and volume align this clearly, pay attention—the stock is telling you something.

CLICK/TAP CHART TO ZOOM
Chart services courtesy of stockcharts.com. Annotations by James Taulman.
3:55 PM – Starting a 1/3 position in this Medical-Products leader as shares advance from near the 10 DMA on an 80% increase in volume. The stock is also breaking above some recent previous highs, adding further bullish technical confirmation. A decisive move above the ROUND-$45 level would be even more constructive.
James’ Trader’s Tip: Look for Multiple Signs of Strength
• Advancing from the 10 DMA provides the initial bullish technical signal.
• Sharply increased volume confirms stronger buying demand behind the move.
• Breaking above previous highs adds another layer of confirmation and increases the probability that a new advance may be developing.
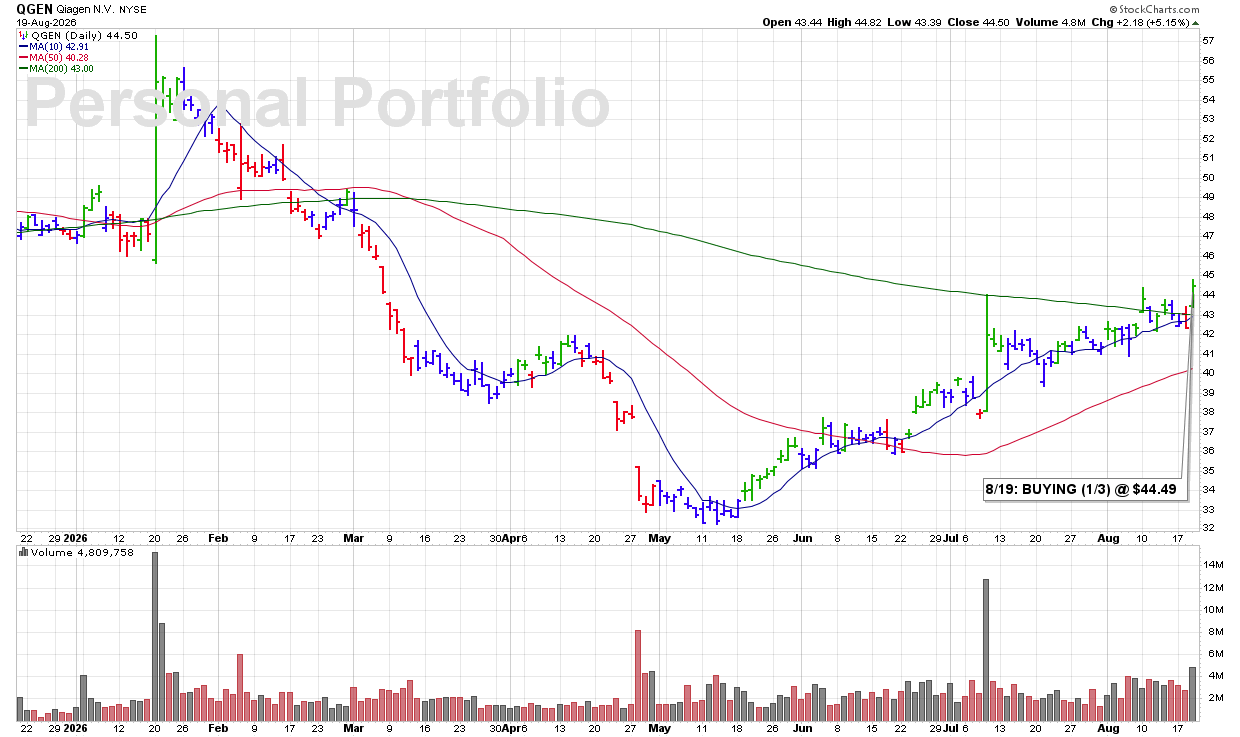
CLICK/TAP CHART TO ZOOM
Chart services courtesy of stockcharts.com. Annotations by James Taulman.
3:44 PM – Initiating a 1/3 position in this Biotech stock near the close as shares display several bullish technical characteristics: (1) trading higher from near the 10 DMA, (2) breaking out above the ROUND-$50 level, and (3) trading on a massive 200% increase in volume. I cannot ignore this combination of bullish price-and-volume action, so I’m taking an initial position here.
James’ Trader’s Tip: When the Evidence Stacks Up, Pay Attention
• Advancing from the 10 DMA provides an initial sign of technical strength.
• Breaking through a key resistance level adds further confirmation.
• When those signals are accompanied by a massive increase in volume, the stock is clearly demanding attention.

CLICK/TAP CHART TO ZOOM
Chart services courtesy of stockcharts.com. Annotations by James Taulman.
3:36 PM – Calling a 2ND SELL SIGNAL as shares break below our noted 1st SUPPORT at the ROUND-$350 level and appear set to close near the session lows. The next significant support is the 50 DMA, currently at $338.46, approximately 2.3% below the current price. A break of that level would represent another significant technical violation.
ULTRA Trader’s Tip: Support Levels Give Us a Roadmap
• Identifying support levels in advance removes guesswork when a stock begins weakening.
• When one level fails, immediately know where the next important technical support lies.
• If weakness continues and the next major support level also breaks, that provides additional evidence to reduce exposure.
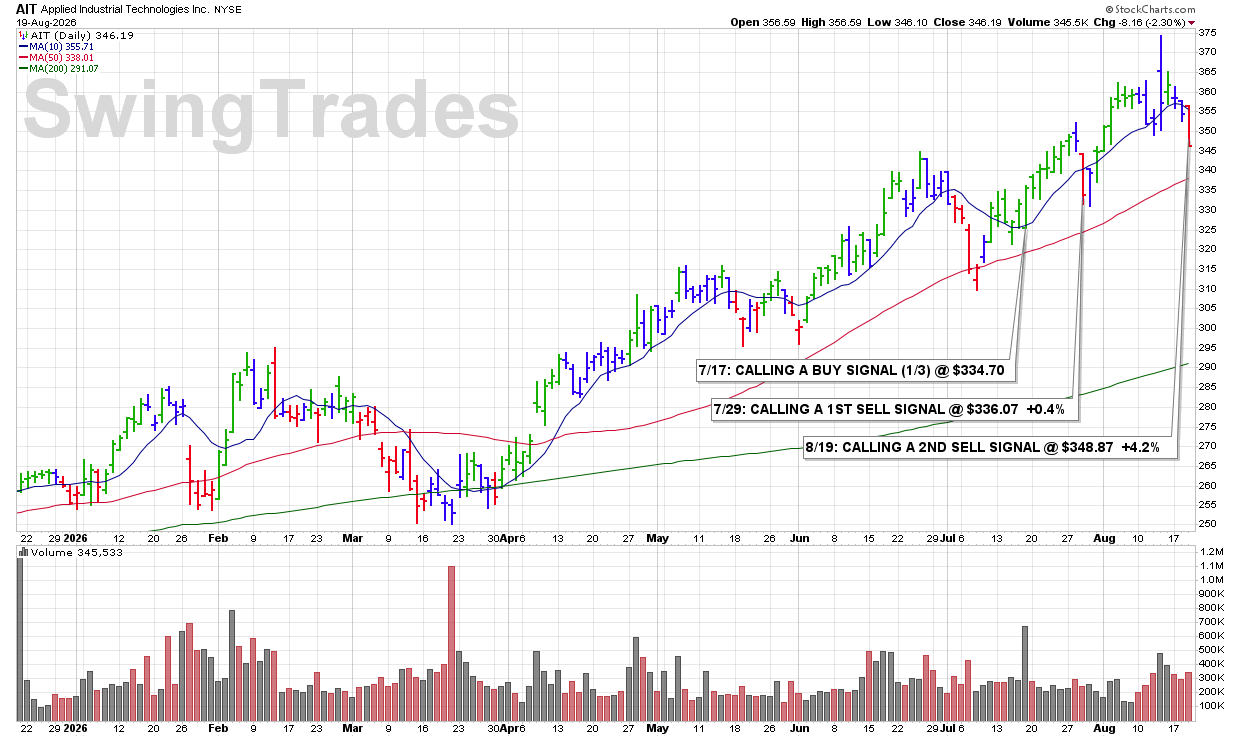
CLICK/TAP CHART TO ZOOM
Chart services courtesy of stockcharts.com. Annotations by James Taulman.
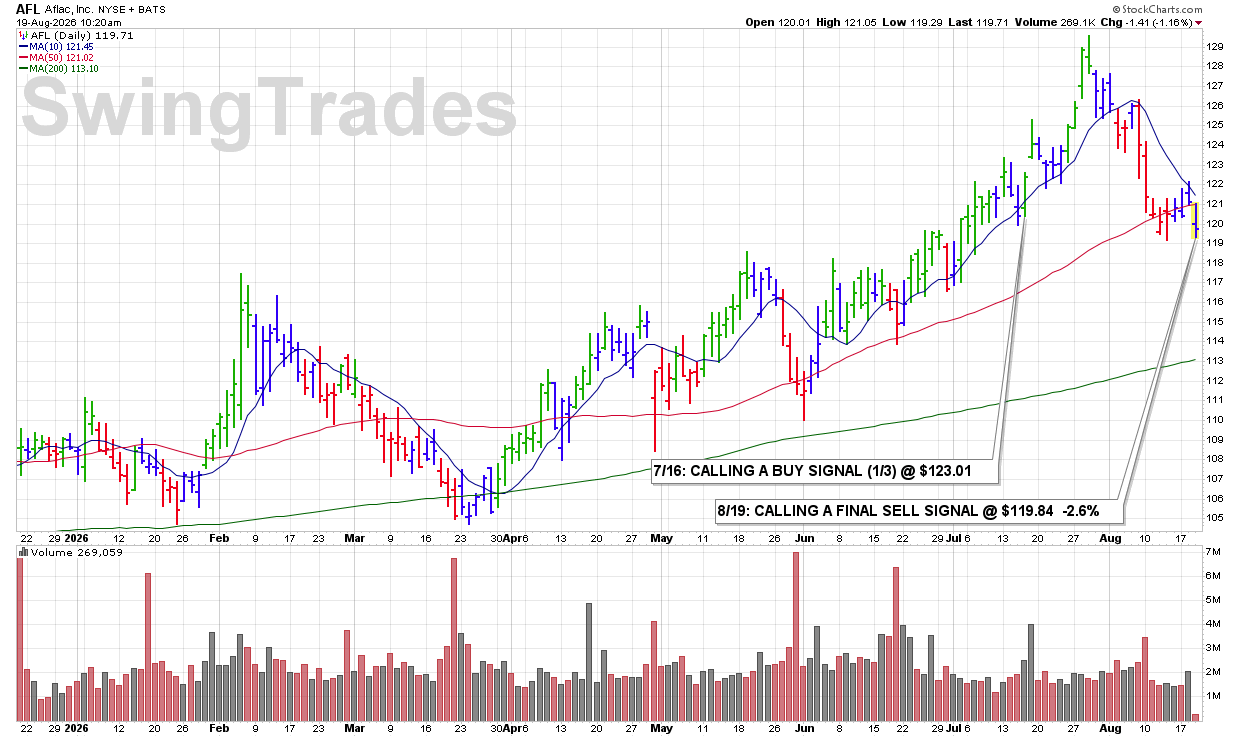
10:11 AM – The stock is gapping down this morning and breaking below our previously noted ROUND-$120 support on increased volume. The combination of a gap lower, loss of support, and expanding selling volume represents multiple bearish technical violations. Calling a 2ND yet FINAL SELL SIGNAL here and to close out coverage on this selection.
ULTRA Trader’s Tip: Multiple Violations Strengthen the Signal
• A gap lower immediately shows increased selling pressure.
• Breaking a previously identified support level adds another bearish technical violation.
• When weakness is accompanied by increased volume, the evidence becomes even stronger—respect the signal and move on.
CLICK/TAP CHART TO ZOOM
Chart services courtesy of stockcharts.com. Annotations by James Taulman.
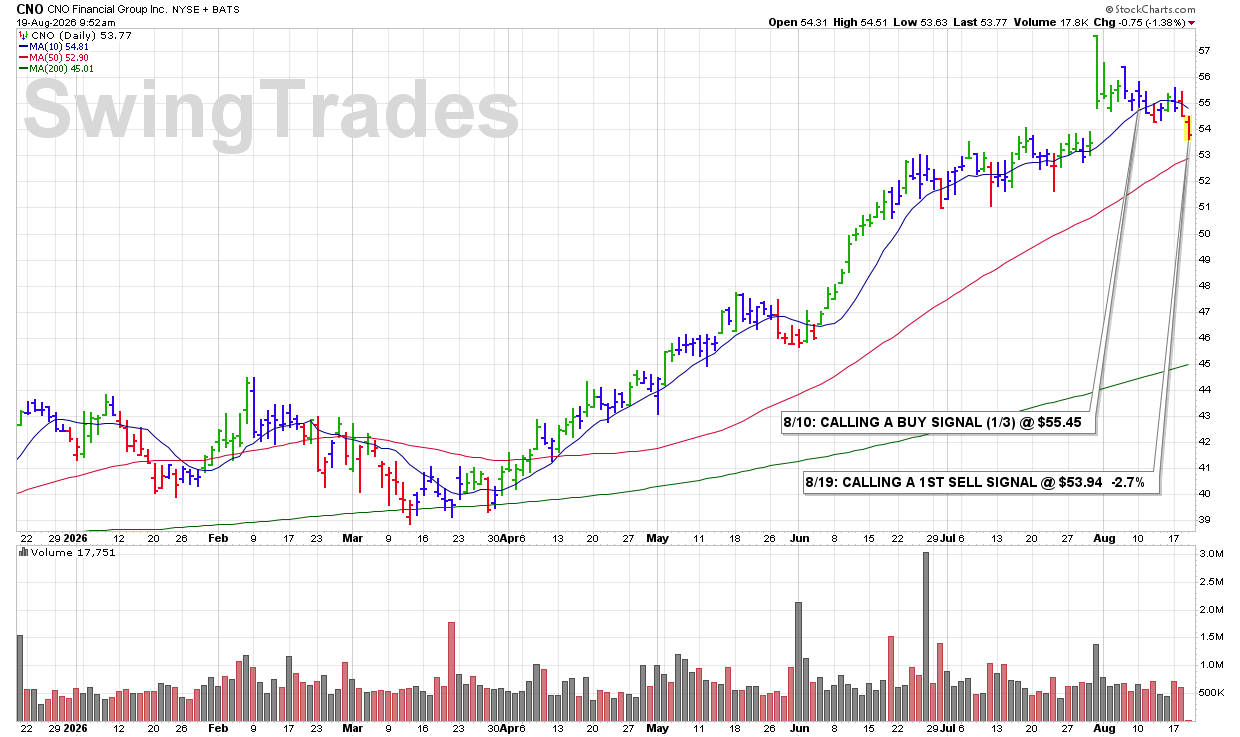
9:37 AM – Calling a 1ST SELL SIGNAL this morning as shares sell off on increased volume and clearly lose support at the 10 DMA. That combination of declining price, expanding volume, and a break of our primary technical support level represents a standard SELL SIGNAL under our rules.
ULTRA Trader’s Tip: Price and Volume Should Confirm Each Other
• A break below the 10 DMA is an important technical warning.
• When that break occurs with increased selling volume, the violation carries greater significance.
• Responding to weakness early helps keep a manageable loss from developing into something larger.
CLICK/TAP CHART TO ZOOM
Chart services courtesy of stockcharts.com. Annotations by James Taulman.
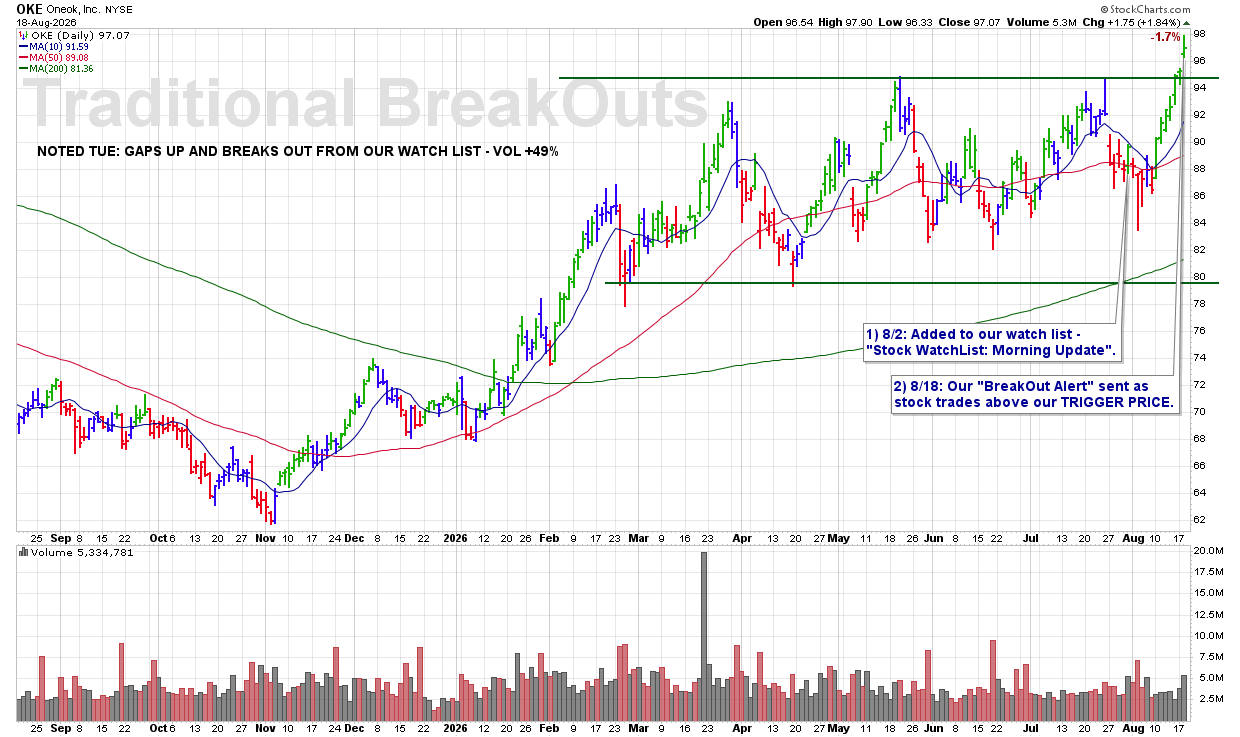
9:30 PM – Here is our latest chart update for this recent breakout from our Traditional BreakOuts Watch List.
CLICK/TAP CHART TO ZOOM
Chart services courtesy of stockcharts.com. Annotations by James Taulman.
We are currently reporting on this stock as an active holding and continue to monitor the stock closely for any technical SELL SIGNALS.
The focus always remains on price/volume action around key support levels, including the 10 DMA, 50 DMA, and any nearby trendline or ROUND-$ support.
PRIVACY POLICY | TERMS & CONDITIONS