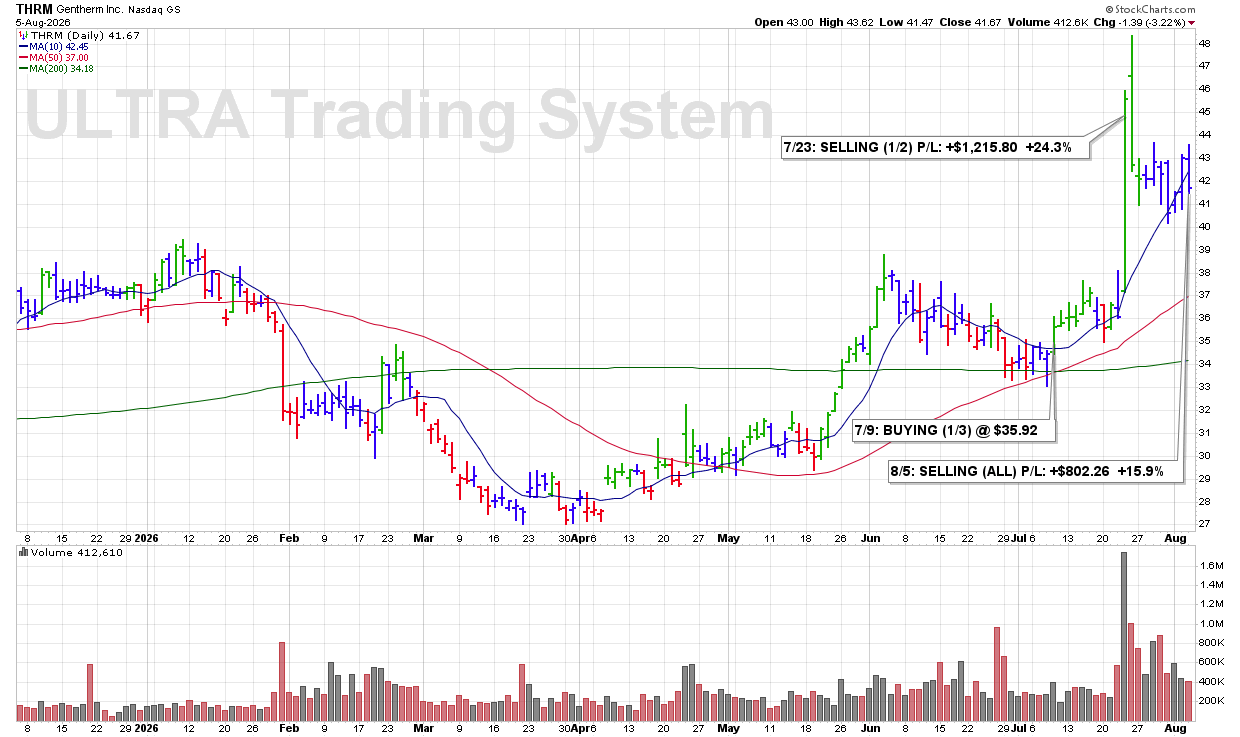
WED 8/5: THRM — Selling All for a Solid Profit +16%

3:44 PM – Selling all of my THRM position here and locking in a solid +15.9% profit. The trade worked well, and I’m taking the gain and moving the capital on to the next opportunity.
James’ Trader’s Tip: Take the Profit When the Trade Has Worked

  • Not every exit needs to come after a major technical breakdown.

  • A strong gain gives you the flexibility to lock in profits and redeploy capital elsewhere.

  • Protecting realized gains is just as important as finding the next BUY SIGNAL

CLICK/TAP CHART TO ZOOM
Chart services courtesy of stockcharts.com. Annotations by James Taulman.

WED 8/5: AM – CALLING A 3RD SELL SIGNAL @ $21.19 -6.4%

3:37 PM – Calling a 3RD and FINAL SELL SIGNAL here as shares sell off with an increase in volume while price is clearly being turned back from the 10 DMA. That repeated failure at the 10 DMA, combined with heavier selling volume, is further bearish technical action and completes the SELL process on this selection.

ULTRA Trader’s Tip: Repeated Failure at the 10 DMA Matters

  • When the 10 DMA repeatedly turns a stock back, it can become clear short-term resistance.

  • Increased volume during a sell-off adds weight to the bearish price action.

  • By the 3RD SELL SIGNAL, the technical evidence has accumulated enough to close out the selection.

CLICK/TAP CHART TO ZOOM
Chart services courtesy of stockcharts.com. Annotations by James Taulman.

WED 8/5: TPR – BUYING (1/3) @ $161.32

10:14 AM – Starting a 1/3 position in this Apparel-Clothing & Shoes leader from our Traditional BreakOuts Watch List as shares trade to new highs this morning on what, at the time of purchase, is above-average volume. The combination of a breakout to new highs and expanding volume gives us a technical BUY SIGNAL.

James’ Trader’s Tip: Buy Strength, Then Let It Prove Itself

  • New highs show that the stock has cleared prior price resistance.

  • Above-average volume adds confirmation that meaningful demand is supporting the breakout.

  • Starting with a 1/3 position allows the stock to prove the move before additional capital is committed.

CLICK/TAP CHART TO ZOOM
Chart services courtesy of stockcharts.com. Annotations by James Taulman.

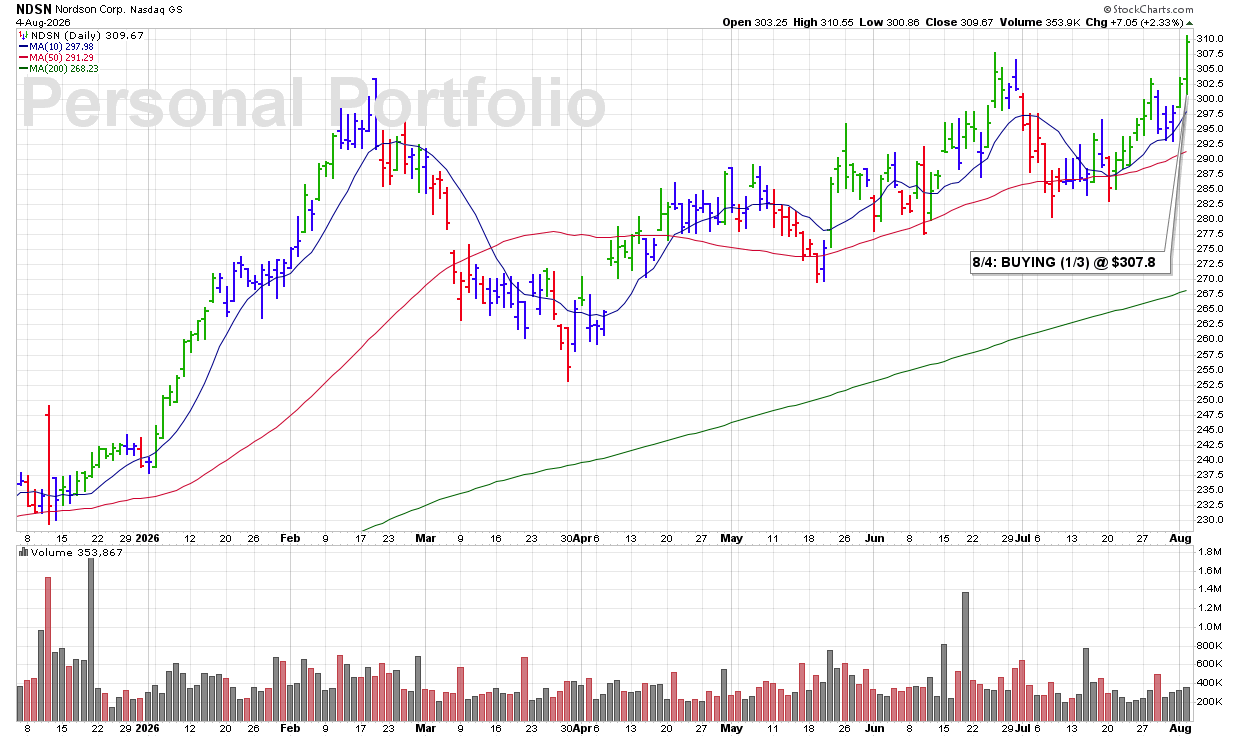
TUE 8/4: NDSN – Made a Decent Breakout Although Volume Ended the Day Off -23%

9:25 PM – Here is our latest chart update for this recent breakout from our Traditional BreakOuts Watch List

CLICK/TAP CHART TO ZOOM
Chart services courtesy of stockcharts.com. Annotations by James Taulman.

We are currently reporting on this stock as an active holding and continue to monitor the stock closely for any technical SELL SIGNALS.

The focus always remains on price/volume action around key support levels, including the 10 DMA, 50 DMA, and any nearby trendline or ROUND-$ support.

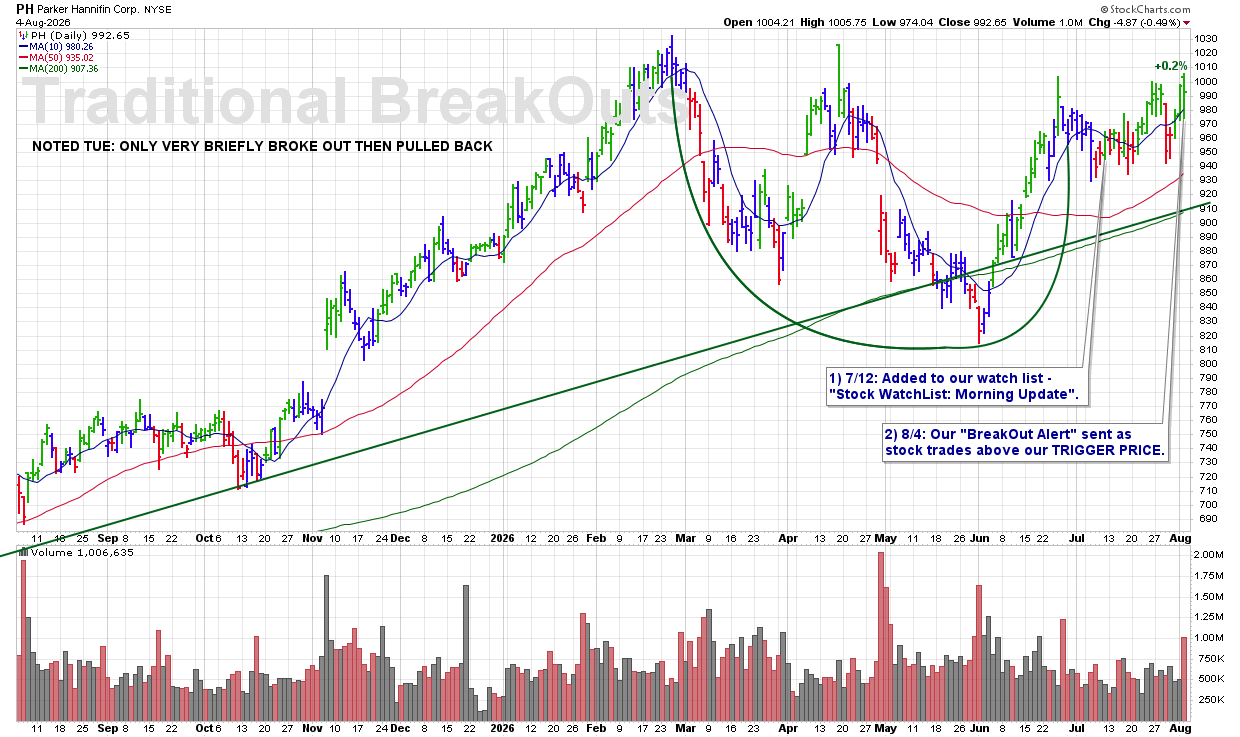
TUE 8/4: PH – Only Very Briefly Broke Out Then Pulled Back

9:25 PM – Here is our latest chart update for this recent breakout from our Traditional BreakOuts Watch List

CLICK/TAP CHART TO ZOOM
Chart services courtesy of stockcharts.com. Annotations by James Taulman.

We are currently reporting on this stock as an active holding and continue to monitor the stock closely for any technical SELL SIGNALS.

The focus always remains on price/volume action around key support levels, including the 10 DMA, 50 DMA, and any nearby trendline or ROUND-$ support.

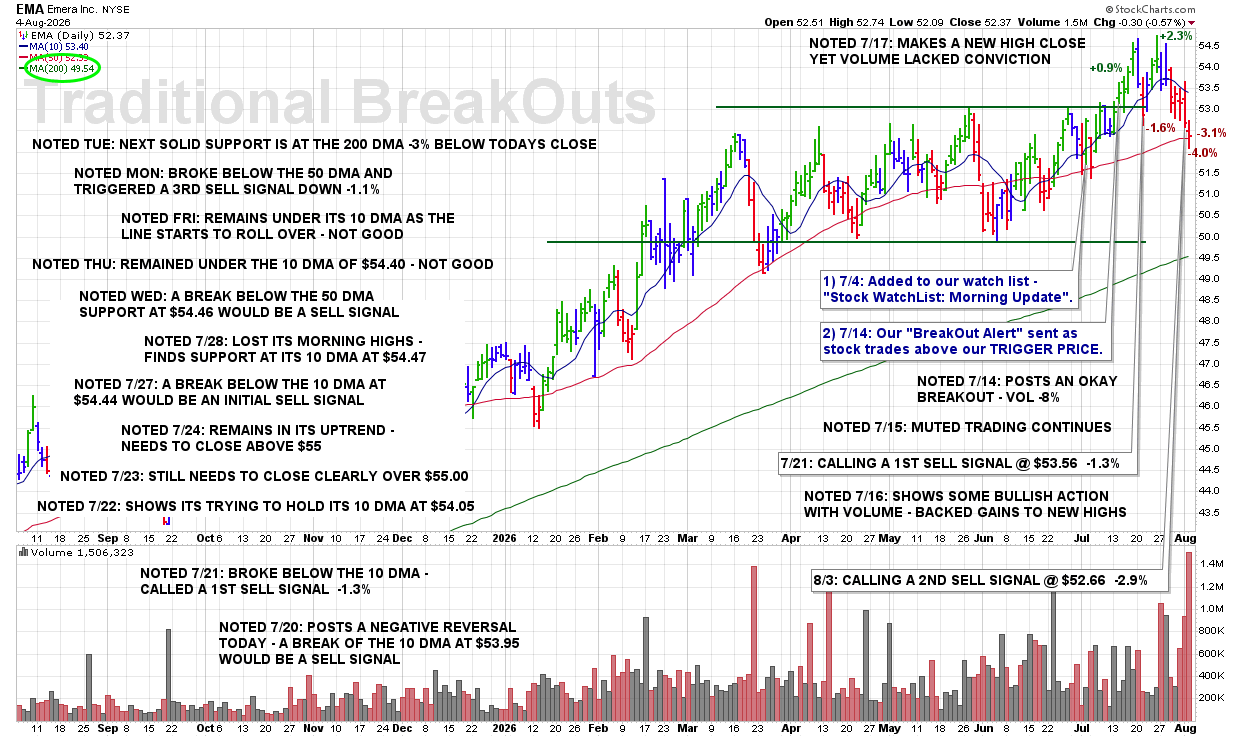
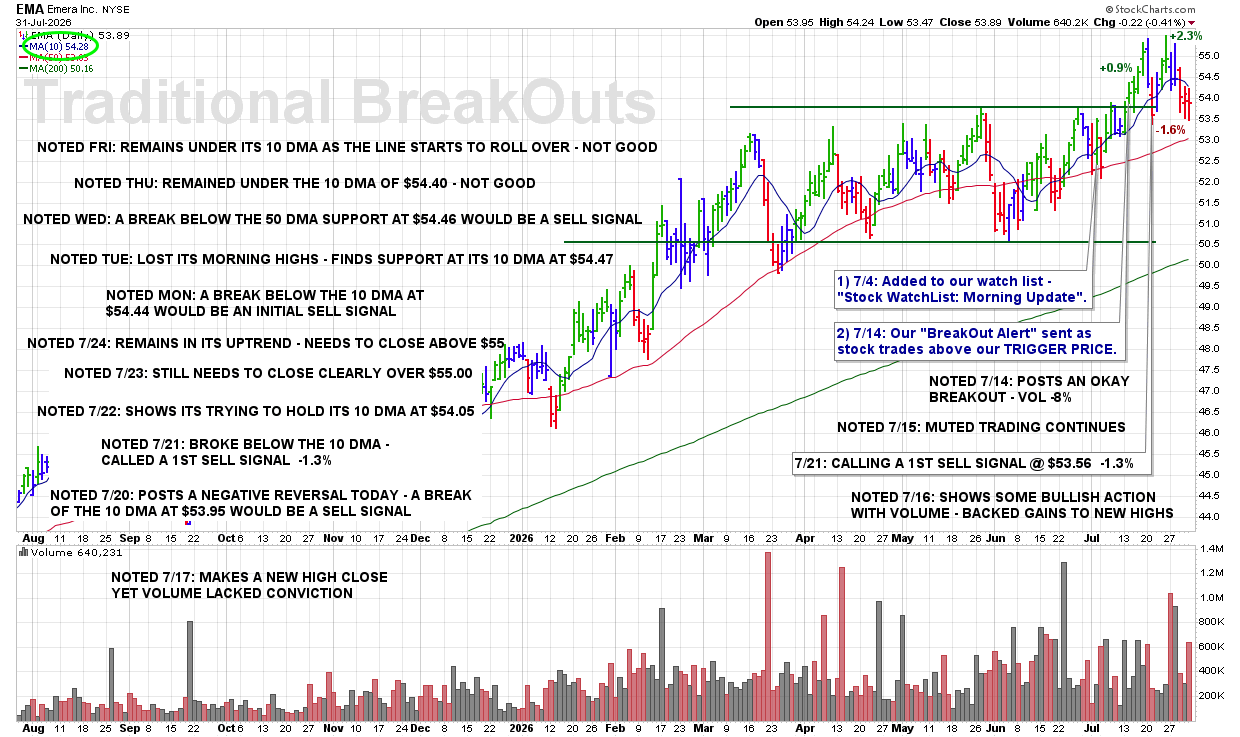
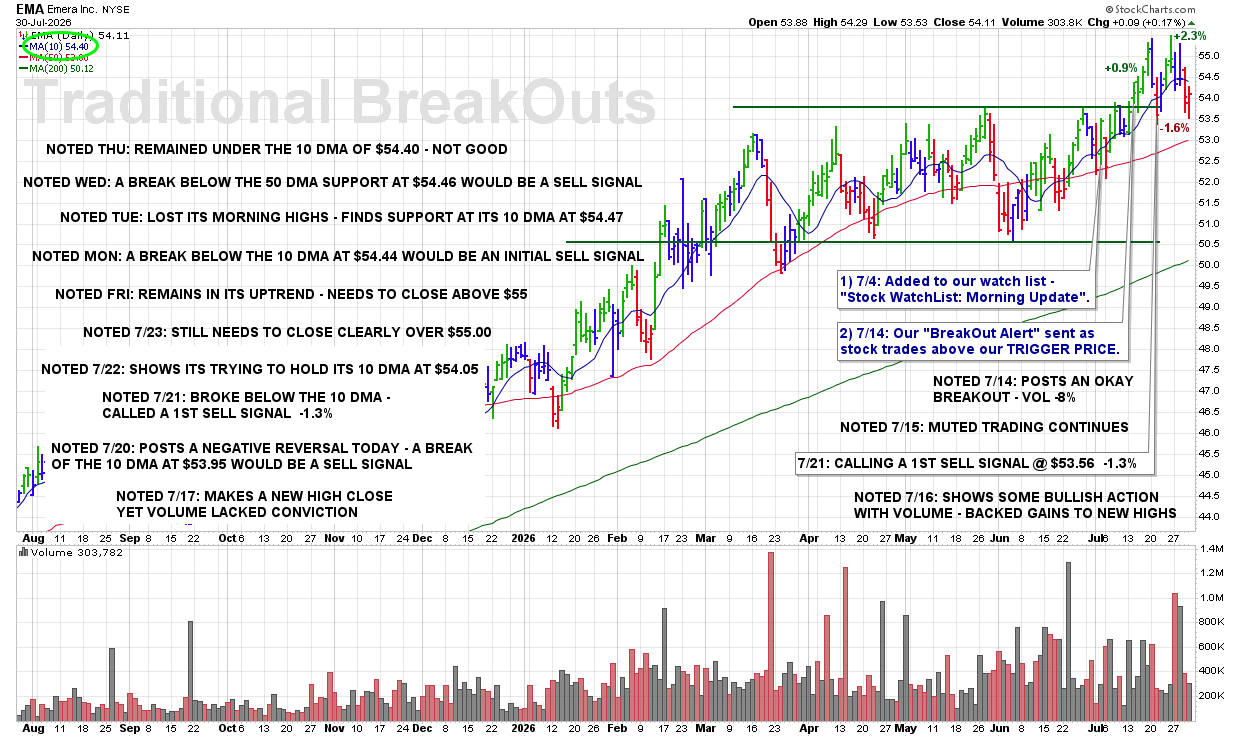
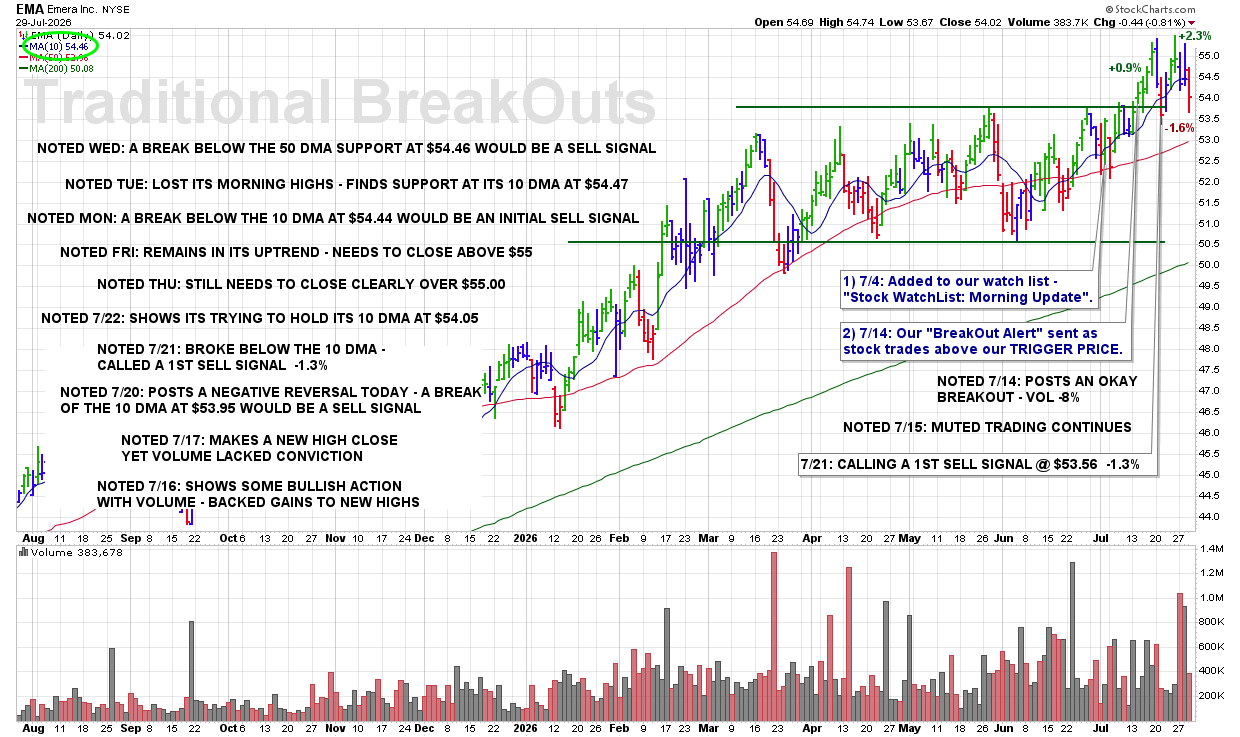
TUE 8/4: EMA – Next Solid Support Is at the 200 DMA -3% Below Todays Close

9:15 PM – Here is our latest chart update for this recent breakout from our Traditional BreakOuts Watch List

CLICK/TAP CHART TO ZOOM
Chart services courtesy of stockcharts.com. Annotations by James Taulman.

We are currently reporting on this stock as an active holding and continue to monitor the stock closely for any technical SELL SIGNALS.

The focus always remains on price/volume action around key support levels, including the 10 DMA, 50 DMA, and any nearby trendline or ROUND-$ support.

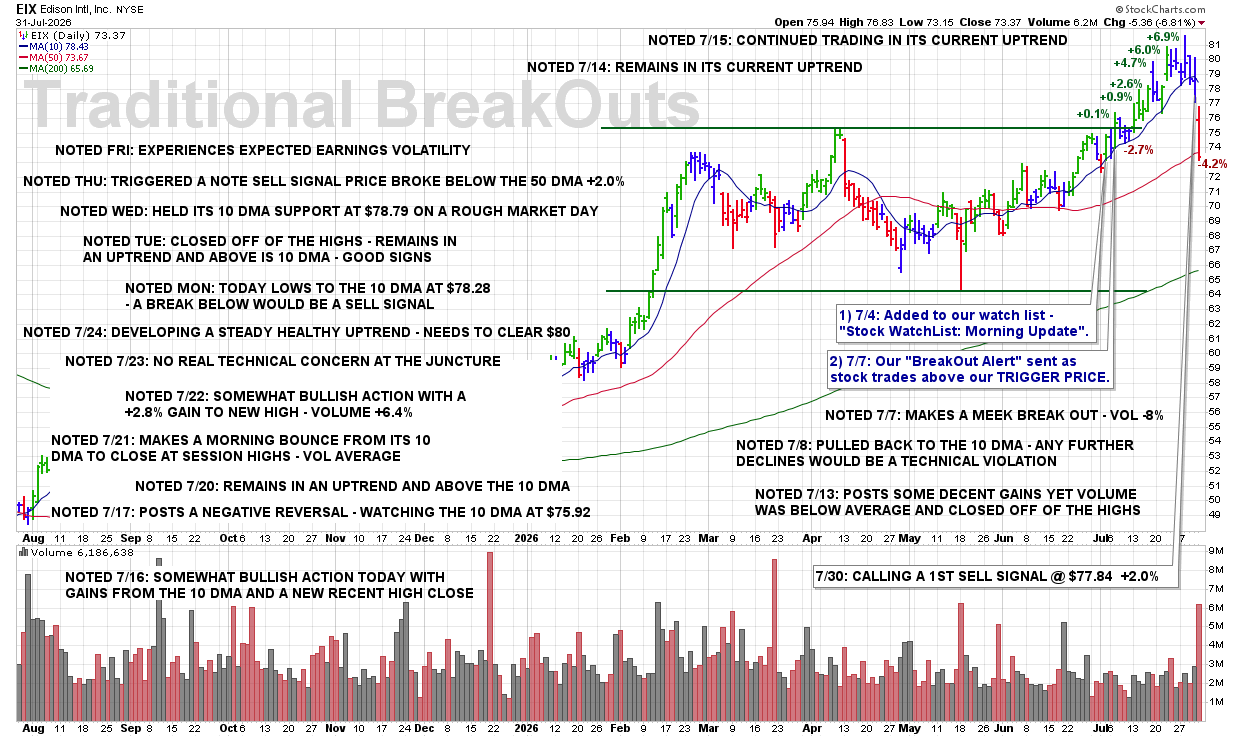
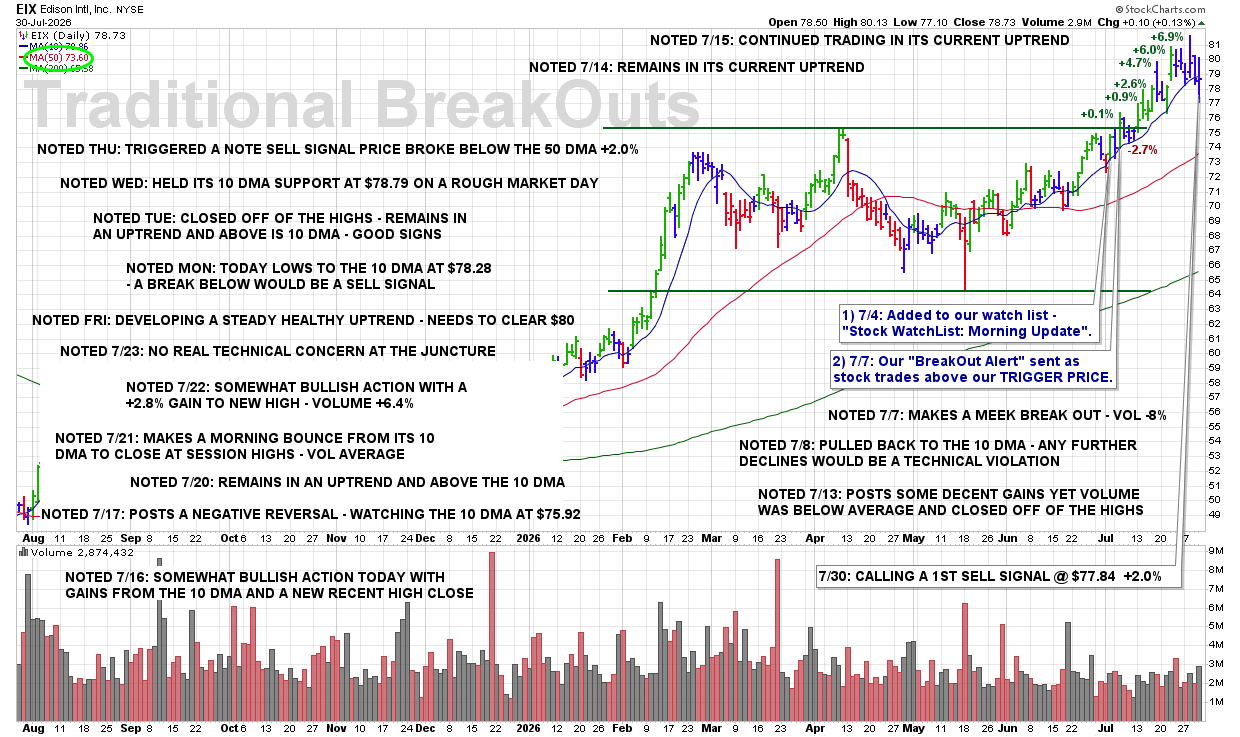
TUE 8/4: EIX – A Break Below the Round-$70 Would Be Another Sell Signal

9:10 PM – Here is our latest chart update for this recent breakout from our Traditional BreakOuts Watch List.

CLICK/TAP CHART TO ZOOM
Chart services courtesy of stockcharts.com. Annotations by James Taulman.

We are currently reporting on this stock as an active holding and continue to monitor the stock closely for any technical SELL SIGNALS.

The focus always remains on price/volume action around key support levels, including the 10 DMA, 50 DMA, and any nearby trendline or ROUND-$ support.

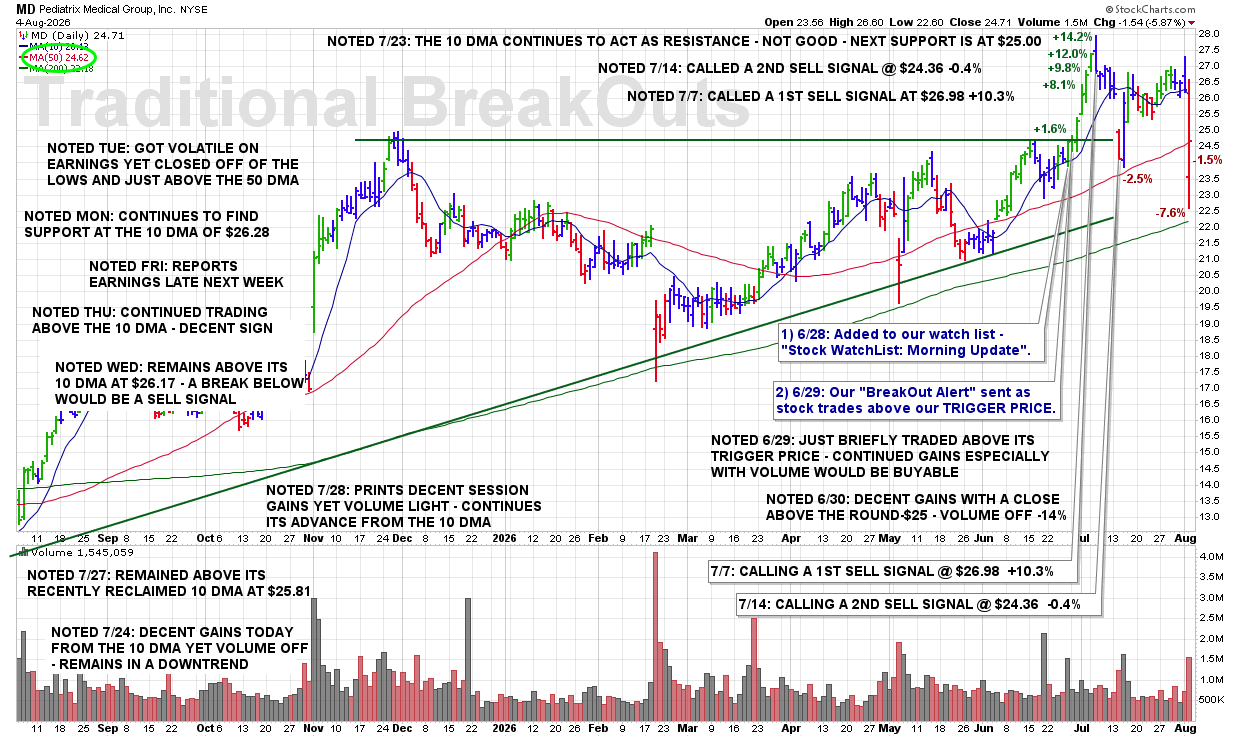
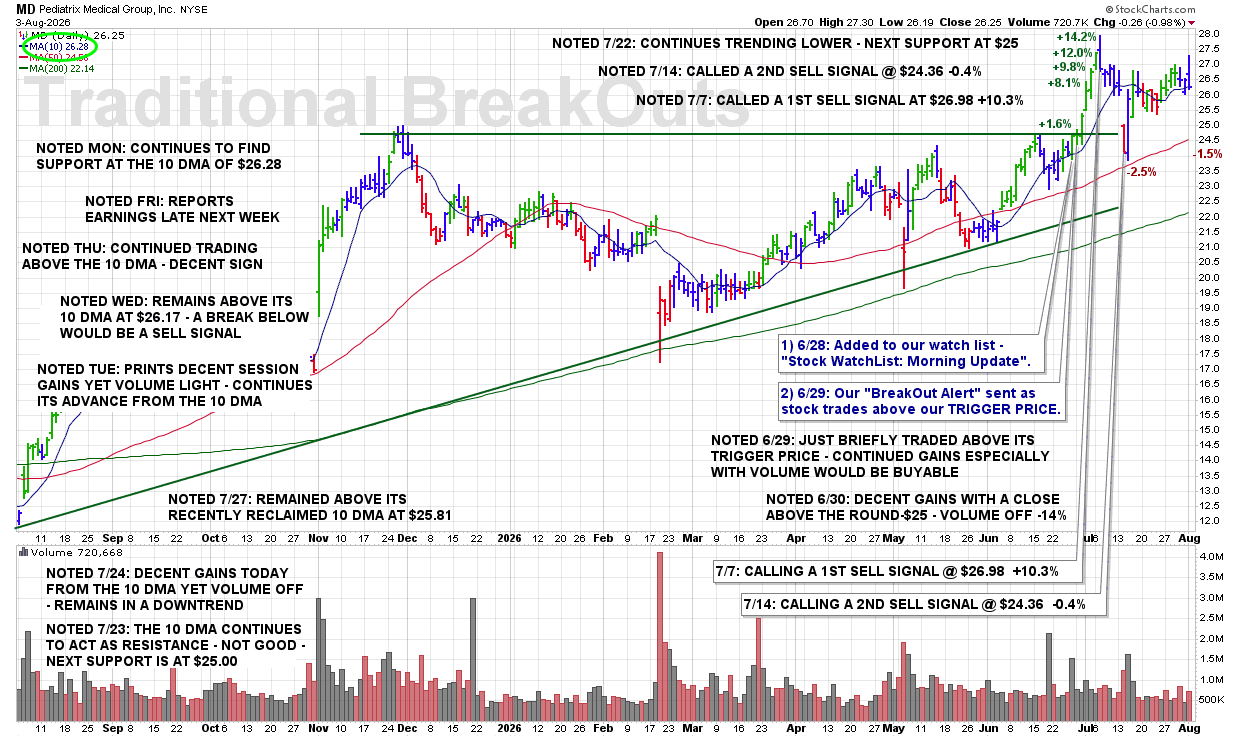
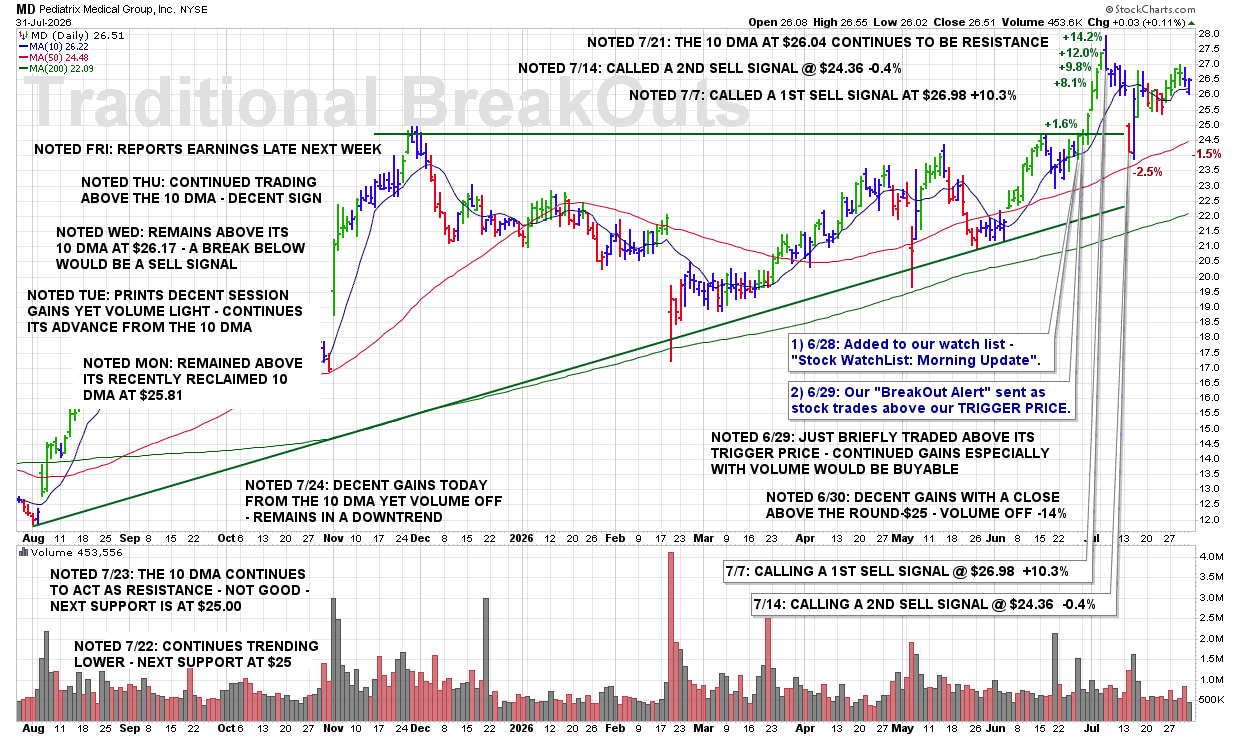
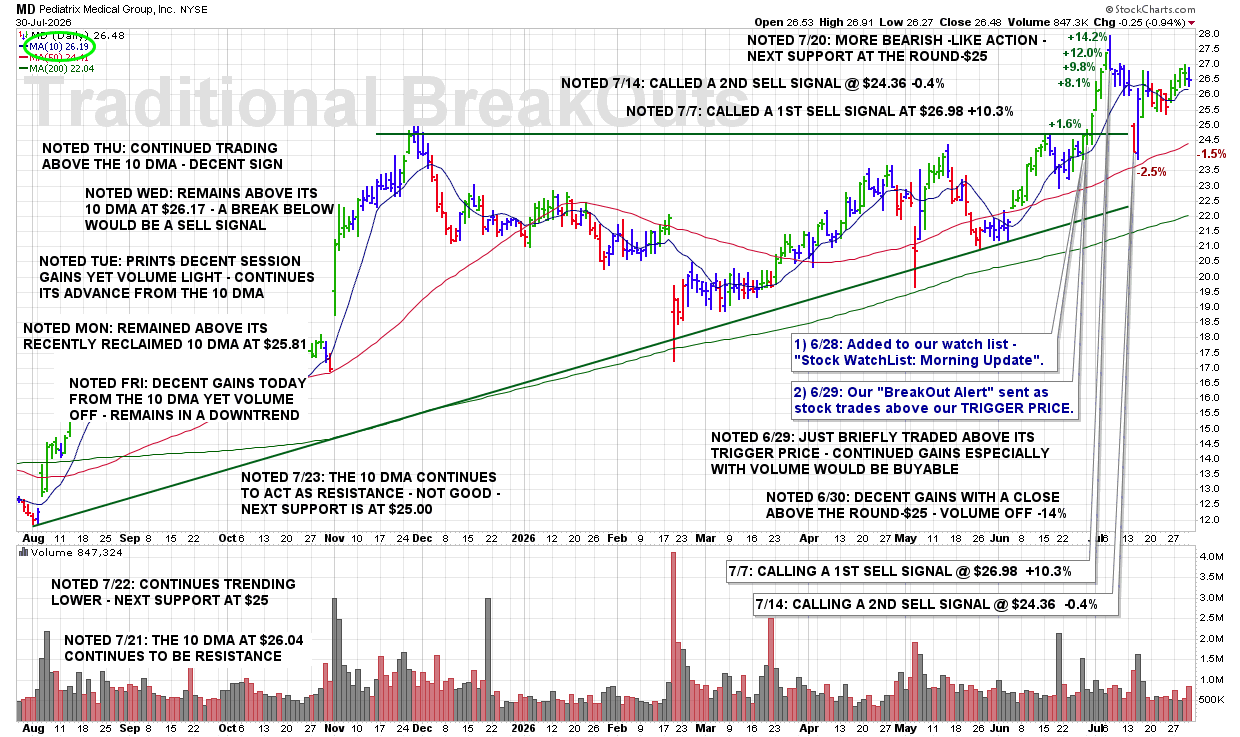
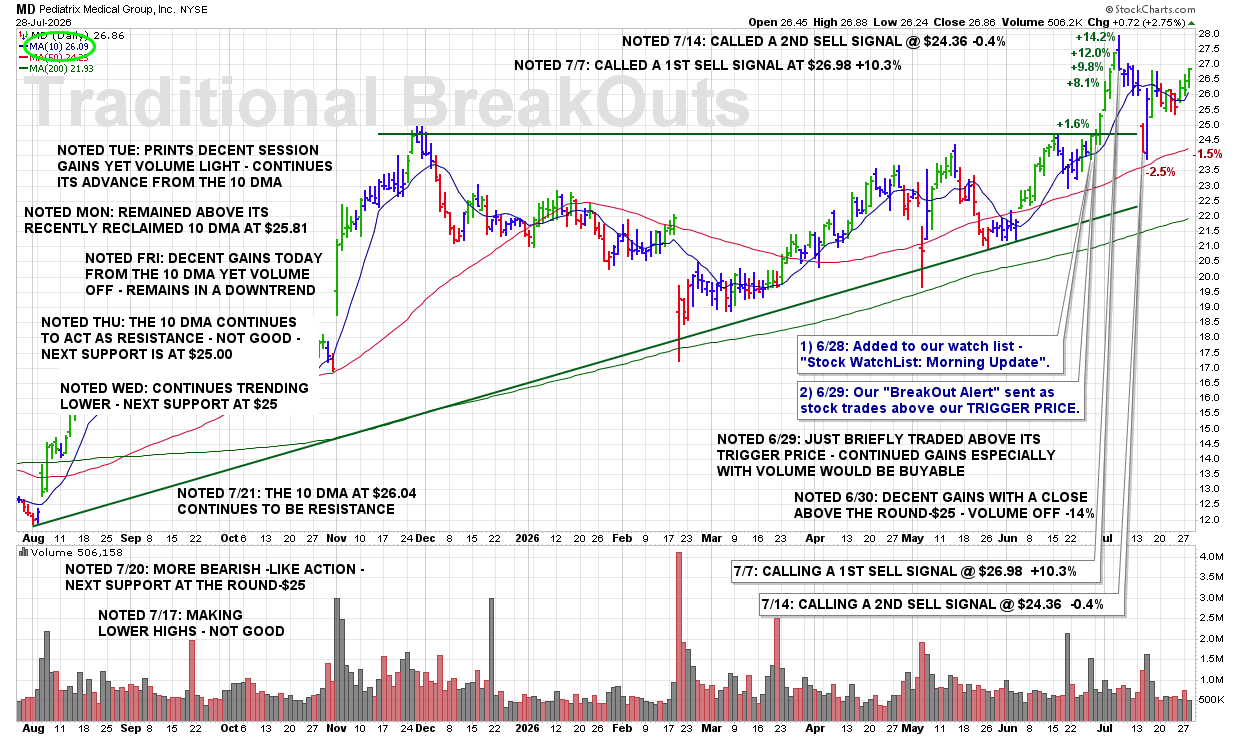
TUE 8/4: MD – Got Volatile on Earnings Yet Closed Off of the Lows and Just Above the 50 DMA

9:05 PM – Here is our latest chart update for this recent breakout from our Traditional BreakOuts Watch List.

CLICK/TAP CHART TO ZOOM
Chart services courtesy of stockcharts.com. Annotations by James Taulman.

We are currently reporting on this stock as an active holding and continue to monitor the stock closely for any technical SELL SIGNALS.

The focus always remains on price/volume action around key support levels, including the 10 DMA, 50 DMA, and any nearby trendline or ROUND-$ support.

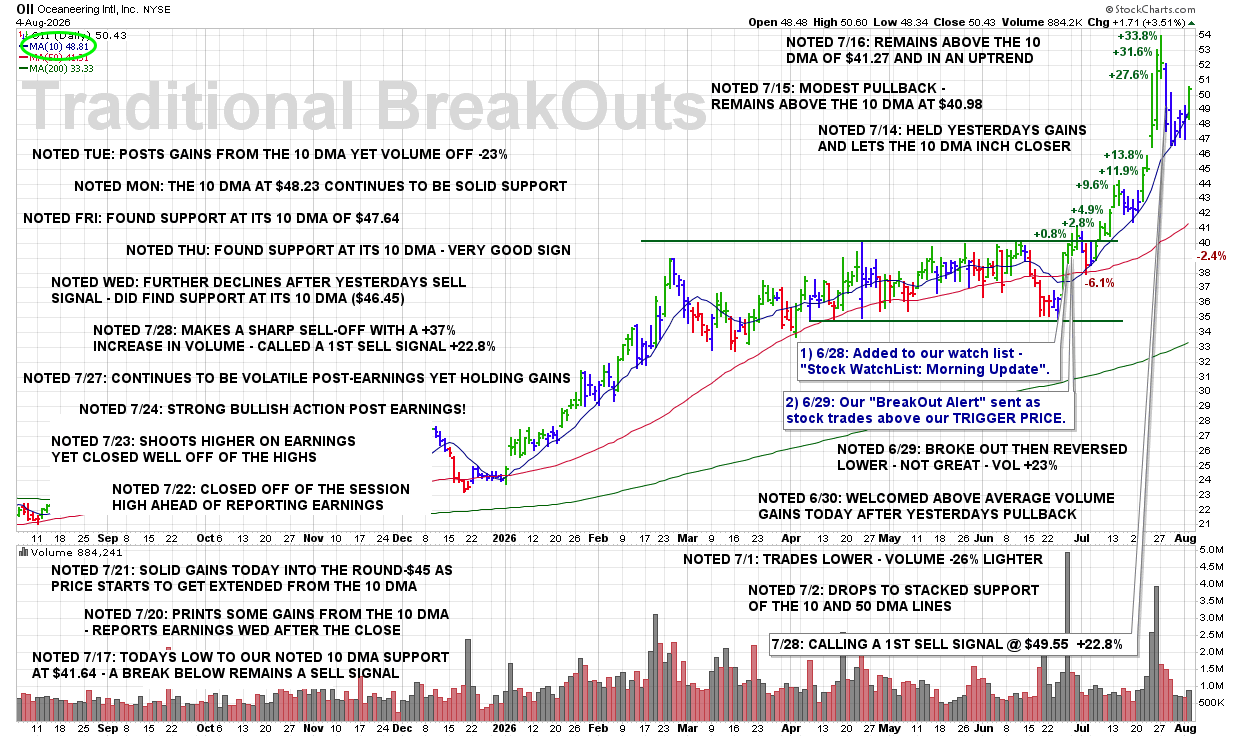
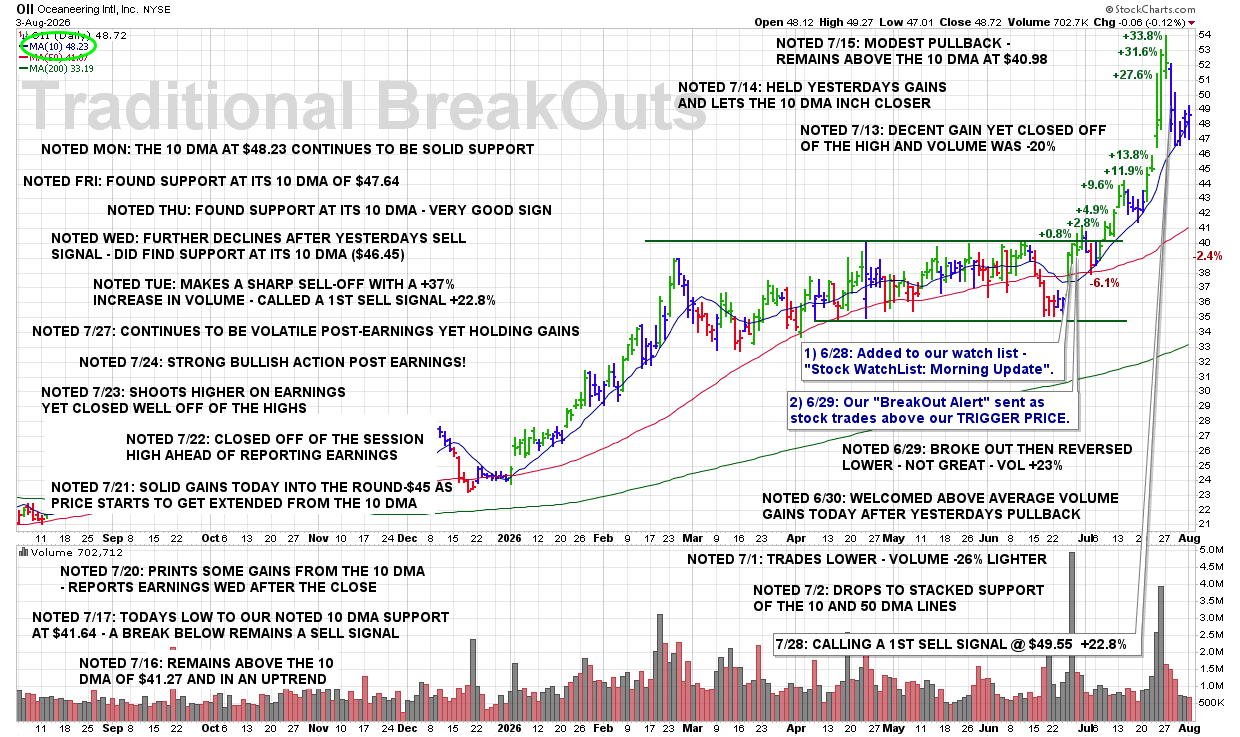
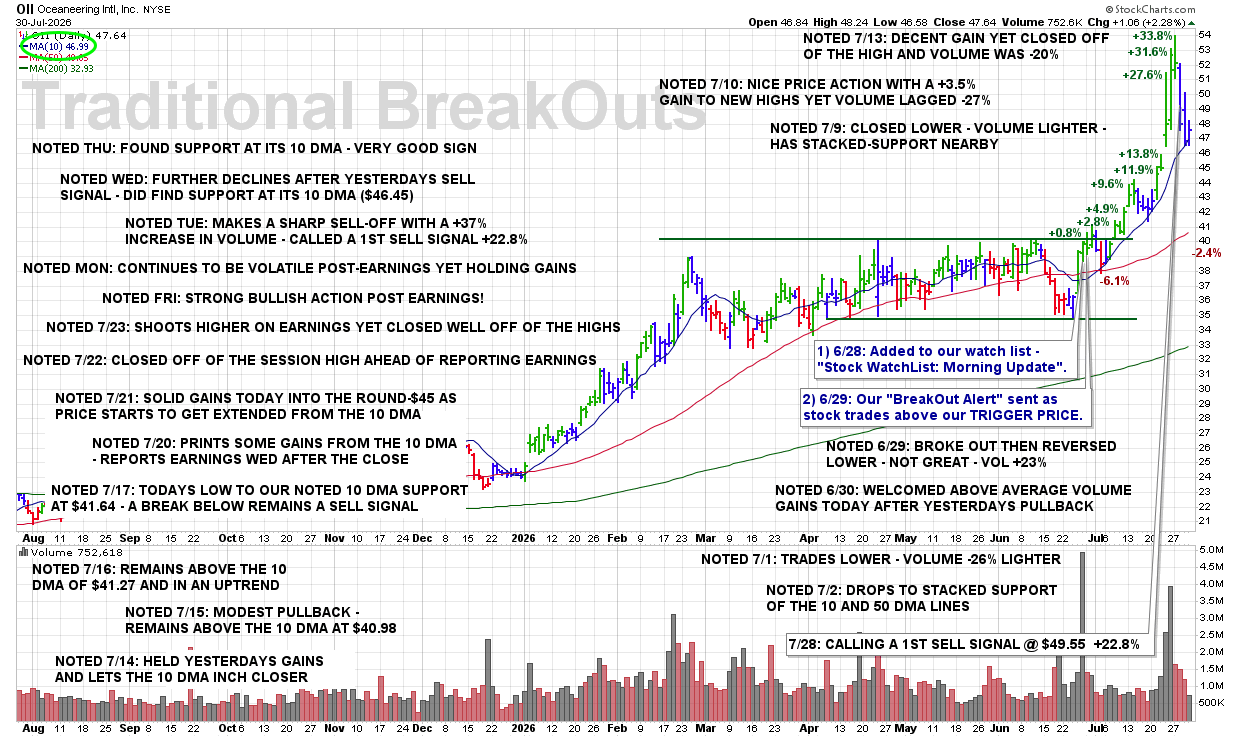
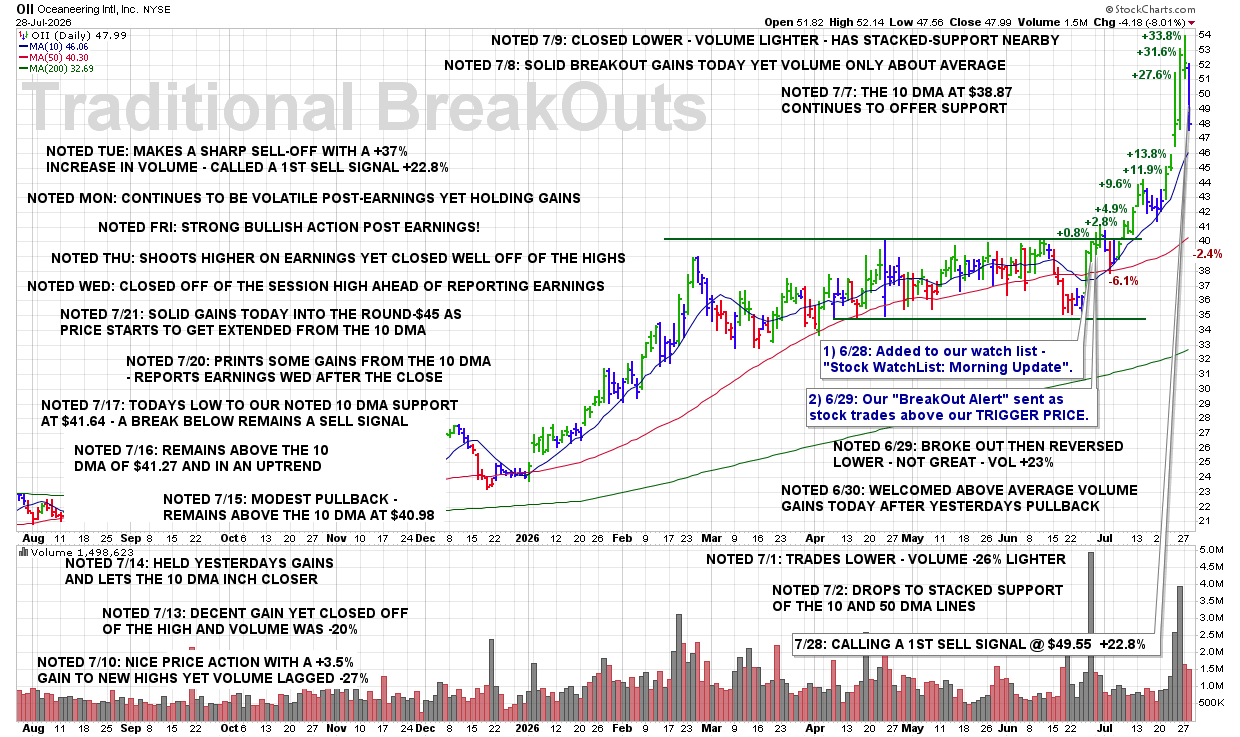
TUE 8/4: OII – Posts Gains From the 10 DMA Yet Volume Off -23%

9:00 PM – Here is our latest chart update for this recent breakout from our Traditional BreakOuts Watch List.

CLICK/TAP CHART TO ZOOM
Chart services courtesy of stockcharts.com. Annotations by James Taulman.

We are currently reporting on this stock as an active holding and continue to monitor the stock closely for any technical SELL SIGNALS.

The focus always remains on price/volume action around key support levels, including the 10 DMA, 50 DMA, and any nearby trendline or ROUND-$ support.

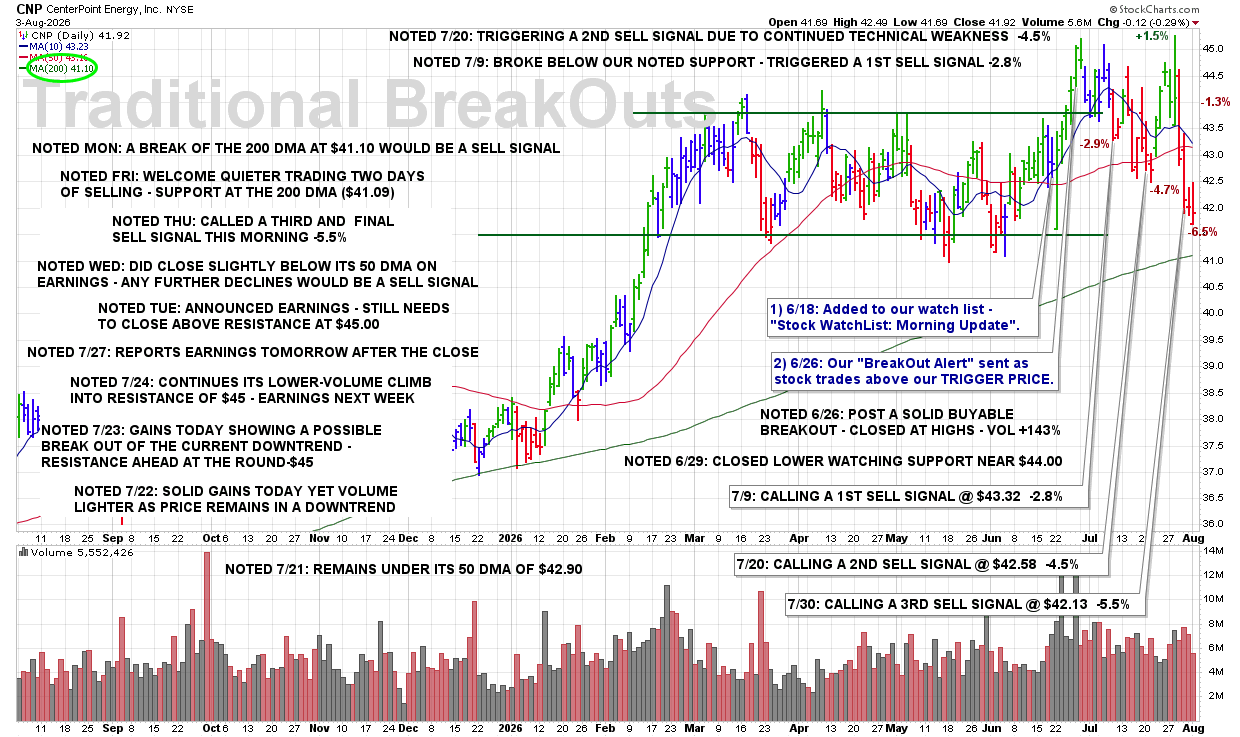
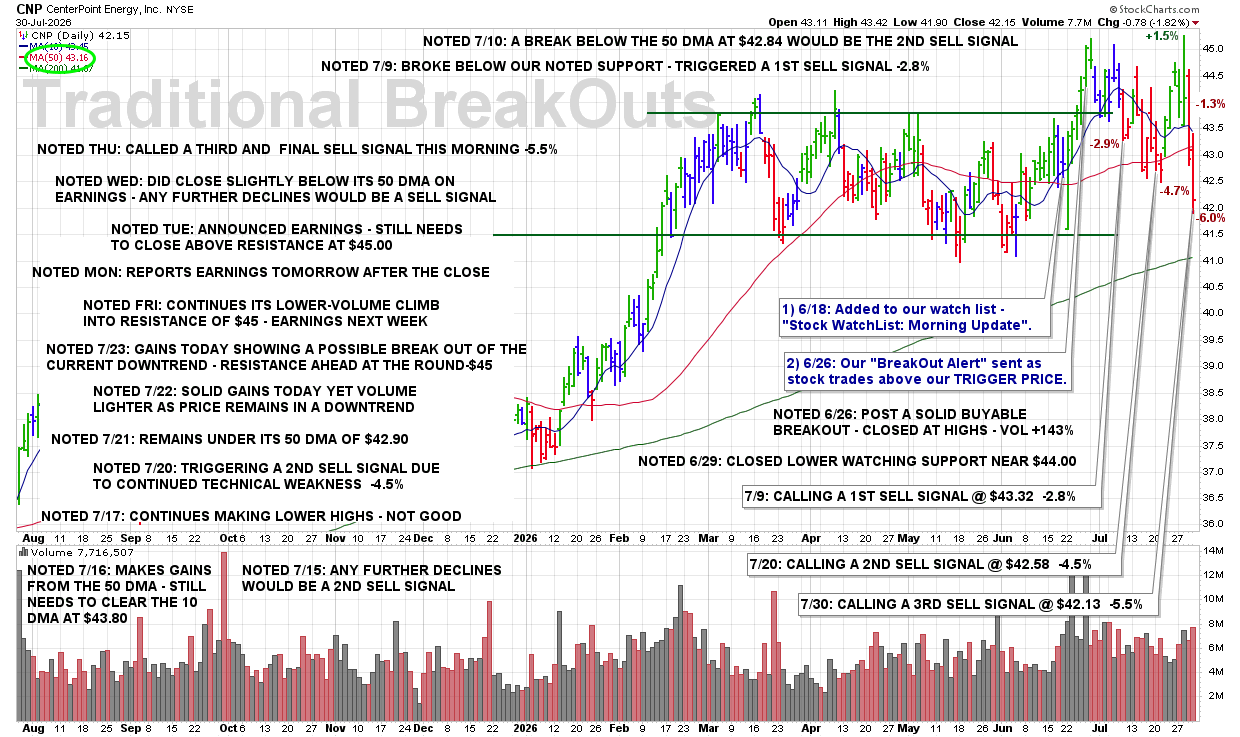
TUE 8/4: CNP – Any Further Declines Would Be Another Sell Signal

8:55 PM – Here is our latest chart update for this recent breakout from our Traditional BreakOuts Watch List.

CLICK/TAP CHART TO ZOOM
Chart services courtesy of stockcharts.com. Annotations by James Taulman.

We are currently reporting on this stock as an active holding and continue to monitor the stock closely for any technical SELL SIGNALS.

The focus always remains on price/volume action around key support levels, including the 10 DMA, 50 DMA, and any nearby trendline or ROUND-$ support.

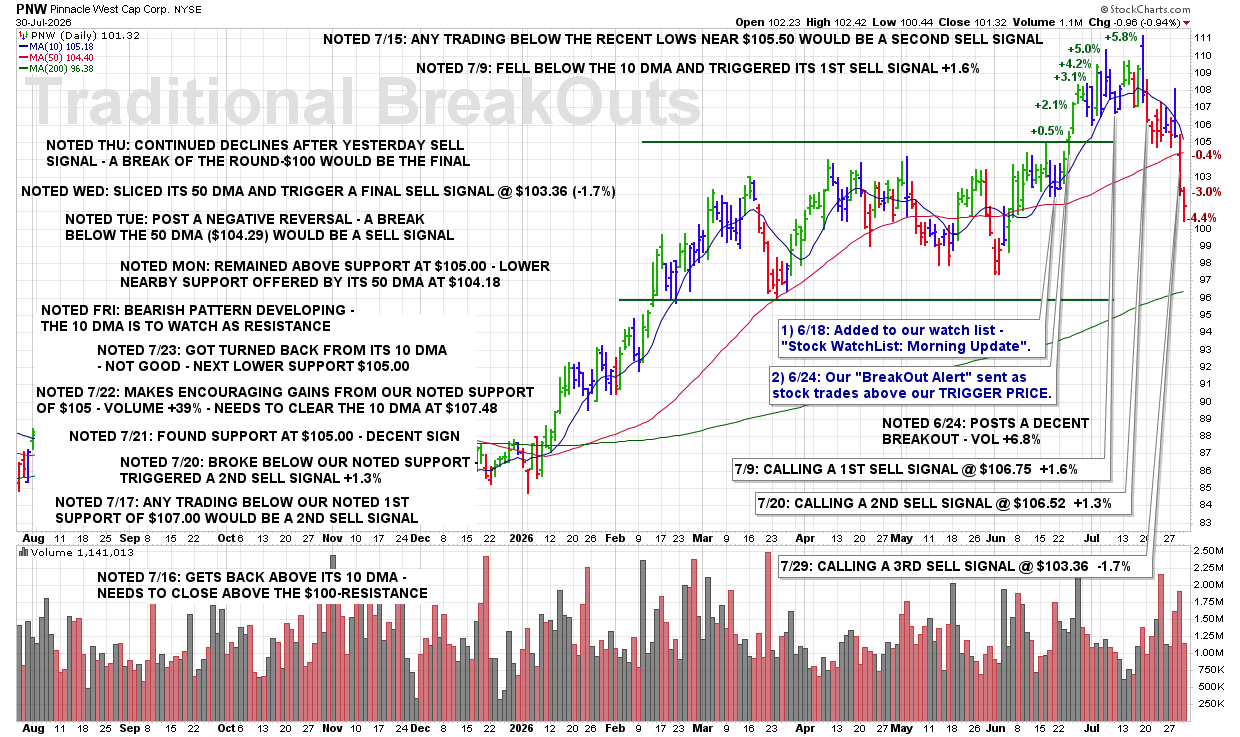
TUE 8/4: PNW – Gets Volatile on Earnings – 10 DMA Resistance Looms Overhead

8:45 PM – Here is our latest chart update for this recent breakout from our Traditional BreakOuts Watch List.

CLICK/TAP CHART TO ZOOM
Chart services courtesy of stockcharts.com. Annotations by James Taulman.

We are currently reporting on this stock as an active holding and continue to monitor the stock closely for any technical SELL SIGNALS.

The focus always remains on price/volume action around key support levels, including the 10 DMA, 50 DMA, and any nearby trendline or ROUND-$ support.

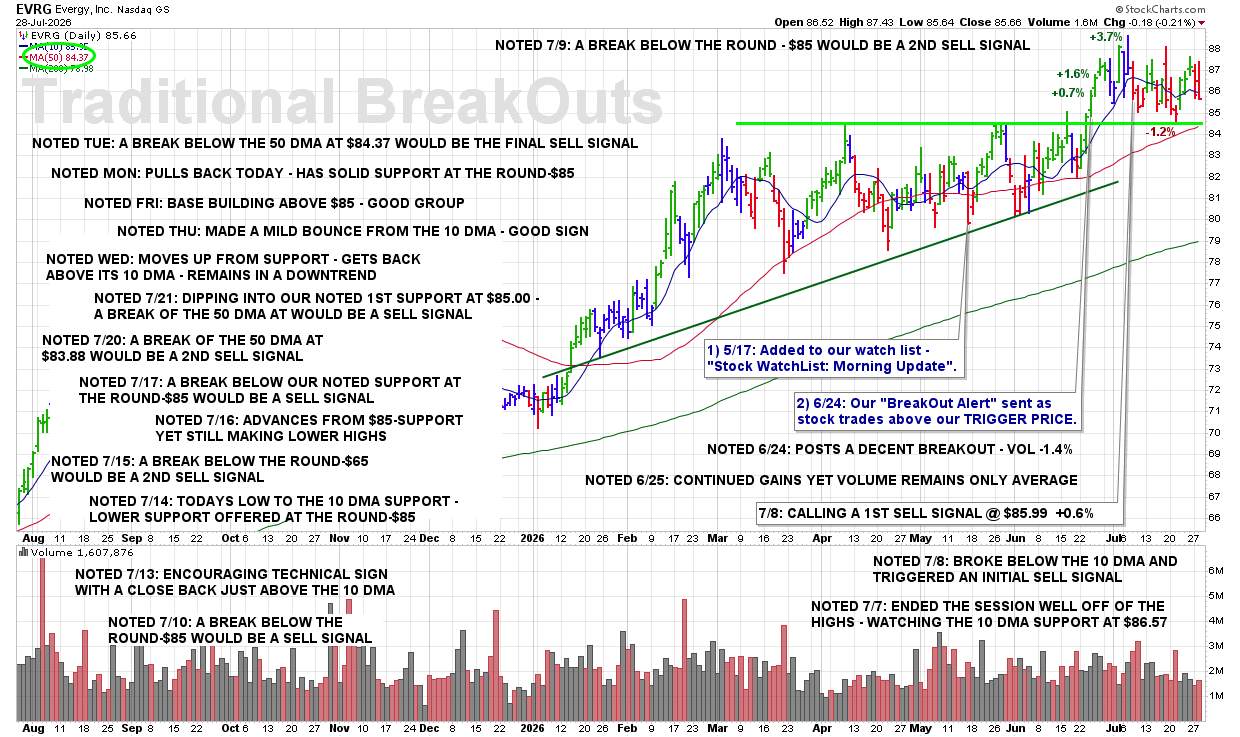
TUE 8/4: EVRG – Needs to Get Back Above the 10 DMA at $84.92

8:40 PM – Here is our latest chart update for this recent breakout from our Traditional BreakOuts Watch List.

CLICK/TAP CHART TO ZOOM
Chart services courtesy of stockcharts.com. Annotations by James Taulman.

We are currently reporting on this stock as an active holding and continue to monitor the stock closely for any technical SELL SIGNALS.

The focus always remains on price/volume action around key support levels, including the 10 DMA, 50 DMA, and any nearby trendline or ROUND-$ support.

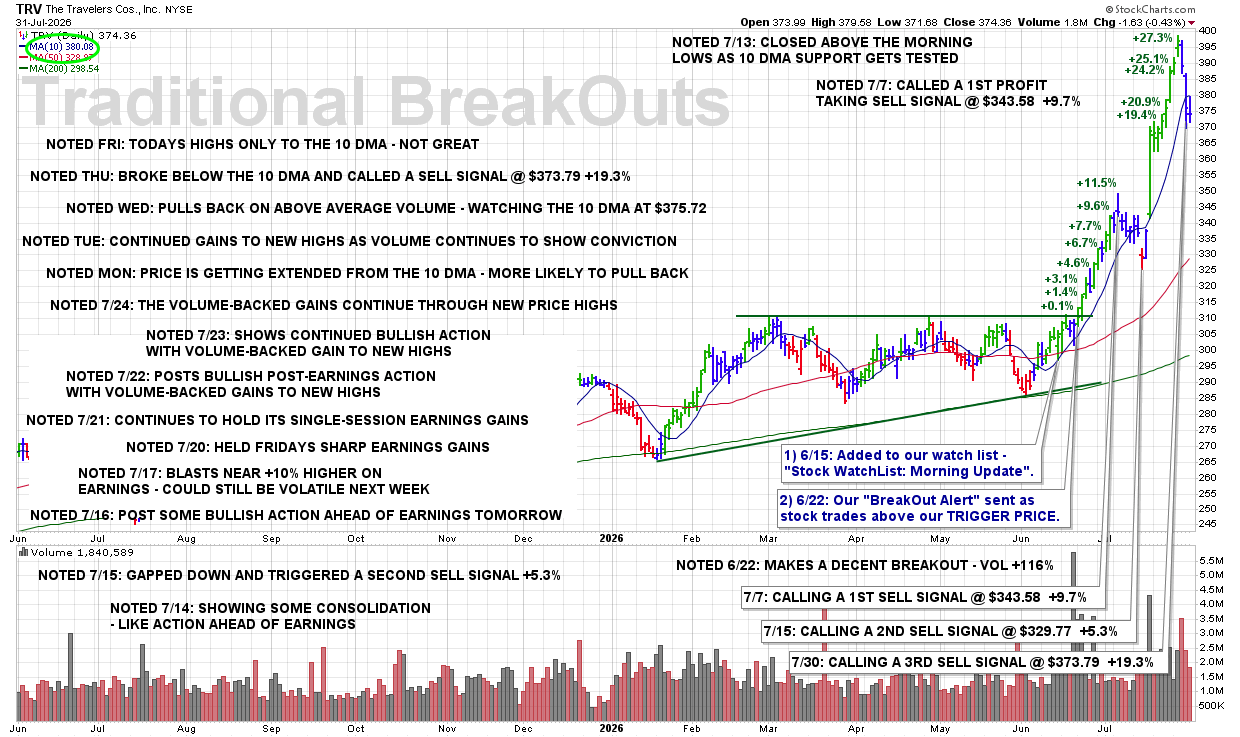
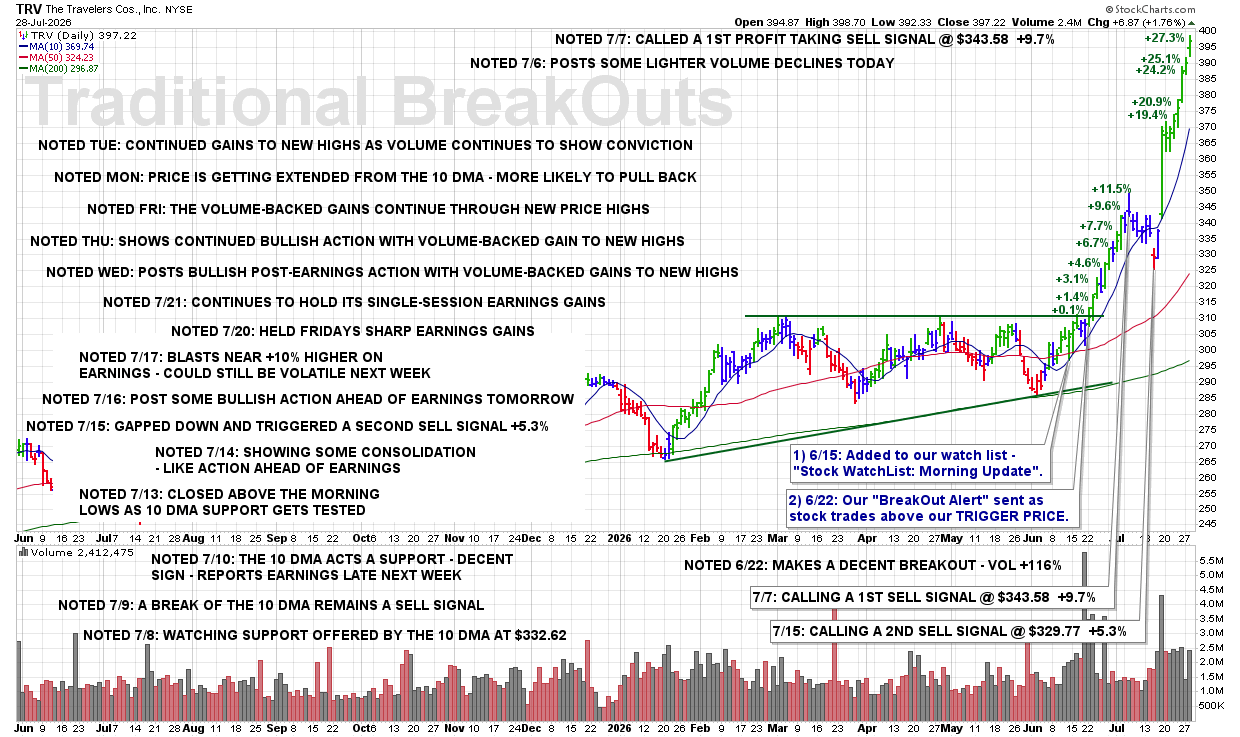
TUE 8/4: TRV – Remains Below the 10 DMA – Not Great

8:35 PM – Here is our latest chart update for this recent breakout from our Traditional BreakOuts Watch List.

CLICK/TAP CHART TO ZOOM
Chart services courtesy of stockcharts.com. Annotations by James Taulman.

We are currently reporting on this stock as an active holding and continue to monitor the stock closely for any technical SELL SIGNALS.

The focus always remains on price/volume action around key support levels, including the 10 DMA, 50 DMA, and any nearby trendline or ROUND-$ support.

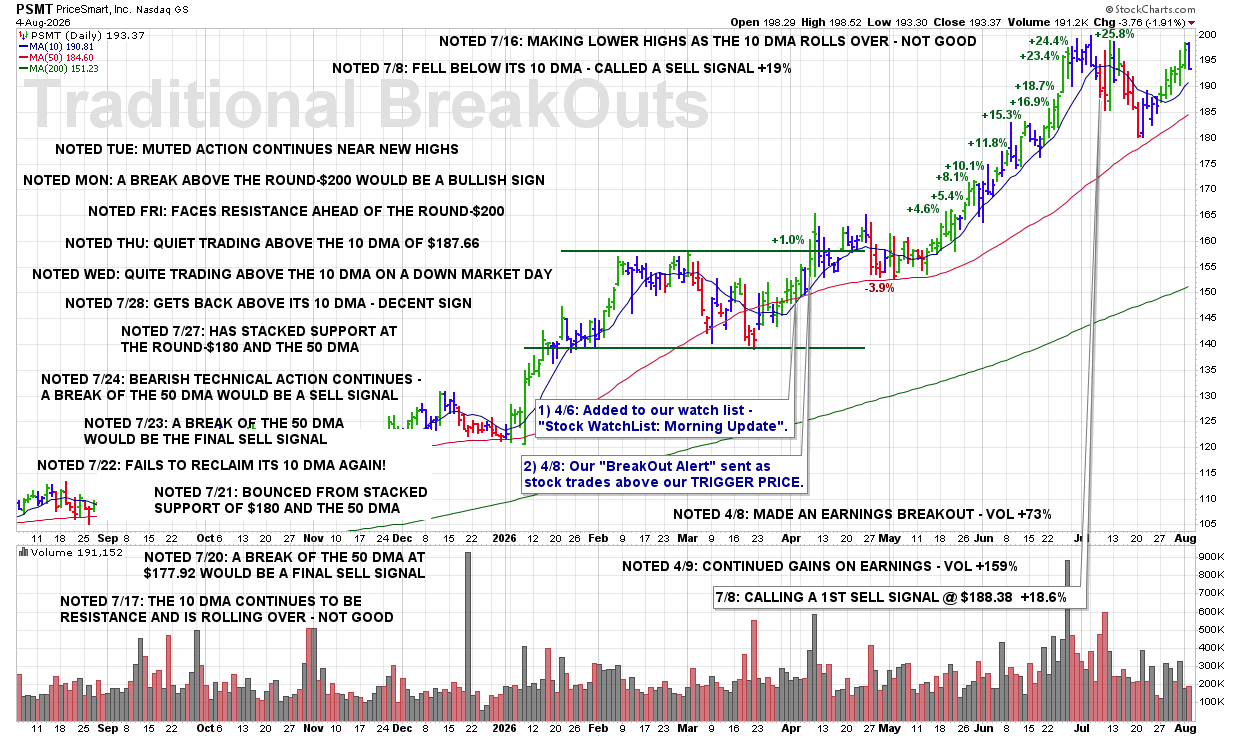
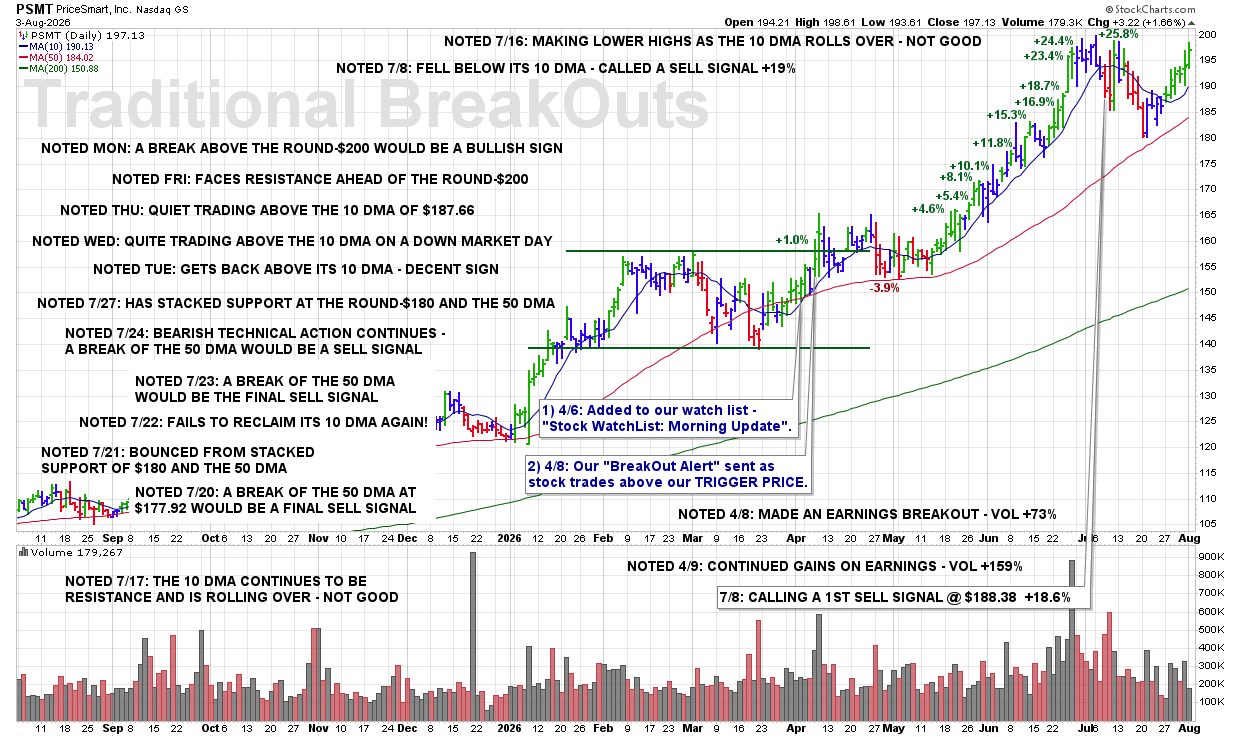
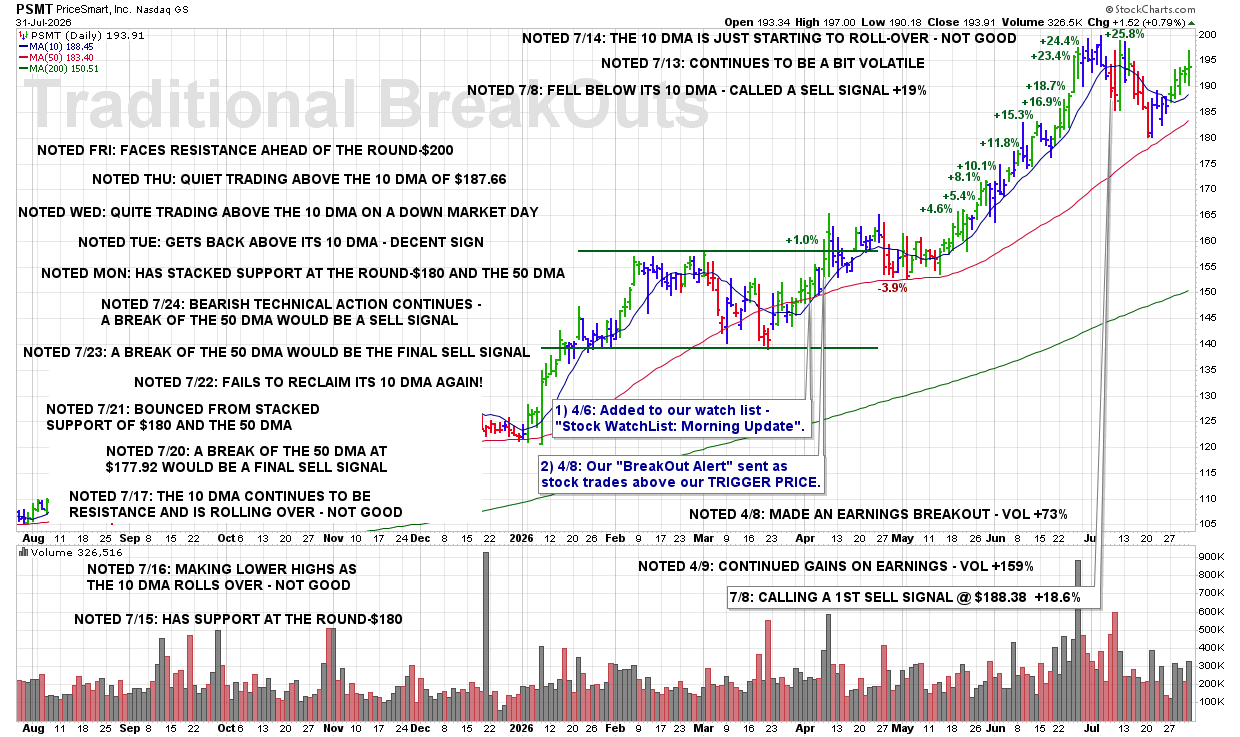
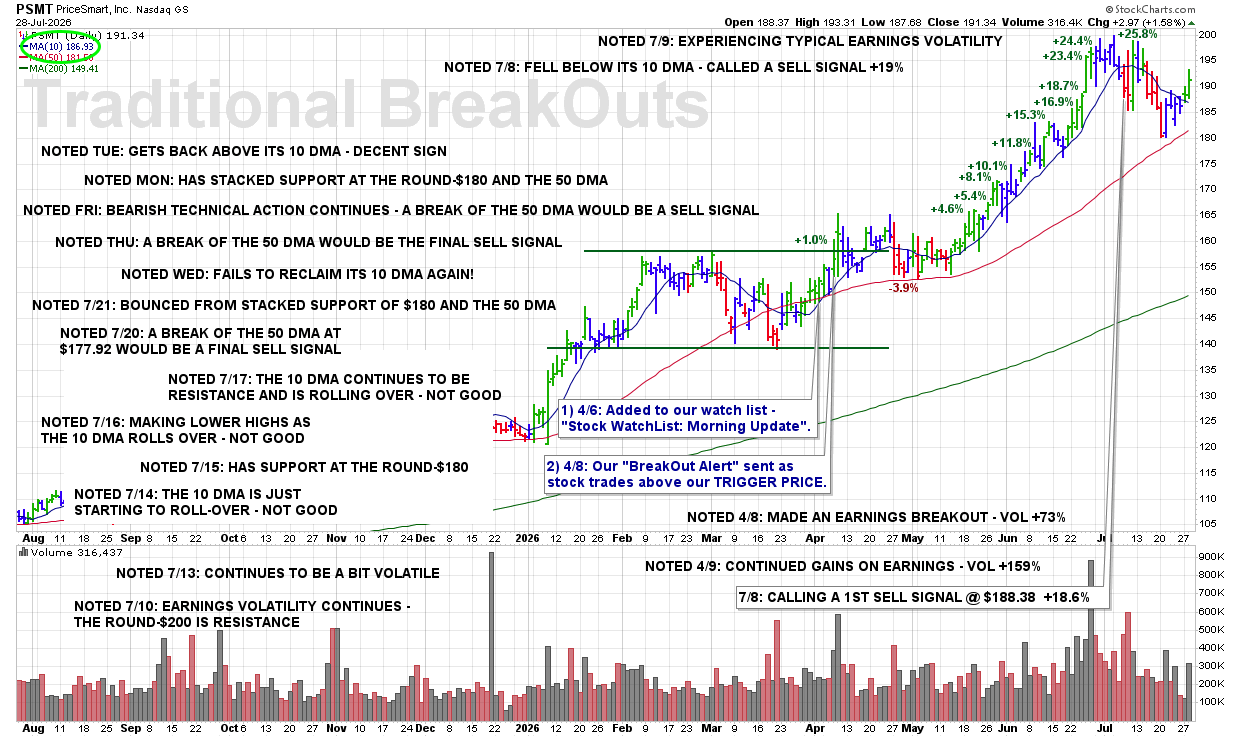
TUE 8/4: PSMT – Muted Action Continues Near New Highs

8:30 PM – Here is our latest chart update for this recent breakout from our Traditional BreakOuts Watch List.

CLICK/TAP CHART TO ZOOM
Chart services courtesy of stockcharts.com. Annotations by James Taulman.

We are currently reporting on this stock as an active holding and continue to monitor the stock closely for any technical SELL SIGNALS.

The focus always remains on price/volume action around key support levels, including the 10 DMA, 50 DMA, and any nearby trendline or ROUND-$ support.

TUE 8/4: ASND – Lackluster Activity Continues as the Market Soars

8:13 PM – Here is our latest chart update for this recent breakout from our Traditional BreakOuts Watch List.

CLICK/TAP CHART TO ZOOM
Chart services courtesy of stockcharts.com. Annotations by James Taulman.

We are currently reporting on this stock as an active holding and continue to monitor the stock closely for any technical SELL SIGNALS.

The focus always remains on price/volume action around key support levels, including the 10 DMA, 50 DMA, and any nearby trendline or ROUND-$ support.

TUE 8/4: ITGR – SELLING (ALL) P/L: +$2,383.43 +23.9%

1:48 PM – Selling all my ITGR shares here after learning the company is being acquired for approximately $127.00 per share. With the stock now trading around the announced buyout value, I’m locking in this strong +23.9% gain and moving on.

James’ Trader’s Tip: Take the Win When the Catalyst Changes

  • A buyout can quickly change the technical setup and limit the stock’s remaining upside.

  • Once the primary move has been captured, there is little reason to keep capital tied up waiting for a small additional gain.

  • Locking in a strong profit and redeploying that capital into a fresh opportunity keeps the portfolio working.

CLICK/TAP CHART TO ZOOM
Chart services courtesy of stockcharts.com. Annotations by James Taulman.

TUE 8/4: CBZ – SELLING (ALL) P/L: +$2,524.08 +24.4%

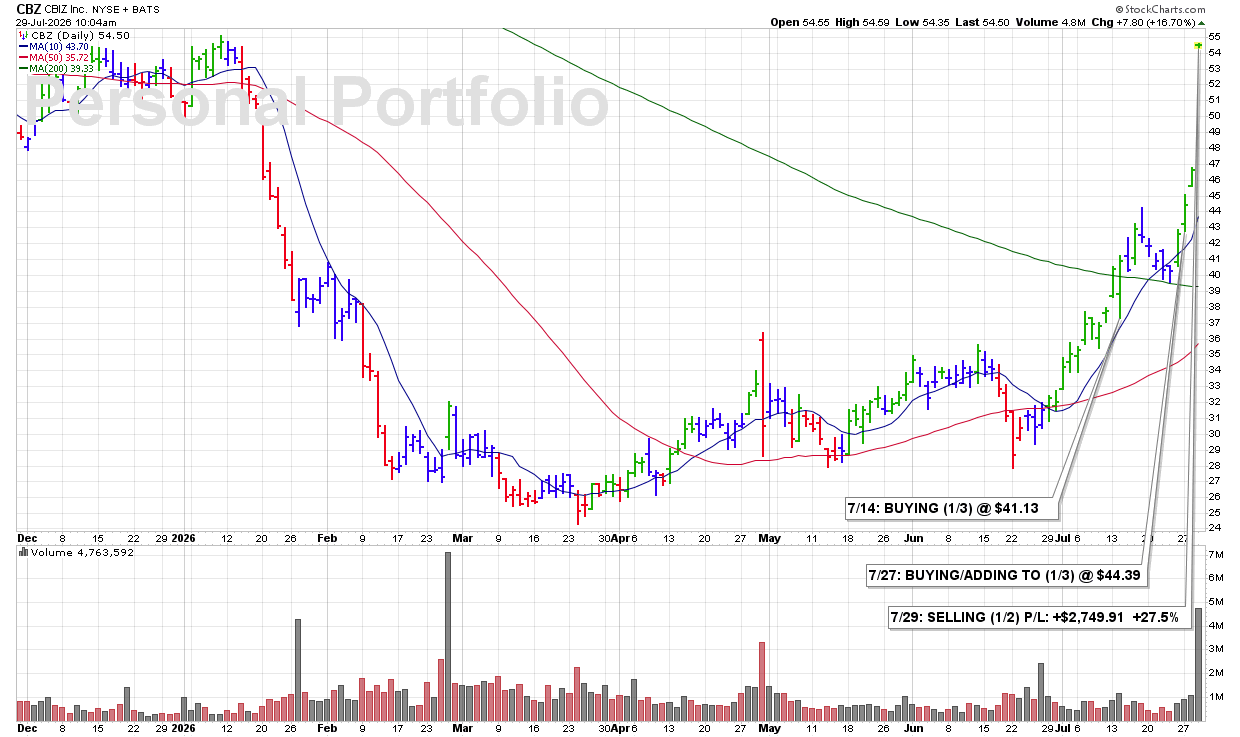
1:48 PM – Selling all my CBZ shares after the stock recently gapped sharply higher on buyout news. I’m taking these windfall profits here, locking in a strong +24% gain, and moving on to the next opportunity.

James’ Trader’s Tip: Take the Windfall and Move On

  • Buyout news can create an immediate jump in price and dramatically change the original technical setup.

  • When a stock delivers a sudden outsized gain, there is nothing wrong with taking the profit rather than waiting for incremental upside.

  • Bank the win, free up the capital, and look for the next strong setup.

CLICK/TAP CHART TO ZOOM
Chart services courtesy of stockcharts.com. Annotations by James Taulman.

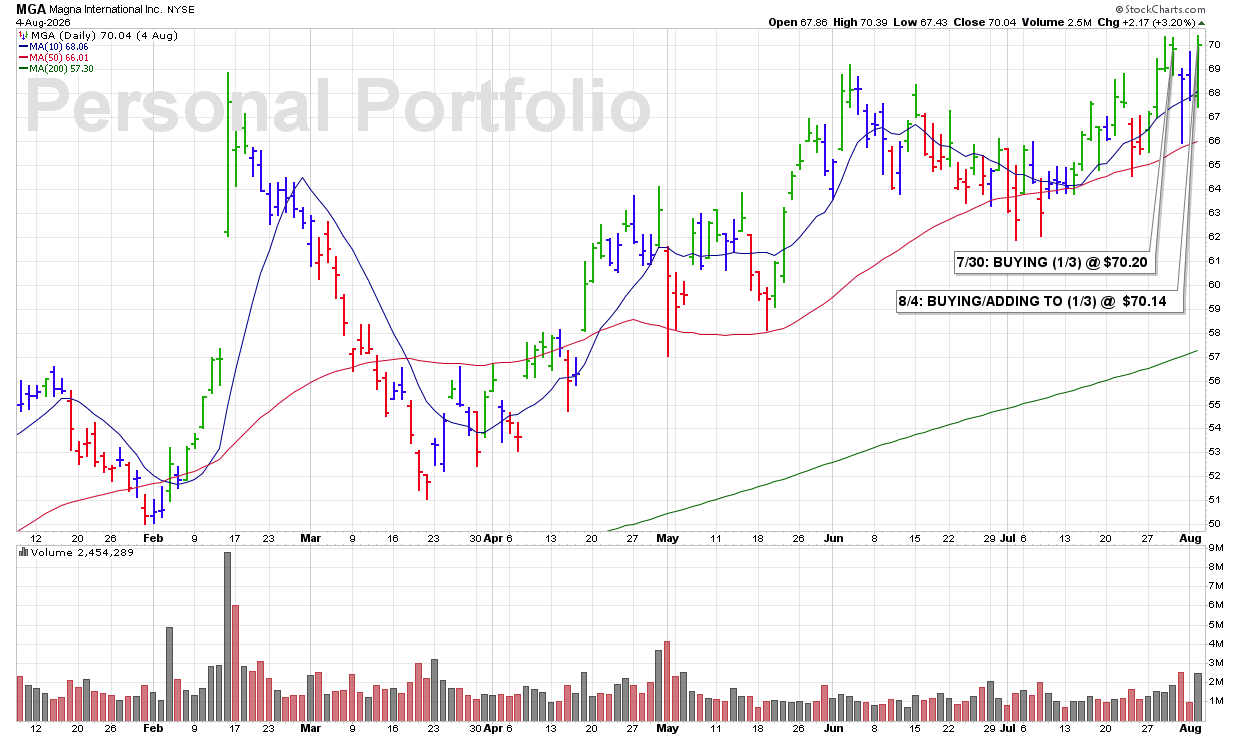
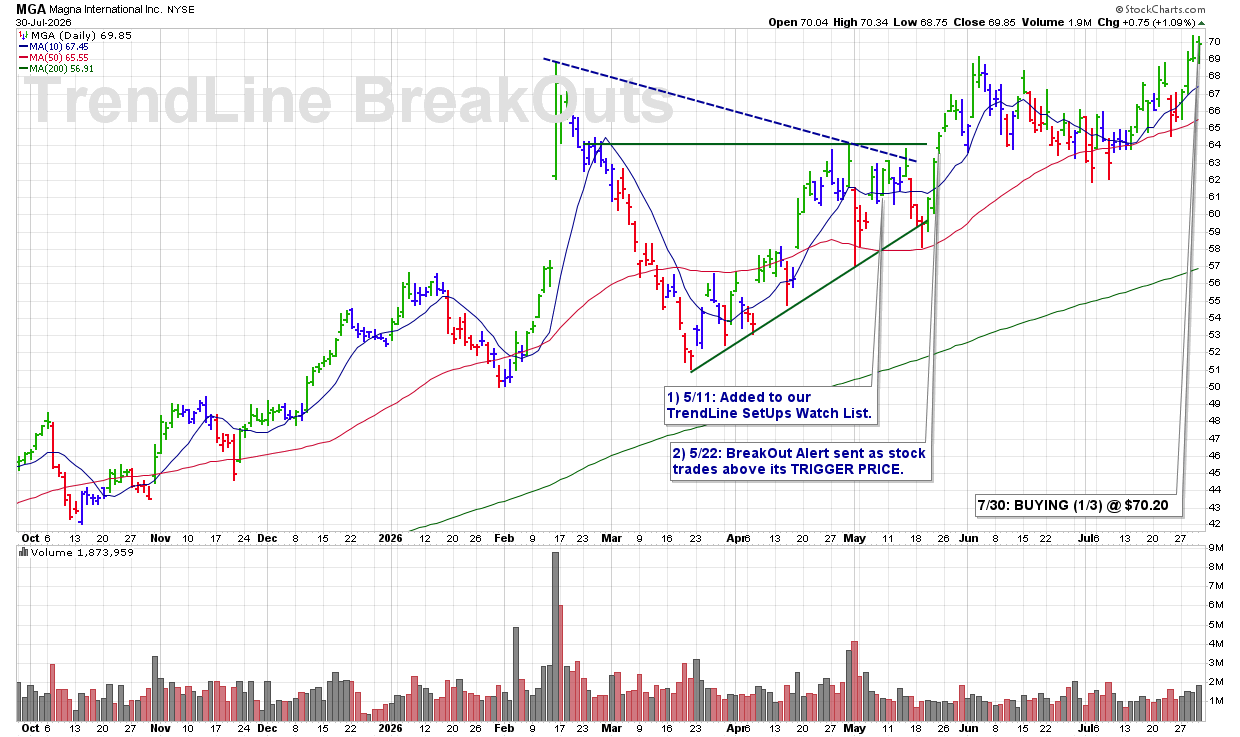
TUE 8/4: MGA – BUYING/ADDING TO (1/3) @ $70.14

1:48 PM – Adding another 1/3 position to MGA this afternoon as shares trade higher from the 10 DMA and begin breaking above the ROUND-$70 level while volume runs well above average. The combination of support at the 10 DMA, a move through round-number resistance, and strong volume gives me enough bullish confirmation to increase the position.

James Trader’s Tip: Add When Strength Confirms the Setup

  • An advance from the 10 DMA shows that technical support is holding.

  • Breaking above a key round-number level adds another layer of bullish confirmation.

  • Above-average volume strengthens the move and helps justify adding to an existing position.

CLICK/TAP CHART TO ZOOM
Chart services courtesy of stockcharts.com. Annotations by James Taulman.

TUE 8/4: NDSN – BUYING (1/3) @ $307.84

12:16 PM – Adding a 1/3 position in this Machinery-General Industrial leader around midday as shares blast to new all-time highs on above-average volume. The combination of a breakout to new highs and expanding volume represents the type of bullish technical action that qualifies as a BUY SIGNAL under the ULTRA Trading System.

James’ Trader’s Tip: Buy the Leaders—Not the Laggards

  • Industry leaders making new highs are often attracting institutional buying.

  • Breakouts accompanied by above-average volume have a greater probability of continuing.

  • Focusing on market leaders with strong price and volume action can significantly improve the quality of your trade selections.

CLICK/TAP CHART TO ZOOM
Chart services courtesy of stockcharts.com. Annotations by James Taulman.

MON 8/3: EMA – Broke Below the 50 DMA and Triggered a 3rd Sell Signal Down -1.1%

9:15 PM – Here is our latest chart update for this recent breakout from our Traditional BreakOuts Watch List

CLICK/TAP CHART TO ZOOM
Chart services courtesy of stockcharts.com. Annotations by James Taulman.

We are currently reporting on this stock as an active holding and continue to monitor the stock closely for any technical SELL SIGNALS.

The focus always remains on price/volume action around key support levels, including the 10 DMA, 50 DMA, and any nearby trendline or ROUND-$ support.

MON 8/3: EIX – Called a 2nd Sell Signal as Shares Fell Below Some Recent Lows While Selling Off on Volume -6.6%

9:10 PM – Here is our latest chart update for this recent breakout from our Traditional BreakOuts Watch List.

CLICK/TAP CHART TO ZOOM
Chart services courtesy of stockcharts.com. Annotations by James Taulman.

We are currently reporting on this stock as an active holding and continue to monitor the stock closely for any technical SELL SIGNALS.

The focus always remains on price/volume action around key support levels, including the 10 DMA, 50 DMA, and any nearby trendline or ROUND-$ support.

MON 8/3: MD – Continues to Find Support at the 10 DMA of $26.28

9:05 PM – Here is our latest chart update for this recent breakout from our Traditional BreakOuts Watch List.

CLICK/TAP CHART TO ZOOM
Chart services courtesy of stockcharts.com. Annotations by James Taulman.

We are currently reporting on this stock as an active holding and continue to monitor the stock closely for any technical SELL SIGNALS.

The focus always remains on price/volume action around key support levels, including the 10 DMA, 50 DMA, and any nearby trendline or ROUND-$ support.

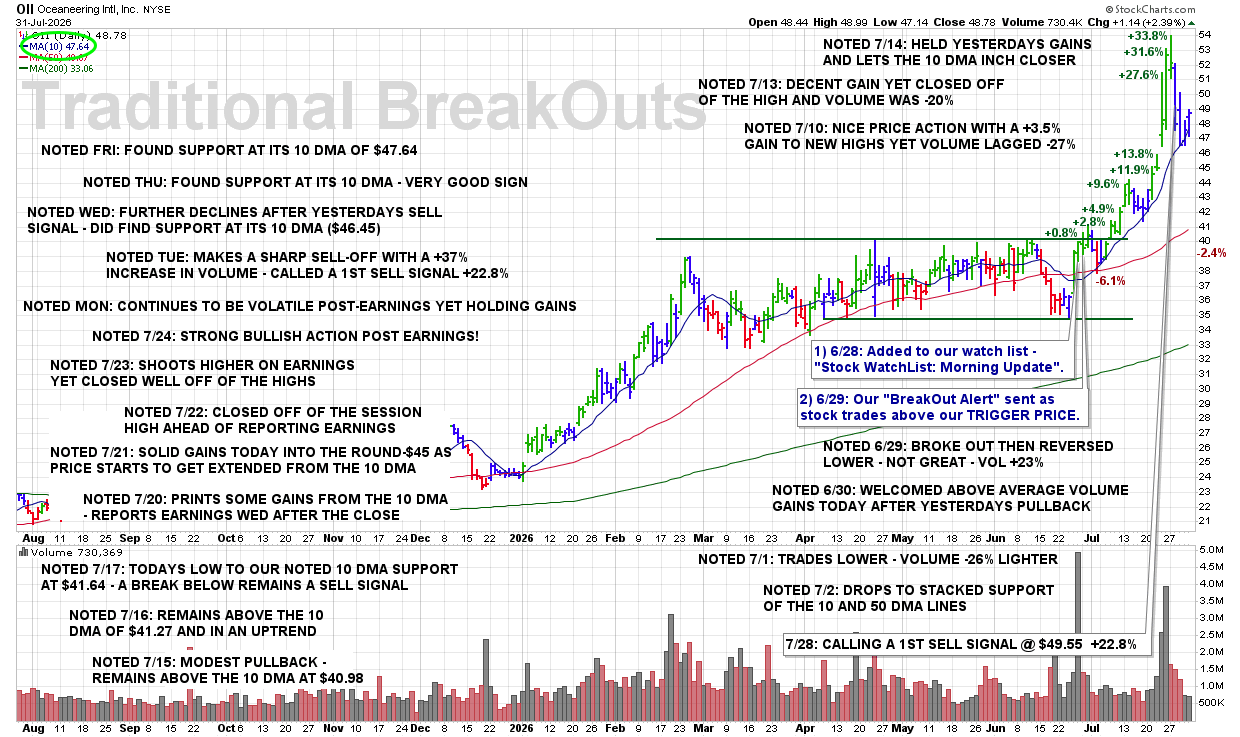
MON 8/3: OII – The 10 DMA at $48.23 Continues to Be Solid Support

9:00 PM – Here is our latest chart update for this recent breakout from our Traditional BreakOuts Watch List.

CLICK/TAP CHART TO ZOOM
Chart services courtesy of stockcharts.com. Annotations by James Taulman.

We are currently reporting on this stock as an active holding and continue to monitor the stock closely for any technical SELL SIGNALS.

The focus always remains on price/volume action around key support levels, including the 10 DMA, 50 DMA, and any nearby trendline or ROUND-$ support.

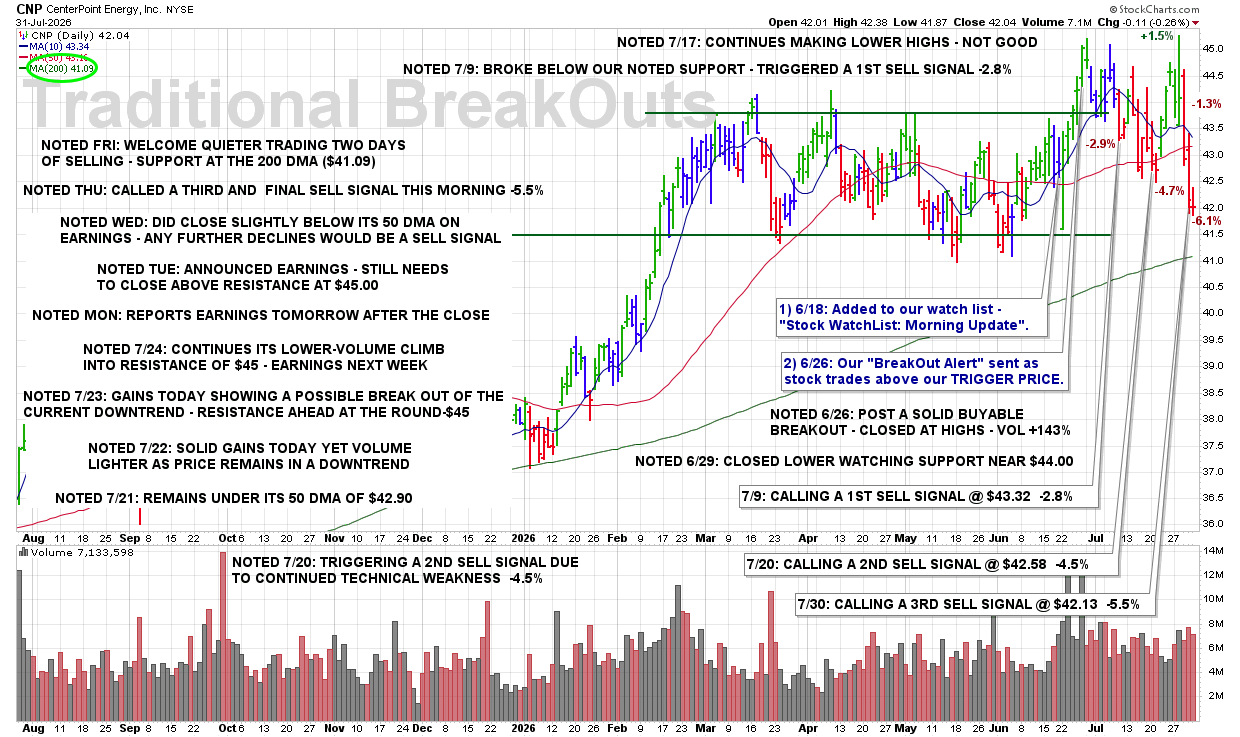
MON 8/3: CNP – A Break of the 200 DMA at $41.10 Would Be a Sell Signal

8:55 PM – Here is our latest chart update for this recent breakout from our Traditional BreakOuts Watch List.

CLICK/TAP CHART TO ZOOM
Chart services courtesy of stockcharts.com. Annotations by James Taulman.

We are currently reporting on this stock as an active holding and continue to monitor the stock closely for any technical SELL SIGNALS.

The focus always remains on price/volume action around key support levels, including the 10 DMA, 50 DMA, and any nearby trendline or ROUND-$ support.

MON 8/3: PNW – A Close Below the Round-$100 Would Be the Final Sell Signal

8:45 PM – Here is our latest chart update for this recent breakout from our Traditional BreakOuts Watch List.

CLICK/TAP CHART TO ZOOM
Chart services courtesy of stockcharts.com. Annotations by James Taulman.

We are currently reporting on this stock as an active holding and continue to monitor the stock closely for any technical SELL SIGNALS.

The focus always remains on price/volume action around key support levels, including the 10 DMA, 50 DMA, and any nearby trendline or ROUND-$ support.

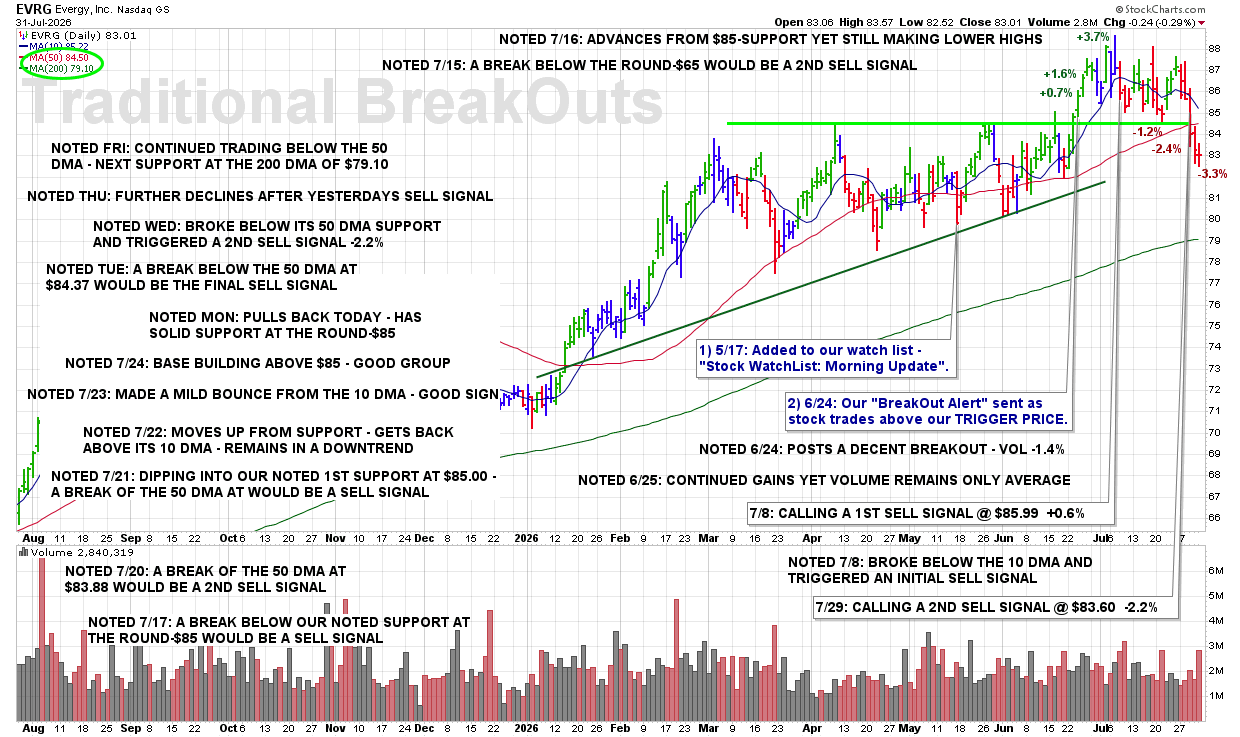
MON 8/3: EVRG – Remains Below the 50 DMA Ahead of Earnings Later This Week

8:40 PM – Here is our latest chart update for this recent breakout from our Traditional BreakOuts Watch List.

CLICK/TAP CHART TO ZOOM
Chart services courtesy of stockcharts.com. Annotations by James Taulman.

We are currently reporting on this stock as an active holding and continue to monitor the stock closely for any technical SELL SIGNALS.

The focus always remains on price/volume action around key support levels, including the 10 DMA, 50 DMA, and any nearby trendline or ROUND-$ support.

MON 8/3: TRV – Needs to Get Back Above the 10 DMA at $380.61

8:35 PM – Here is our latest chart update for this recent breakout from our Traditional BreakOuts Watch List.

CLICK/TAP CHART TO ZOOM
Chart services courtesy of stockcharts.com. Annotations by James Taulman.

We are currently reporting on this stock as an active holding and continue to monitor the stock closely for any technical SELL SIGNALS.

The focus always remains on price/volume action around key support levels, including the 10 DMA, 50 DMA, and any nearby trendline or ROUND-$ support.

MON 8/3: PSMT – A Break Above the Round-$200 Would Be a Bullish Sign

8:30 PM – Here is our latest chart update for this recent breakout from our Traditional BreakOuts Watch List.

CLICK/TAP CHART TO ZOOM
Chart services courtesy of stockcharts.com. Annotations by James Taulman.

We are currently reporting on this stock as an active holding and continue to monitor the stock closely for any technical SELL SIGNALS.

The focus always remains on price/volume action around key support levels, including the 10 DMA, 50 DMA, and any nearby trendline or ROUND-$ support.

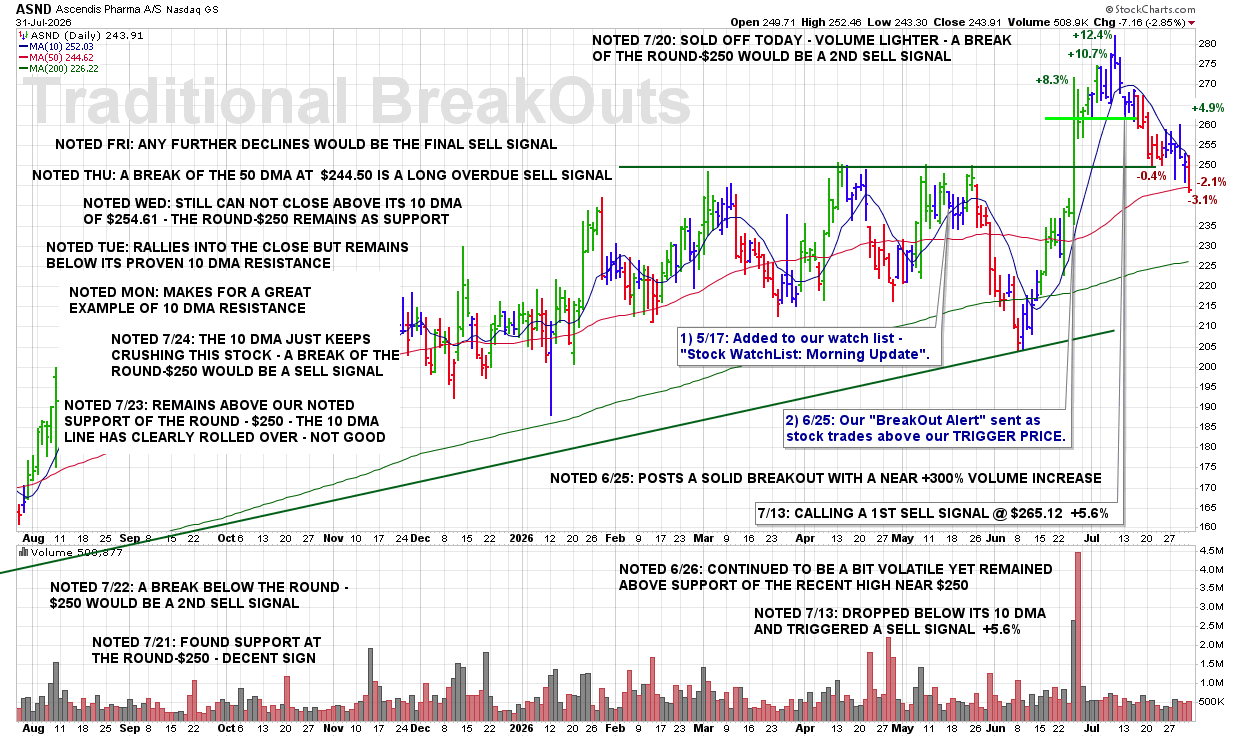
MON 8/3: ASND – Called A Sell Signal As Price Broke Below The 50 DMA -4.0%

8:50 PM – Here is our latest chart update for this recent breakout from our Traditional BreakOuts Watch List.

CLICK/TAP CHART TO ZOOM
Chart services courtesy of stockcharts.com. Annotations by James Taulman.

We are currently reporting on this stock as an active holding and continue to monitor the stock closely for any technical SELL SIGNALS.

The focus always remains on price/volume action around key support levels, including the 10 DMA, 50 DMA, and any nearby trendline or ROUND-$ support.

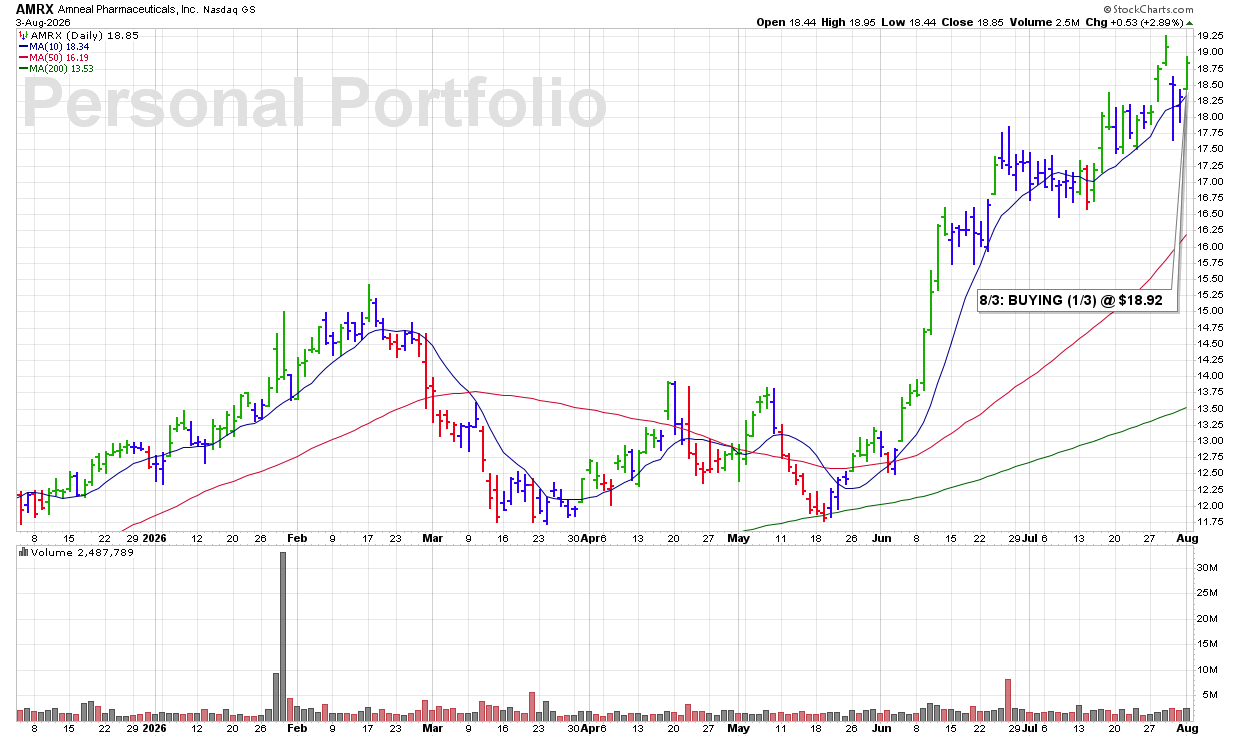
MON 8/3: AMRX – BUYING (1/3) @ $18.92

3:58 PM – Picking up a 1/3 starter position in this Medical-Pharmaceuticals leader as shares find support at the 10 DMA and trade higher into the close. The stock appears set to finish near the session highs while volume is running 22% above average. I consider this combination of price and volume action to be a technical BUY SIGNAL.

James’ Trader’s Tip: Strong Closes Add Conviction

  • Stocks that rebound from the 10 DMA and close near their session highs are often showing renewed buying interest.

  • Above-average volume increases confidence that institutional investors are supporting the move.

  • Starting with a 1/3 position allows you to participate while waiting for additional confirmation before committing more capital.

CLICK/TAP CHART TO ZOOM
Chart services courtesy of stockcharts.com. Annotations by James Taulman.

MON 8/3: AME – BUYING (1/3) @ $244.04

3:58 PM – Starting a 1/3 position in AME ahead of its earnings report. Earnings trades carry significant risk because stocks can gap sharply in either direction after the results are released. However, I have had success with several recent earnings plays, and with my personal trading account at all-time highs—up +42% YTD and 63% YoY—I am willing to assume that calculated risk with a smaller starter position.

James’ Trader’s Tip: Size Positions According to the Risk

  • Earnings announcements can produce sudden and unpredictable price gaps.

  • Beginning with a 1/3 position limits exposure while still providing meaningful upside participation.

  • Higher-risk trades should always be matched with smaller, more controlled position sizes.

CLICK/TAP CHART TO ZOOM
Chart services courtesy of stockcharts.com. Annotations by James Taulman.

MON 8/3: FTS – SELLING (1/2) P/L: -$395.96 -3.7%

3:44 PM – Selling all of my FTS position this afternoon as we head into the close. After recently losing support at the 10 DMA, shares are now clearly breaking below the 50 DMA while the 10 DMA is rolling over. With multiple signs of technical deterioration stacking up, I’m closing out the position and protecting capital.

James’ Trader’s Tip: Technical Weakness Often Builds in Stages

  • Losing the 10 DMA is often the first warning that short-term momentum is weakening.

  • A subsequent break below the 50 DMA confirms more serious technical deterioration.

  • When weakness continues to build and key moving averages begin rolling over, respect the message and reduce exposure.

CLICK/TAP CHART TO ZOOM
Chart services courtesy of stockcharts.com. Annotations by James Taulman.

MON 8/3: ASND – CALLING A 2ND SELL SIGNAL @ $240.85 -4.0%

9:37 AM – Calling a 2ND SELL SIGNAL this morning (correction: the earlier email incorrectly stated a 1st SELL SIGNAL) as shares are clearly breaking below the 50 DMA. This loss of a major support level represents a meaningful technical violation and warrants further reducing the position.

ULTRA Trader’s Tip: Major Support Levels Matter

  • The 50 DMA often serves as an important line of institutional support.

  • When a stock decisively breaks below that level, the probability of continued weakness increases.

  • Respecting major technical violations early helps preserve capital and keeps small losses from becoming much larger ones.

CLICK/TAP CHART TO ZOOM
Chart services courtesy of stockcharts.com. Annotations by James Taulman.

FRI 7/31: EMA – Remains Under Its 10 DMA as the Line Starts to Roll Over – Not Good

8:15 PM – Here is our latest chart update for this recent breakout from our Traditional BreakOuts Watch List

CLICK/TAP CHART TO ZOOM
Chart services courtesy of stockcharts.com. Annotations by James Taulman.

We are currently reporting on this stock as an active holding and continue to monitor the stock closely for any technical SELL SIGNALS.

The focus always remains on price/volume action around key support levels, including the 10 DMA, 50 DMA, and any nearby trendline or ROUND-$ support.

FRI 7/31: EIX – Experiences Expected Earnings Volatility

8:10 PM – Here is our latest chart update for this recent breakout from our Traditional BreakOuts Watch List.

CLICK/TAP CHART TO ZOOM
Chart services courtesy of stockcharts.com. Annotations by James Taulman.

We are currently reporting on this stock as an active holding and continue to monitor the stock closely for any technical SELL SIGNALS.

The focus always remains on price/volume action around key support levels, including the 10 DMA, 50 DMA, and any nearby trendline or ROUND-$ support.

FRI 7/31: MD – Reports Earnings Late Next Week

8:05 PM – Here is our latest chart update for this recent breakout from our Traditional BreakOuts Watch List.

CLICK/TAP CHART TO ZOOM
Chart services courtesy of stockcharts.com. Annotations by James Taulman.

We are currently reporting on this stock as an active holding and continue to monitor the stock closely for any technical SELL SIGNALS.

The focus always remains on price/volume action around key support levels, including the 10 DMA, 50 DMA, and any nearby trendline or ROUND-$ support.

FRI 7/31: OII – Found Support at Its 10 DMA of $47.64

8:00 PM – Here is our latest chart update for this recent breakout from our Traditional BreakOuts Watch List.

CLICK/TAP CHART TO ZOOM
Chart services courtesy of stockcharts.com. Annotations by James Taulman.

We are currently reporting on this stock as an active holding and continue to monitor the stock closely for any technical SELL SIGNALS.

The focus always remains on price/volume action around key support levels, including the 10 DMA, 50 DMA, and any nearby trendline or ROUND-$ support.

FRI 7/31: CNP – Welcome Quieter Trading Two Days of Selling – Support at the 200 DMA ($41.09)

7:55 PM – Here is our latest chart update for this recent breakout from our Traditional BreakOuts Watch List.

CLICK/TAP CHART TO ZOOM
Chart services courtesy of stockcharts.com. Annotations by James Taulman.

We are currently reporting on this stock as an active holding and continue to monitor the stock closely for any technical SELL SIGNALS.

The focus always remains on price/volume action around key support levels, including the 10 DMA, 50 DMA, and any nearby trendline or ROUND-$ support.

FRI 7/31: ASND – Any Further Declines Would Be the Final Sell Signal

7:50 PM – Here is our latest chart update for this recent breakout from our Traditional BreakOuts Watch List.

CLICK/TAP CHART TO ZOOM
Chart services courtesy of stockcharts.com. Annotations by James Taulman.

We are currently reporting on this stock as an active holding and continue to monitor the stock closely for any technical SELL SIGNALS.

The focus always remains on price/volume action around key support levels, including the 10 DMA, 50 DMA, and any nearby trendline or ROUND-$ support.

FRI 7/31: PNW – A Break Below the Round-$100 Would Be the Next Sell Signal

7:45 PM – Here is our latest chart update for this recent breakout from our Traditional BreakOuts Watch List.

CLICK/TAP CHART TO ZOOM
Chart services courtesy of stockcharts.com. Annotations by James Taulman.

We are currently reporting on this stock as an active holding and continue to monitor the stock closely for any technical SELL SIGNALS.

The focus always remains on price/volume action around key support levels, including the 10 DMA, 50 DMA, and any nearby trendline or ROUND-$ support.

FRI 7/31: EVRG – Continued Trading Below the 50 DMA – Next Support at the 200 DMA of $79.10

7:40 PM – Here is our latest chart update for this recent breakout from our Traditional BreakOuts Watch List.

CLICK/TAP CHART TO ZOOM
Chart services courtesy of stockcharts.com. Annotations by James Taulman.

We are currently reporting on this stock as an active holding and continue to monitor the stock closely for any technical SELL SIGNALS.

The focus always remains on price/volume action around key support levels, including the 10 DMA, 50 DMA, and any nearby trendline or ROUND-$ support.

FRI 7/31: TRV – Todays Highs Only to the 10 DMA – Not Great

7:35 PM – Here is our latest chart update for this recent breakout from our Traditional BreakOuts Watch List.

CLICK/TAP CHART TO ZOOM
Chart services courtesy of stockcharts.com. Annotations by James Taulman.

We are currently reporting on this stock as an active holding and continue to monitor the stock closely for any technical SELL SIGNALS.

The focus always remains on price/volume action around key support levels, including the 10 DMA, 50 DMA, and any nearby trendline or ROUND-$ support.

FRI 7/31: PSMT – Faces Resistance Ahead of the Round-$200

7:30 PM – Here is our latest chart update for this recent breakout from our Traditional BreakOuts Watch List.

CLICK/TAP CHART TO ZOOM
Chart services courtesy of stockcharts.com. Annotations by James Taulman.

We are currently reporting on this stock as an active holding and continue to monitor the stock closely for any technical SELL SIGNALS.

The focus always remains on price/volume action around key support levels, including the 10 DMA, 50 DMA, and any nearby trendline or ROUND-$ support.

FRI 7/31: BBSI – SELLING (1/2) P/L: -$637.20 -6.4%

3:43 PM – Selling half of my BBSI position this afternoon. After yesterday’s close just below the 10 DMA, shares are continuing to exhibit bearish technical action today, breaking below the recent lows near $39.00 on well above-average volume. Although I previously sold this stock for a solid profit and then bought it back on July 29th after a fresh BUY SIGNAL, I can no longer ignore the current technical deterioration. Stocks will tell you what to do—you simply have to listen.

James’ Trader’s Tip: Listen to What the Stock Is Saying

  • Every trade is based on the stock’s current technical behavior—not your previous opinion of it.

  • A stock can issue a valid BUY SIGNAL one day and a valid SELL SIGNAL soon after.

  • Successful traders stay flexible and respond to the evidence, allowing the stock’s price and volume action—not emotion—to dictate their decisions.

CLICK/TAP CHART TO ZOOM
Chart services courtesy of stockcharts.com. Annotations by James Taulman.

THU 7/30: EMA – Remained Under the 10 DMA of $54.40 – Not Good

7:45 PM – Here is our latest chart update for this recent breakout from our Traditional BreakOuts Watch List

CLICK/TAP CHART TO ZOOM
Chart services courtesy of stockcharts.com. Annotations by James Taulman.

We are currently reporting on this stock as an active holding and continue to monitor the stock closely for any technical SELL SIGNALS.

The focus always remains on price/volume action around key support levels, including the 10 DMA, 50 DMA, and any nearby trendline or ROUND-$ support.

THU 7/30: EIX- Triggered a Note Sell Signal Price Broke Below the 50 DMA +2.0%

7:40 PM – Here is our latest chart update for this recent breakout from our Traditional BreakOuts Watch List.

CLICK/TAP CHART TO ZOOM
Chart services courtesy of stockcharts.com. Annotations by James Taulman.

We are currently reporting on this stock as an active holding and continue to monitor the stock closely for any technical SELL SIGNALS.

The focus always remains on price/volume action around key support levels, including the 10 DMA, 50 DMA, and any nearby trendline or ROUND-$ support.

THU 7/30: MD – Continued Trading Above the 10 DMA – Decent Sign

7:35 PM – Here is our latest chart update for this recent breakout from our Traditional BreakOuts Watch List.

CLICK/TAP CHART TO ZOOM
Chart services courtesy of stockcharts.com. Annotations by James Taulman.

We are currently reporting on this stock as an active holding and continue to monitor the stock closely for any technical SELL SIGNALS.

The focus always remains on price/volume action around key support levels, including the 10 DMA, 50 DMA, and any nearby trendline or ROUND-$ support.

THU 7/30: OII – Found Support At Its 10 DMA – Very Good Sign

7:30 PM – Here is our latest chart update for this recent breakout from our Traditional BreakOuts Watch List.

CLICK/TAP CHART TO ZOOM
Chart services courtesy of stockcharts.com. Annotations by James Taulman.

We are currently reporting on this stock as an active holding and continue to monitor the stock closely for any technical SELL SIGNALS.

The focus always remains on price/volume action around key support levels, including the 10 DMA, 50 DMA, and any nearby trendline or ROUND-$ support.

THU 7/30: CNP – Called a Third and Final Sell Signal This Morning -5.5%

7:25 PM – Here is our latest chart update for this recent breakout from our Traditional BreakOuts Watch List.

CLICK/TAP CHART TO ZOOM
Chart services courtesy of stockcharts.com. Annotations by James Taulman.

We are currently reporting on this stock as an active holding and continue to monitor the stock closely for any technical SELL SIGNALS.

The focus always remains on price/volume action around key support levels, including the 10 DMA, 50 DMA, and any nearby trendline or ROUND-$ support.

THU 7/30: ASND – A Break of the 50 DMA at $244.50 is a Long Overdue Sell Signal

7:20 PM – Here is our latest chart update for this recent breakout from our Traditional BreakOuts Watch List.

CLICK/TAP CHART TO ZOOM
Chart services courtesy of stockcharts.com. Annotations by James Taulman.

We are currently reporting on this stock as an active holding and continue to monitor the stock closely for any technical SELL SIGNALS.

The focus always remains on price/volume action around key support levels, including the 10 DMA, 50 DMA, and any nearby trendline or ROUND-$ support.

THU 7/30: PNW – Continued Declines After Yesterday Sell Signal – a Break of the Round-$100 Would Be the Final

7:15 PM – Here is our latest chart update for this recent breakout from our Traditional BreakOuts Watch List.

CLICK/TAP CHART TO ZOOM
Chart services courtesy of stockcharts.com. Annotations by James Taulman.

We are currently reporting on this stock as an active holding and continue to monitor the stock closely for any technical SELL SIGNALS.

The focus always remains on price/volume action around key support levels, including the 10 DMA, 50 DMA, and any nearby trendline or ROUND-$ support.

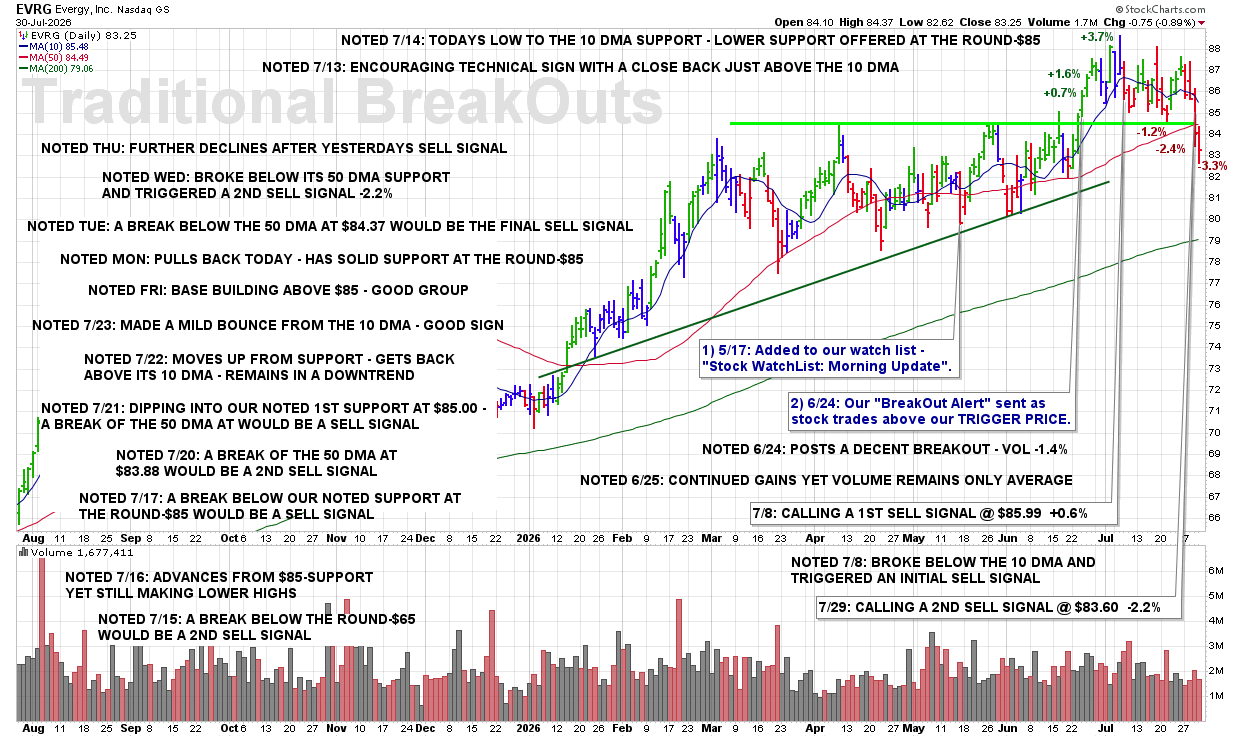
THU 7/30: EVRG – Further Declines After Yesterdays Sell Signal

7:10 PM – Here is our latest chart update for this recent breakout from our Traditional BreakOuts Watch List.

CLICK/TAP CHART TO ZOOM
Chart services courtesy of stockcharts.com. Annotations by James Taulman.

We are currently reporting on this stock as an active holding and continue to monitor the stock closely for any technical SELL SIGNALS.

The focus always remains on price/volume action around key support levels, including the 10 DMA, 50 DMA, and any nearby trendline or ROUND-$ support.

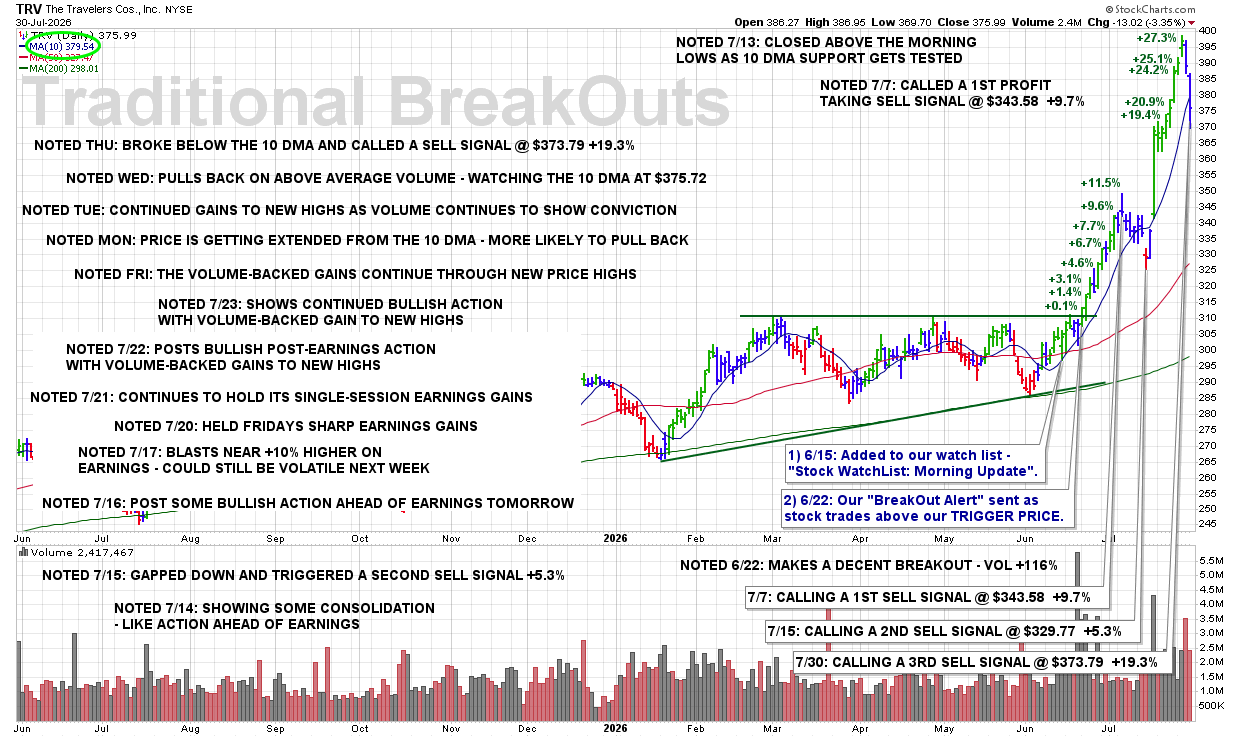
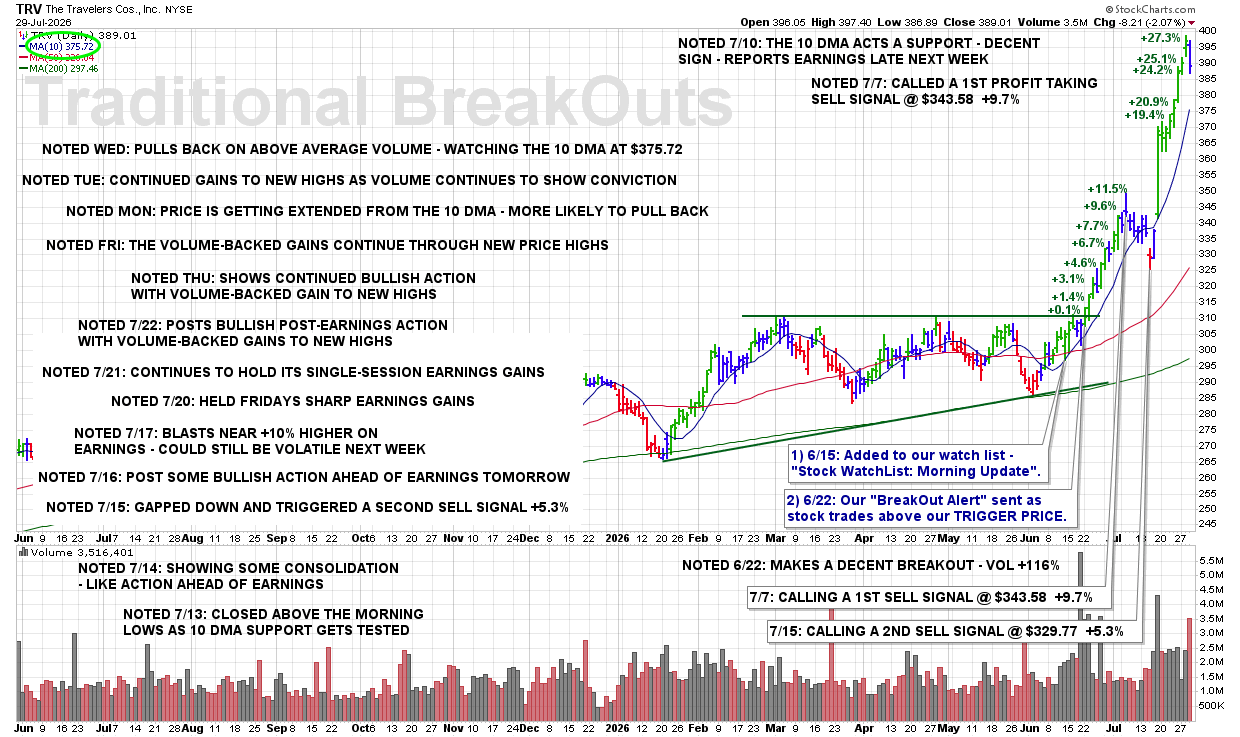
THU 7/30: TRV – Broke Below the 10 DMA and Called a Sell Signal @ $373.79 +19.3%

7:05 PM – Here is our latest chart update for this recent breakout from our Traditional BreakOuts Watch List.

CLICK/TAP CHART TO ZOOM
Chart services courtesy of stockcharts.com. Annotations by James Taulman.

We are currently reporting on this stock as an active holding and continue to monitor the stock closely for any technical SELL SIGNALS.

The focus always remains on price/volume action around key support levels, including the 10 DMA, 50 DMA, and any nearby trendline or ROUND-$ support.

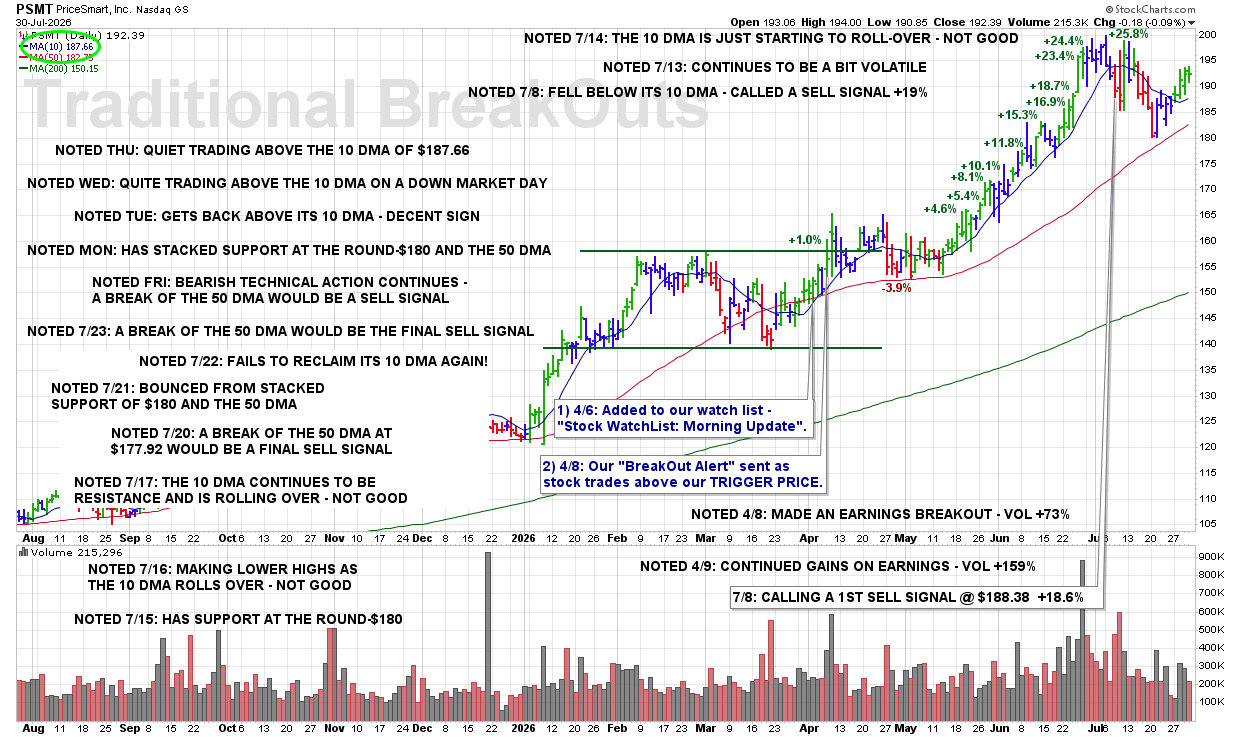
THU 7/30: PSMT – Quiet Trading Above the 10 DMA of $187.66

7:00 PM – Here is our latest chart update for this recent breakout from our Traditional BreakOuts Watch List.

CLICK/TAP CHART TO ZOOM
Chart services courtesy of stockcharts.com. Annotations by James Taulman.

We are currently reporting on this stock as an active holding and continue to monitor the stock closely for any technical SELL SIGNALS.

The focus always remains on price/volume action around key support levels, including the 10 DMA, 50 DMA, and any nearby trendline or ROUND-$ support.

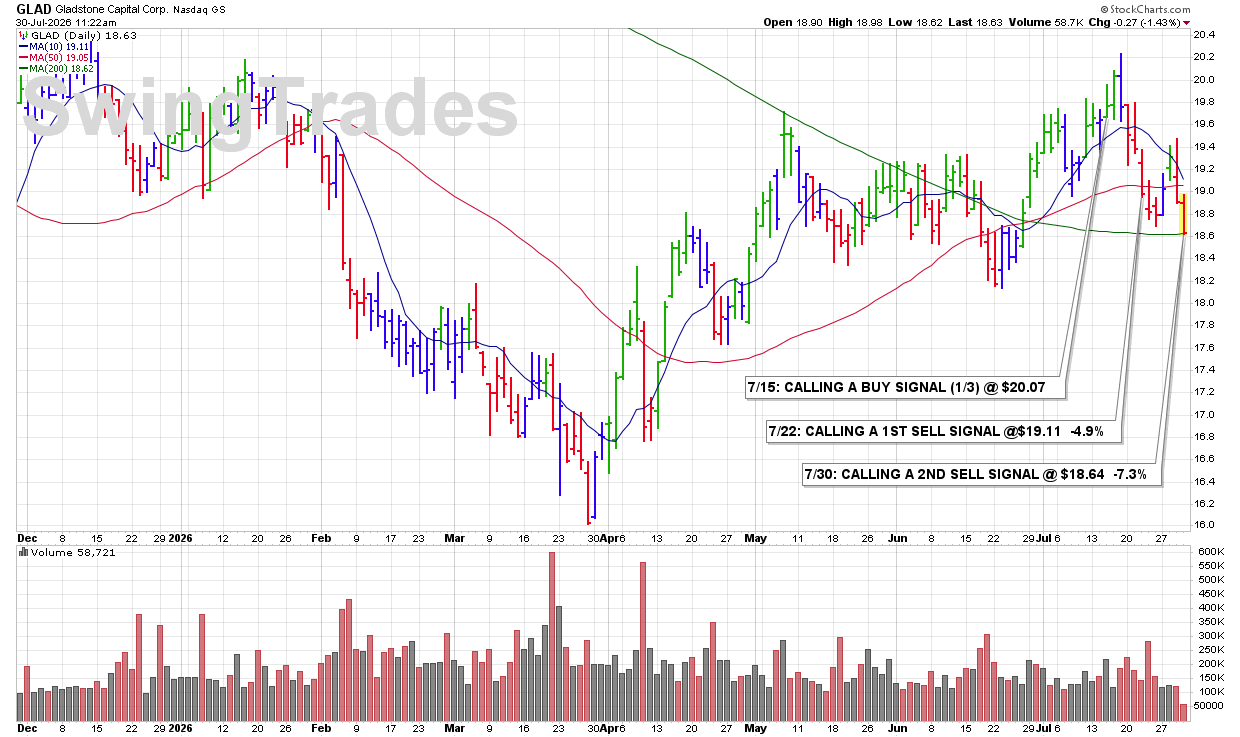
THU 7/30: GLAD – CALLING A 2ND SELL SIGNAL @ $18.64 -7.3%

7/30 THU: GLAD – CALLING A 2ND SELL SIGNAL @ $18.64 -7.3%

11:14 AM – Calling a 2ND SELL SIGNAL as shares continue to trade lower on above-average volume and exhibit persistent technical weakness. The continued decline, combined with elevated selling volume, indicates that downside pressure remains in control and warrants further reducing the position.

ULTRA Trader’s Tip: Respect Weakness When Selling Persists

• Continued price deterioration after an initial sell signal confirms that the stock has not stabilized.

• Above-average volume during a decline can indicate sustained institutional distribution.

• Reducing exposure as weakness progresses helps contain losses and preserve capital for stronger opportunities.

CLICK/TAP CHART TO ZOOM
Chart services courtesy of stockcharts.com. Annotations by James Taulman.

THU 7/30: CNP – CALLING A 3RD SELL SIGNAL @ $42.13 -5.5%

11:06 AM – Calling a 3RD and FINAL SELL SIGNAL this morning after shares briefly reclaimed the 50 DMA yesterday but have now clearly lost that support. As noted yesterday, any further decline below this key level would represent an additional technical violation and trigger the final exit.

ULTRA Trader’s Tip: Failed Recoveries Often Confirm Weakness

• Reclaiming the 50 DMA is only constructive if the stock can hold above it.

• A quick reversal back below major support signals that the recovery attempt has failed.

• Completing the exit after a failed recovery helps prevent a manageable loss from becoming more damaging.

CLICK/TAP CHART TO ZOOM
Chart services courtesy of stockcharts.com. Annotations by James Taulman.

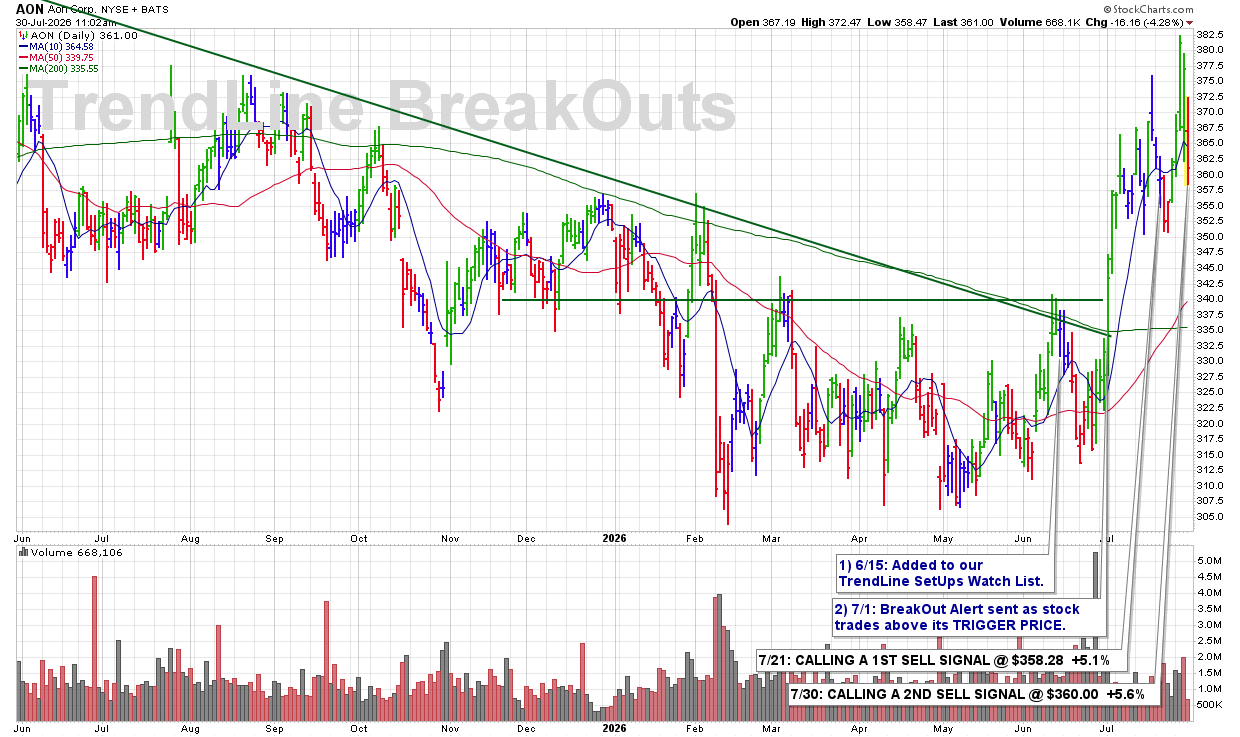
THU 7/30: AON – CALLING A 2ND SELL SIGNAL @ $360.00 +5.6%

10:55 AM – Calling a 2ND SELL SIGNAL this morning as shares break below the 10 DMA on a sharp increase in trading volume. The combination of a key technical violation and expanding volume suggests institutional selling pressure is increasing and supports further reducing the position.

ULTRA Trader’s Tip: Volume Confirms the Technical Breakdown

• A break below the 10 DMA becomes more meaningful when accompanied by above-average volume.

• Increasing volume often reflects institutional distribution rather than routine profit-taking.

• Scaling out as technical weakness develops helps preserve gains while reducing portfolio risk.

CLICK/TAP CHART TO ZOOM
Chart services courtesy of stockcharts.com. Annotations by James Taulman.

THU 7/30: EIX – CALLING A 1ST SELL SIGNAL @ $77.84 +2.0%

10:44 AM – Calling a 1ST SELL SIGNAL this morning as shares break below the 10 DMA on increased trading volume. While this represents the first technical violation, the stock does remain in an overall uptrend with today’s intraday lows currently defining trend support. Any additional weakness from here would likely break that uptrend and trigger further defensive action.

ULTRA Trader’s Tip: Respect the First Signs of Weakness

• An initial break below the 10 DMA serves as an early warning that momentum may be changing.

• Increased volume on the decline suggests institutional selling should be monitored closely.

• Preserving flexibility with an initial sell allows you to reduce exposure while giving the stock an opportunity to recover its uptrend.

CLICK/TAP CHART TO ZOOM
Chart services courtesy of stockcharts.com. Annotations by James Taulman.

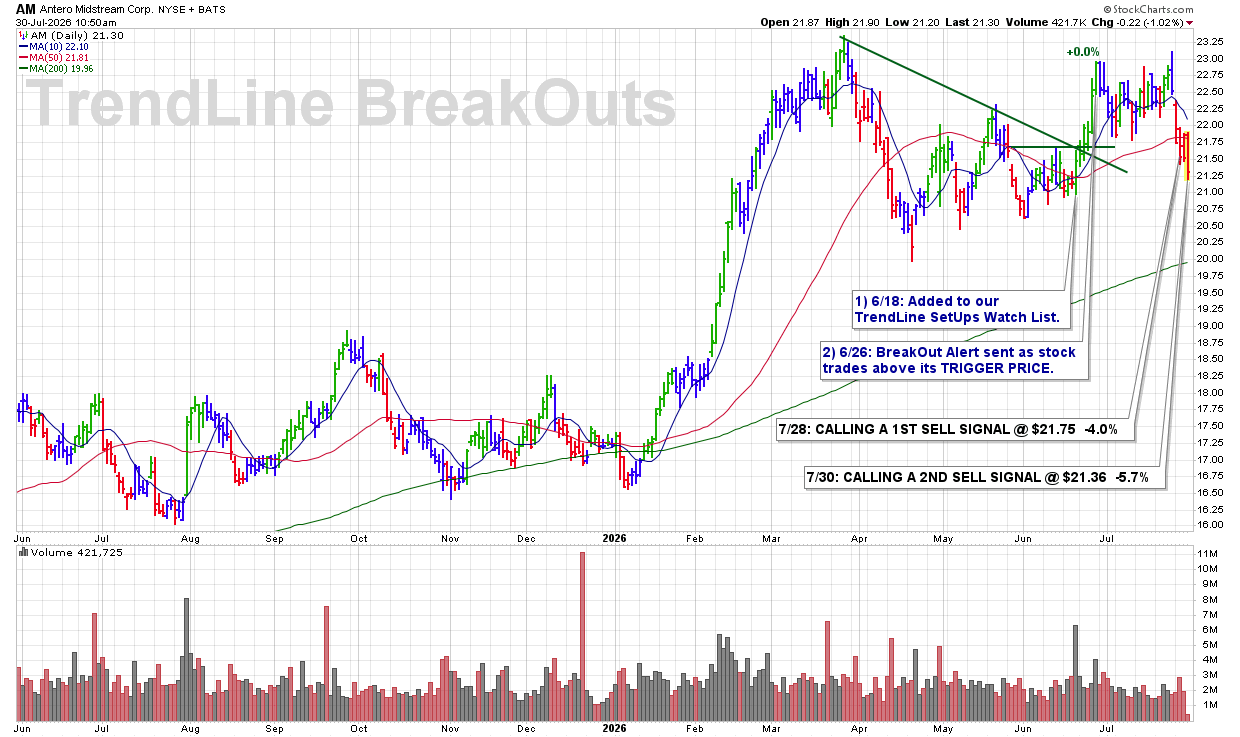
THU 7/30: AM – CALLING A 2ND / FINAL SELL SIGNAL @ $21.36 -5.7%

10:39 AM – Calling a 2ND and FINAL SELL SIGNAL as the stock continues to trade below its 50 DMA and displays persistent technical weakness. The failure to reclaim this key support level confirms the deterioration in the stock’s technical condition coupled with the near -6% decline warrants completing the exit.

ULTRA Trader’s Tip: Do Not Wait for Weakness to Become Worse

• Continued trading below the 50 DMA confirms that an important support level has been lost.

• A stock’s failure to recover after a major technical violation is often a signal to reduce the remaining exposure.

• Completing the exit protects capital and keeps losses from becoming more difficult to manage.

CLICK/TAP CHART TO ZOOM
Chart services courtesy of stockcharts.com. Annotations by James Taulman.

THU 7/30: TRV – CALLING A 3RD SELL SIGNAL @ $373.79 +19.3%

10:32 AM – Calling a 3RD and FINAL SELL SIGNAL on the insurance leader this morning as shares break below the 10 DMA on approximately twice normal trading volume. The expanding volume adds significance to the technical violation and signals increased institutional selling pressure.

ULTRA Trader’s Tip: Complete the Exit When Weakness Is Confirmed

• A decisive break below the 10 DMA becomes more significant when accompanied by sharply higher volume.

• Heavy-volume selling can signal that institutional investors are reducing their positions.

• A final sell protects the remaining gain and frees capital for stronger opportunities.

CLICK/TAP CHART TO ZOOM
Chart services courtesy of stockcharts.com. Annotations by James Taulman.

WED 7/29: EMA – A Break Below the 50 DMA Support at $54.46 Would Be a Sell Signal

8:55 PM – Here is our latest chart update for this recent breakout from our Traditional BreakOuts Watch List

CLICK/TAP CHART TO ZOOM
Chart services courtesy of stockcharts.com. Annotations by James Taulman.

We are currently reporting on this stock as an active holding and continue to monitor the stock closely for any technical SELL SIGNALS.

The focus always remains on price/volume action around key support levels, including the 10 DMA, 50 DMA, and any nearby trendline or ROUND-$ support.

WED 7/29: EIX – Held Its 10 DMA Support at $78.79 on a Rough Market Day

8:50 PM – Here is our latest chart update for this recent breakout from our Traditional BreakOuts Watch List.

CLICK/TAP CHART TO ZOOM
Chart services courtesy of stockcharts.com. Annotations by James Taulman.

We are currently reporting on this stock as an active holding and continue to monitor the stock closely for any technical SELL SIGNALS.

The focus always remains on price/volume action around key support levels, including the 10 DMA, 50 DMA, and any nearby trendline or ROUND-$ support.

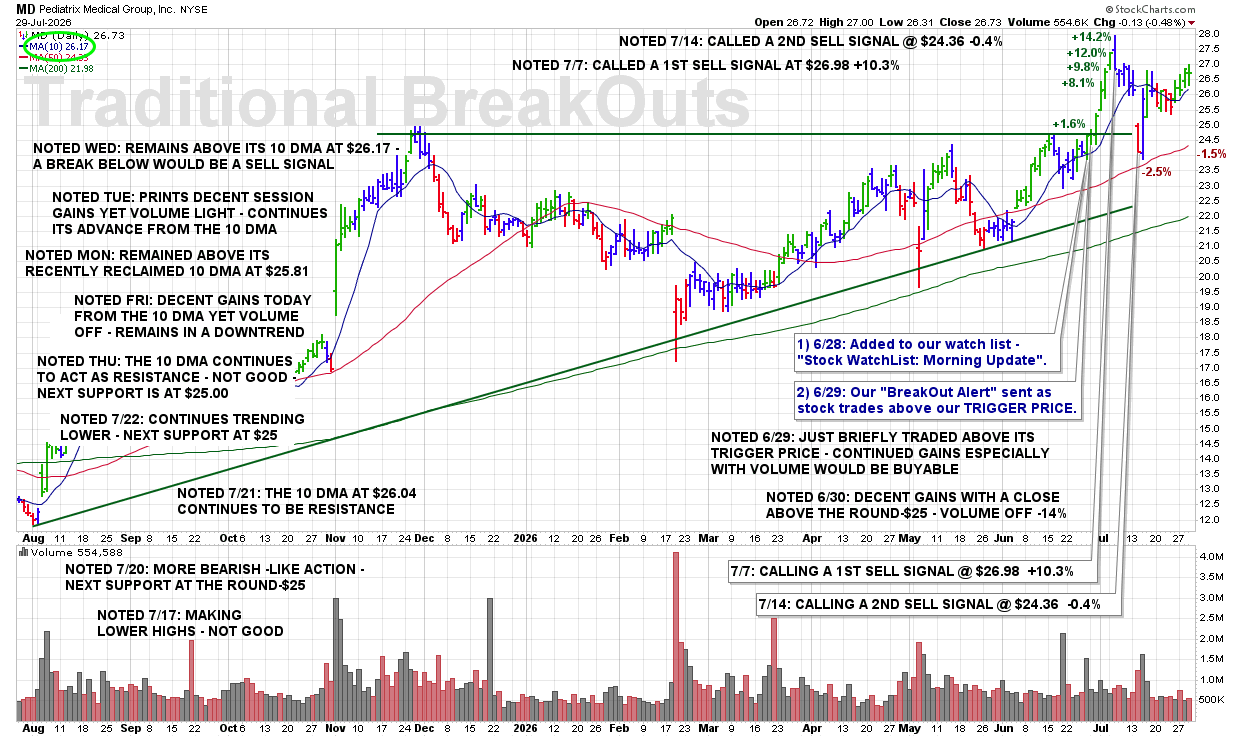
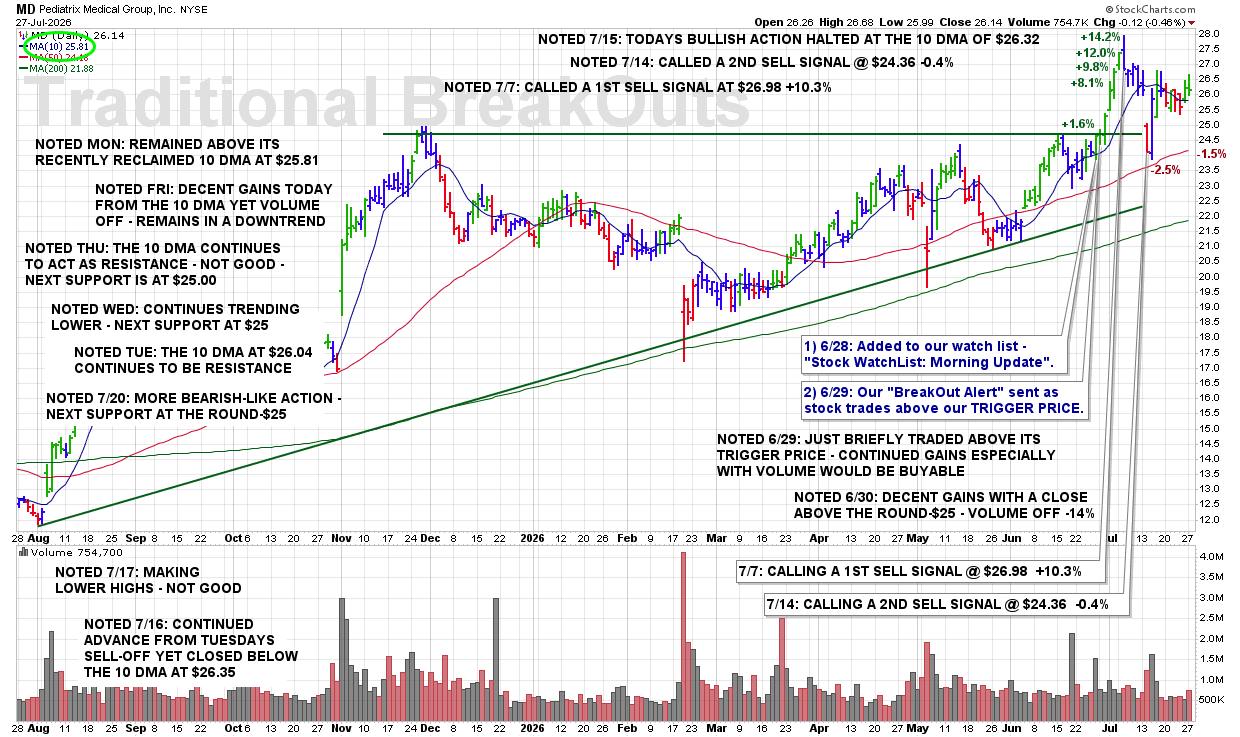
WED 7/29: MD – Remains Above Its 10 DMA at $26.17 – a Break Below Would Be a Sell Signal

8:45 PM – Here is our latest chart update for this recent breakout from our Traditional BreakOuts Watch List.

CLICK/TAP CHART TO ZOOM
Chart services courtesy of stockcharts.com. Annotations by James Taulman.

We are currently reporting on this stock as an active holding and continue to monitor the stock closely for any technical SELL SIGNALS.

The focus always remains on price/volume action around key support levels, including the 10 DMA, 50 DMA, and any nearby trendline or ROUND-$ support.

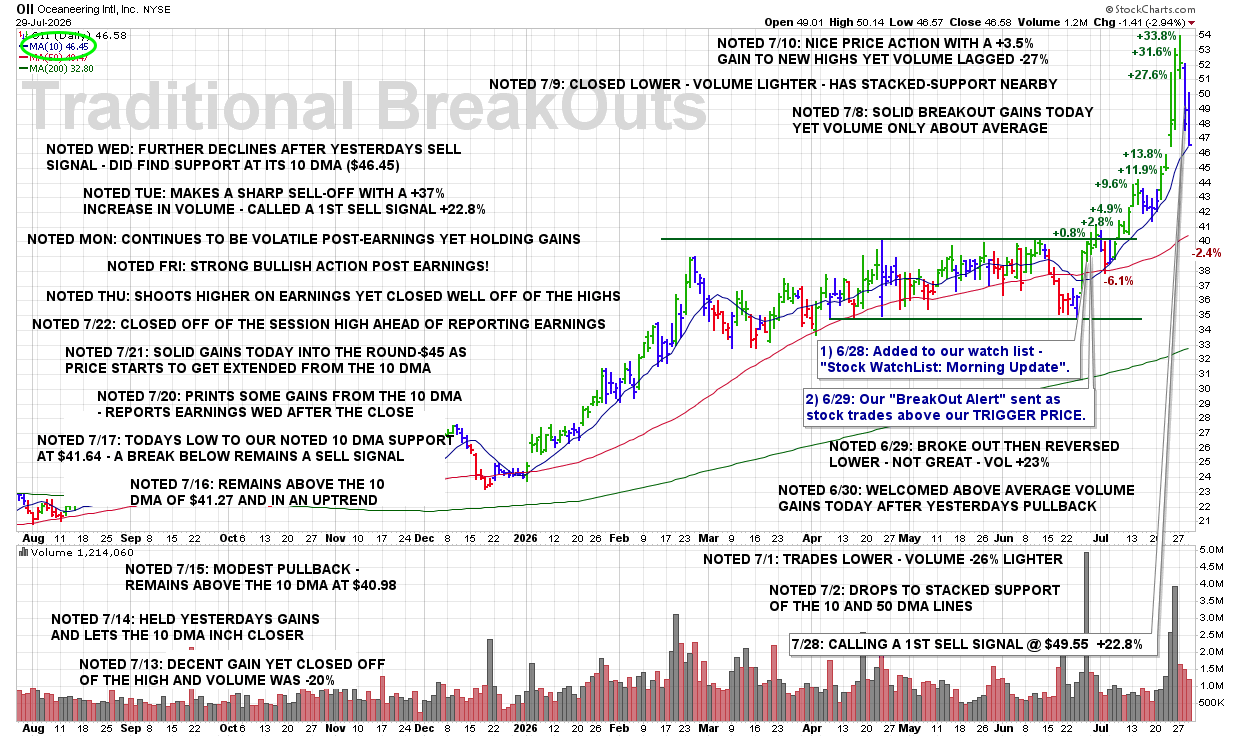
WED 7/29: OII – Further Declines After Yesterdays Sell Signal – Did Find Support at Its 10 DMA ($46.45)

8:40 PM – Here is our latest chart update for this recent breakout from our Traditional BreakOuts Watch List.

CLICK/TAP CHART TO ZOOM
Chart services courtesy of stockcharts.com. Annotations by James Taulman.

We are currently reporting on this stock as an active holding and continue to monitor the stock closely for any technical SELL SIGNALS.

The focus always remains on price/volume action around key support levels, including the 10 DMA, 50 DMA, and any nearby trendline or ROUND-$ support.

WED 7/29: CNP – Did Close Slightly Below Its 50 DMA On Earnings – Any Further Declines Would Be A Sell Signal

8:35 PM – Here is our latest chart update for this recent breakout from our Traditional BreakOuts Watch List.

CLICK/TAP CHART TO ZOOM
Chart services courtesy of stockcharts.com. Annotations by James Taulman.

We are currently reporting on this stock as an active holding and continue to monitor the stock closely for any technical SELL SIGNALS.

The focus always remains on price/volume action around key support levels, including the 10 DMA, 50 DMA, and any nearby trendline or ROUND-$ support.

WED 7/29: ASND – Still Can Not Close Above Its 10 DMA of $254.61 – the Round-$250 Remains as Support

8:30 PM – Here is our latest chart update for this recent breakout from our Traditional BreakOuts Watch List.

CLICK/TAP CHART TO ZOOM
Chart services courtesy of stockcharts.com. Annotations by James Taulman.

We are currently reporting on this stock as an active holding and continue to monitor the stock closely for any technical SELL SIGNALS.

The focus always remains on price/volume action around key support levels, including the 10 DMA, 50 DMA, and any nearby trendline or ROUND-$ support.

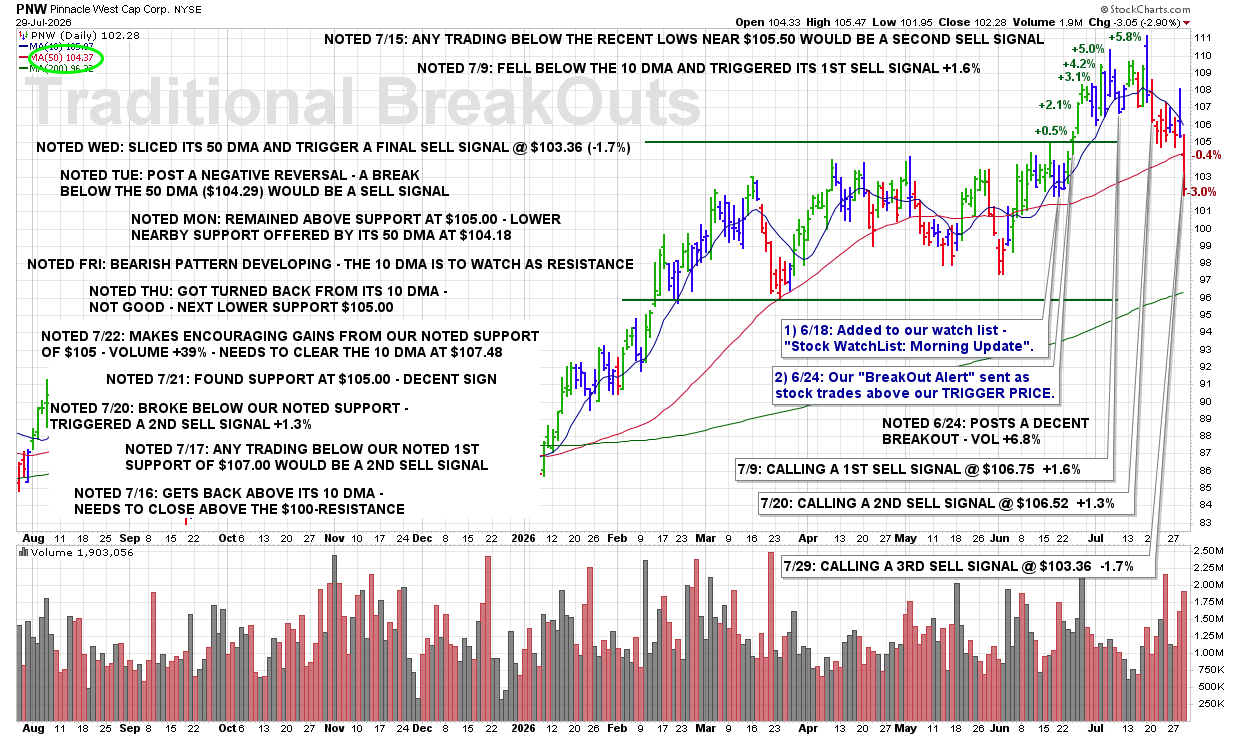
WED 7/29: PNW – Sliced Its 50 DMA and Trigger a Final Sell Signal @ $103.36 (-1.7%)

8:25 PM – Here is our latest chart update for this recent breakout from our Traditional BreakOuts Watch List.

CLICK/TAP CHART TO ZOOM
Chart services courtesy of stockcharts.com. Annotations by James Taulman.

We are currently reporting on this stock as an active holding and continue to monitor the stock closely for any technical SELL SIGNALS.

The focus always remains on price/volume action around key support levels, including the 10 DMA, 50 DMA, and any nearby trendline or ROUND-$ support.

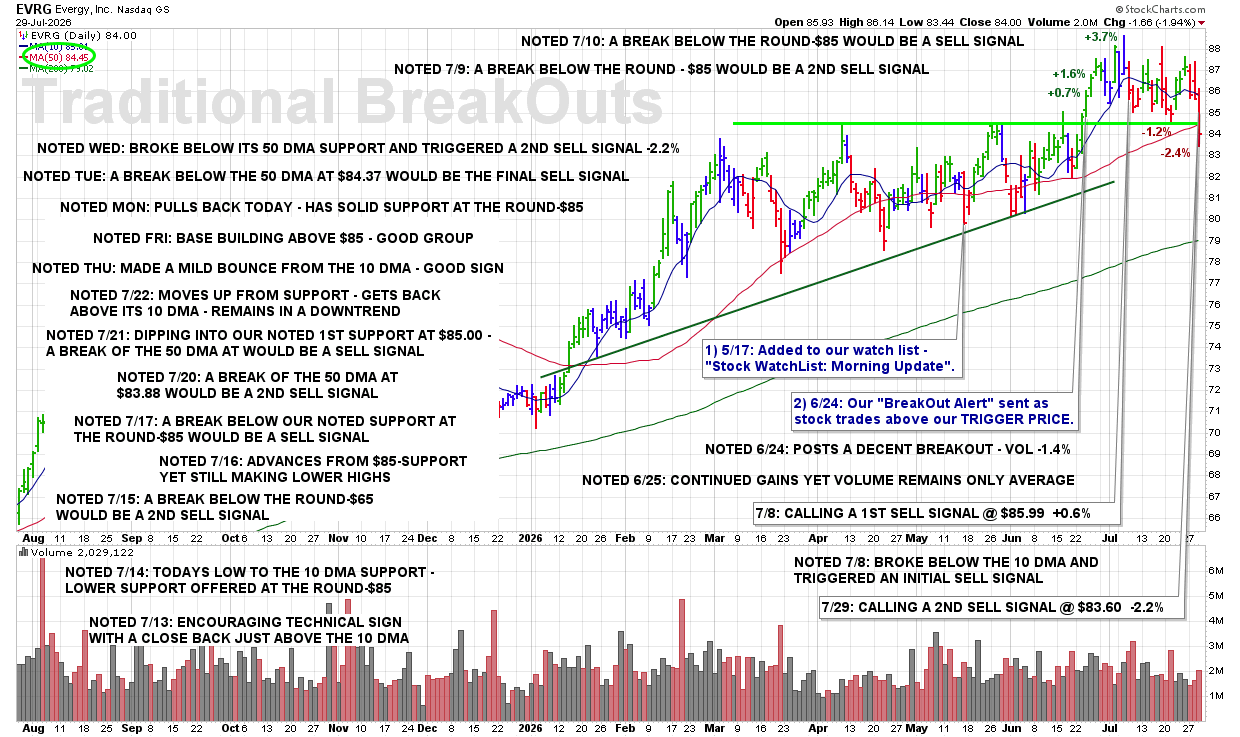
WED 7/29: EVRG – Broke Below Its 50 DMA Support and Triggered a 2nd Sell Signal -2.2%

8:20 PM – Here is our latest chart update for this recent breakout from our Traditional BreakOuts Watch List.

CLICK/TAP CHART TO ZOOM
Chart services courtesy of stockcharts.com. Annotations by James Taulman.

We are currently reporting on this stock as an active holding and continue to monitor the stock closely for any technical SELL SIGNALS.

The focus always remains on price/volume action around key support levels, including the 10 DMA, 50 DMA, and any nearby trendline or ROUND-$ support.

WED 7/29: TRV – Pulls Back on Above Average Volume – Watching the 10 DMA at $375.72

8:15 PM – Here is our latest chart update for this recent breakout from our Traditional BreakOuts Watch List.

CLICK/TAP CHART TO ZOOM
Chart services courtesy of stockcharts.com. Annotations by James Taulman.

We are currently reporting on this stock as an active holding and continue to monitor the stock closely for any technical SELL SIGNALS.

The focus always remains on price/volume action around key support levels, including the 10 DMA, 50 DMA, and any nearby trendline or ROUND-$ support.

WED 7/29: PSMT – Quite Trading Above the 10 DMA on a Down Market Day

7:10 PM – Here is our latest chart update for this recent breakout from our Traditional BreakOuts Watch List.

CLICK/TAP CHART TO ZOOM
Chart services courtesy of stockcharts.com. Annotations by James Taulman.

We are currently reporting on this stock as an active holding and continue to monitor the stock closely for any technical SELL SIGNALS.

The focus always remains on price/volume action around key support levels, including the 10 DMA, 50 DMA, and any nearby trendline or ROUND-$ support.

WED 7/29: EVRG – CALLING A 2ND SELL SIGNAL @ $83.60 – 2.2%

3:33 PM – Calling a 2ND SELL SIGNAL as shares have broken below support at the 50 DMA, representing a significant technical violation. Losing this key intermediate-term support level increases the probability of additional weakness and warrants further reducing the position.

ULTRA Trader’s Tip: The 50 DMA Is a Critical Line of Defense

• A decisive break below the 50 DMA signals that the stock’s intermediate-term trend is weakening.

• When major support fails, the probability of continued downside typically increases.

• Reducing exposure as technical violations accumulate helps preserve capital and maintain portfolio discipline.

CLICK/TAP CHART TO ZOOM
Chart services courtesy of stockcharts.com. Annotations by James Taulman.

WED 7/29: PNW – CALLING A 3RD SELL SIGNAL @ $103.36 -1.7%

12:21 PM – Calling a 3RD and FINAL SELL SIGNAL as the stock has clearly lost support at its 50 DMA. A decisive break below this major technical level is a default sell signal under our rules and warrants completing the exit from this selection.

ULTRA Trader’s Tip: Major Support Breaks Require Decisive Action

  • The 50 DMA is an important measure of intermediate-term technical support.

  • A clear break below this level confirms a meaningful deterioration in the stock’s technical condition.

  • Completing the exit when major support fails helps protect capital and prevents a small loss from becoming more damaging.

CLICK/TAP CHART TO ZOOM
Chart services courtesy of stockcharts.com. Annotations by James Taulman.

WED 7/29: BBSI – BUYING (2/3) @ $41.67

10:33 AM – Buying back into BBSI this morning and adding an additional 1/3 position, bringing my total purchase to 2/3. Shares are moving higher on increased volume, signaling renewed buying demand. Although I cautiously sold the entire position yesterday, I cannot ignore this morning’s bullish price-and-volume action and the fresh BUY SIGNAL it has produced.

James’ Trader’s Tip: Trade the Action—Not Your Previous Decision

  • Selling a stock does not prevent you from buying it back when the technical picture improves.

  • Rising price accompanied by increasing volume can signal renewed institutional demand.

  • Disciplined traders remain flexible and respond to current evidence rather than defending yesterday’s decision.

CLICK/TAP CHART TO ZOOM
Chart services courtesy of stockcharts.com. Annotations by James Taulman.

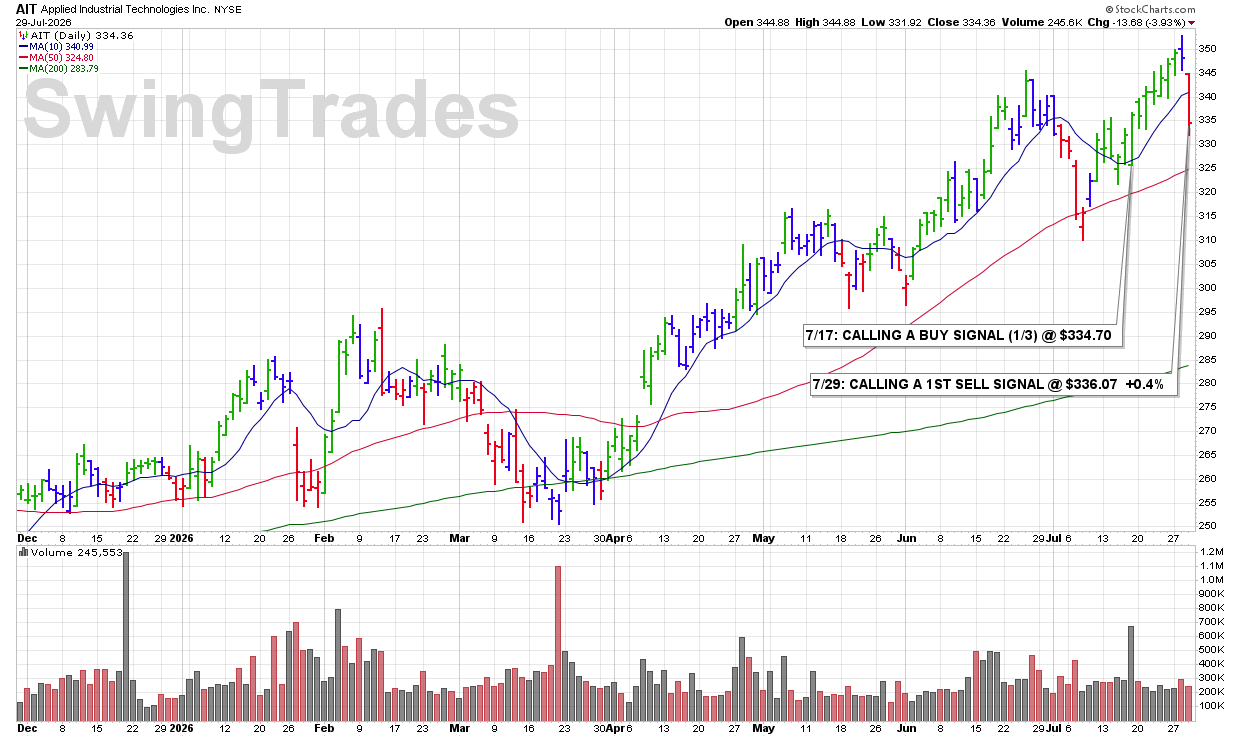
WED 7/29: AIT – CALLING A 1ST SELL SIGNAL @ $336.07 +0.4%

10:12 AM – Calling a 1ST SELL SIGNAL as shares are breaking below the 10 DMA this morning. This represents a technical violation of our primary support level and triggers a standard SELL SIGNAL under the ULTRA Trading System.

ULTRA Trader’s Tip: Follow Your Rules Consistently

  • A break below the 10 DMA is an early warning that a stock’s momentum may be weakening.

  • Consistently following predefined sell rules helps remove emotion from the decision-making process.

  • Small, disciplined sells early can help protect capital if additional technical weakness develops.

CLICK/TAP CHART TO ZOOM
Chart services courtesy of stockcharts.com. Annotations by James Taulman.

WED 7/29: CBZ – SELLING (1/2) P/L: +$2,749.91 +27.5%

9:55 AM – Selling half of my 2/3 position in CBZ this morning after the stock gapped sharply higher following earnings. While the reaction is certainly bullish, post-earnings trading can be highly volatile. I’m taking advantage of the strength to lock in a substantial profit while allowing the remaining shares to participate if the gains continue.

James’ Trader’s Tip: Let Earnings Work for You

  • Large post-earnings gaps often create increased volatility in both directions.

  • Selling a partial position into strength allows you to realize gains while maintaining upside exposure.

  • Scaling out in stages helps reduce emotional decision-making and keeps you aligned with your trading plan.

CLICK/TAP CHART TO ZOOM
Chart services courtesy of stockcharts.com. Annotations by James Taulman.

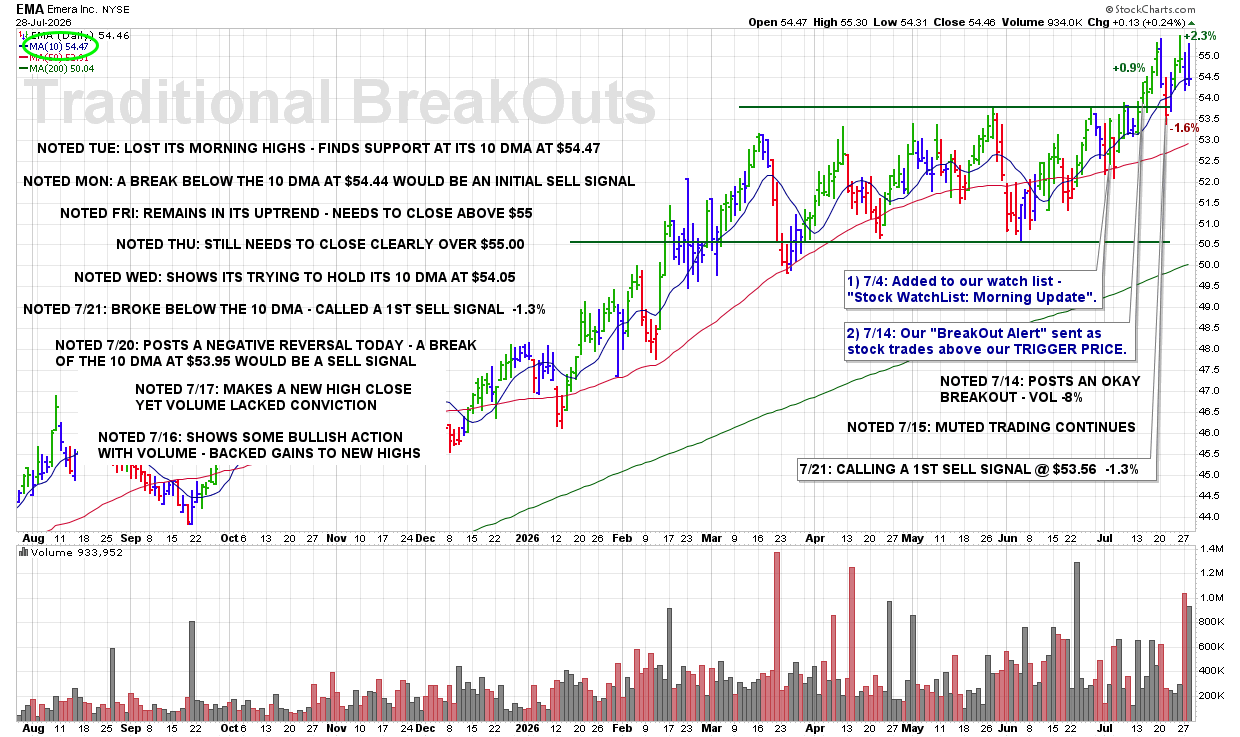
TUE 7/28: EMA – Lost Its Morning Highs – Finds Support at Its 10 DMA at $54.47

8:55 PM – Here is our latest chart update for this recent breakout from our Traditional BreakOuts Watch List

CLICK/TAP CHART TO ZOOM
Chart services courtesy of stockcharts.com. Annotations by James Taulman.

We are currently reporting on this stock as an active holding and continue to monitor the stock closely for any technical SELL SIGNALS.

The focus always remains on price/volume action around key support levels, including the 10 DMA, 50 DMA, and any nearby trendline or ROUND-$ support.

TUE 7/28: EIX – Closed Off of the Highs – Remains in an Uptrend and Above Is 10 DMA – Good Signs

8:50 PM – Here is our latest chart update for this recent breakout from our Traditional BreakOuts Watch List.

CLICK/TAP CHART TO ZOOM
Chart services courtesy of stockcharts.com. Annotations by James Taulman.

We are currently reporting on this stock as an active holding and continue to monitor the stock closely for any technical SELL SIGNALS.

The focus always remains on price/volume action around key support levels, including the 10 DMA, 50 DMA, and any nearby trendline or ROUND-$ support.

TUE 7/28: MD – Prints Decent Session Gains Yet Volume Light – Continues Its Advance From the 10 DMA

8:45 PM – Here is our latest chart update for this recent breakout from our Traditional BreakOuts Watch List.

CLICK/TAP CHART TO ZOOM
Chart services courtesy of stockcharts.com. Annotations by James Taulman.

We are currently reporting on this stock as an active holding and continue to monitor the stock closely for any technical SELL SIGNALS.

The focus always remains on price/volume action around key support levels, including the 10 DMA, 50 DMA, and any nearby trendline or ROUND-$ support.

TUE 7/28: OII – Makes a Sharp Sell-Off With a +37% Increase in Volume – Called a 1st Sell Signal +22.8%

8:40 PM – Here is our latest chart update for this recent breakout from our Traditional BreakOuts Watch List.

CLICK/TAP CHART TO ZOOM
Chart services courtesy of stockcharts.com. Annotations by James Taulman.

We are currently reporting on this stock as an active holding and continue to monitor the stock closely for any technical SELL SIGNALS.

The focus always remains on price/volume action around key support levels, including the 10 DMA, 50 DMA, and any nearby trendline or ROUND-$ support.

TUE 7/28: CNP – Announced Earnings – Still Needs to Close Above Resistance at $45.00

8:35 PM – Here is our latest chart update for this recent breakout from our Traditional BreakOuts Watch List.

CLICK/TAP CHART TO ZOOM
Chart services courtesy of stockcharts.com. Annotations by James Taulman.

We are currently reporting on this stock as an active holding and continue to monitor the stock closely for any technical SELL SIGNALS.

The focus always remains on price/volume action around key support levels, including the 10 DMA, 50 DMA, and any nearby trendline or ROUND-$ support.

TUE 7/28: ASND – Rallies Into the Close but Remains Below Its Proven 10 DMA Resistance

8:30 PM – Here is our latest chart update for this recent breakout from our Traditional BreakOuts Watch List.

CLICK/TAP CHART TO ZOOM
Chart services courtesy of stockcharts.com. Annotations by James Taulman.

We are currently reporting on this stock as an active holding and continue to monitor the stock closely for any technical SELL SIGNALS.

The focus always remains on price/volume action around key support levels, including the 10 DMA, 50 DMA, and any nearby trendline or ROUND-$ support.

TUE 7/28: PNW – Post A Negative Reversal – A Break Below The 50 DMA ($104.29) Would Be A Sell Signal

8:25 PM – Here is our latest chart update for this recent breakout from our Traditional BreakOuts Watch List.

CLICK/TAP CHART TO ZOOM
Chart services courtesy of stockcharts.com. Annotations by James Taulman.

We are currently reporting on this stock as an active holding and continue to monitor the stock closely for any technical SELL SIGNALS.

The focus always remains on price/volume action around key support levels, including the 10 DMA, 50 DMA, and any nearby trendline or ROUND-$ support.

TUE 7/28: EVRG – A Break Below the 50 DMA at $84.37 Would Be the Final Sell Signal

8:20 PM – Here is our latest chart update for this recent breakout from our Traditional BreakOuts Watch List.

CLICK/TAP CHART TO ZOOM
Chart services courtesy of stockcharts.com. Annotations by James Taulman.

We are currently reporting on this stock as an active holding and continue to monitor the stock closely for any technical SELL SIGNALS.

The focus always remains on price/volume action around key support levels, including the 10 DMA, 50 DMA, and any nearby trendline or ROUND-$ support.

TUE 7/28: TRV – Continued Gains to New Highs as Volume Continues to Show Conviction

8:15 PM – Here is our latest chart update for this recent breakout from our Traditional BreakOuts Watch List.

CLICK/TAP CHART TO ZOOM
Chart services courtesy of stockcharts.com. Annotations by James Taulman.

We are currently reporting on this stock as an active holding and continue to monitor the stock closely for any technical SELL SIGNALS.

The focus always remains on price/volume action around key support levels, including the 10 DMA, 50 DMA, and any nearby trendline or ROUND-$ support.

TUE 7/28: PSMT – Gets Back Above Its 10 DMA – Decent Sign

8:10 PM – Here is our latest chart update for this recent breakout from our Traditional BreakOuts Watch List.

CLICK/TAP CHART TO ZOOM
Chart services courtesy of stockcharts.com. Annotations by James Taulman.

We are currently reporting on this stock as an active holding and continue to monitor the stock closely for any technical SELL SIGNALS.

The focus always remains on price/volume action around key support levels, including the 10 DMA, 50 DMA, and any nearby trendline or ROUND-$ support.

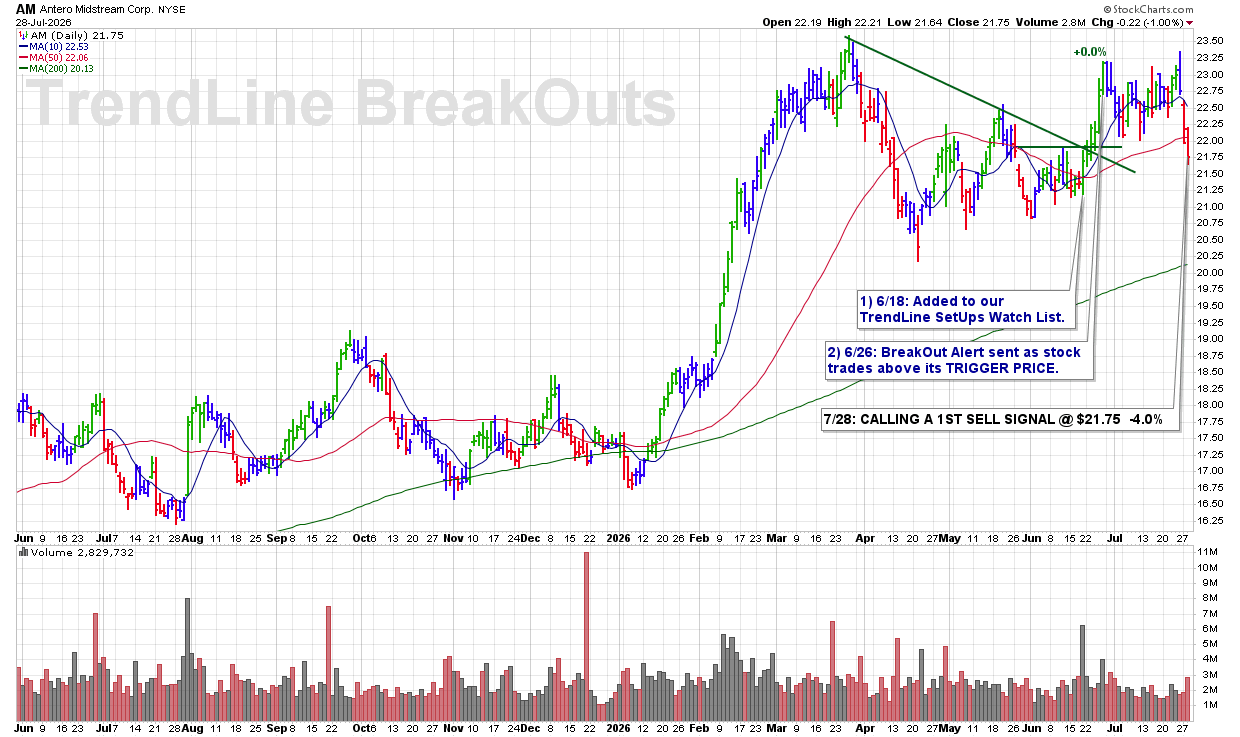
TUE 7/28: AM – CALLING A 1ST SELL SIGNAL @ $21.75 -4.0%

3:47 PM – Calling a 1ST SELL SIGNAL here as the stock has clearly broken below its 50 DMA support and is closing near the session lows on a 27% increase in volume. The combination of a major support violation, weak closing action, and rising volume represents a meaningful deterioration in the stock’s technical condition.

ULTRA Trader’s Tip: Respect a Break of Major Support

• The 50 DMA is an important intermediate-term support level.

• A break below support carries greater significance when volume expands.

• Closing near the session lows confirms that sellers remained in control through the end of the day.

CLICK/TAP CHART TO ZOOM
Chart services courtesy of stockcharts.com. Annotations by James Taulman.

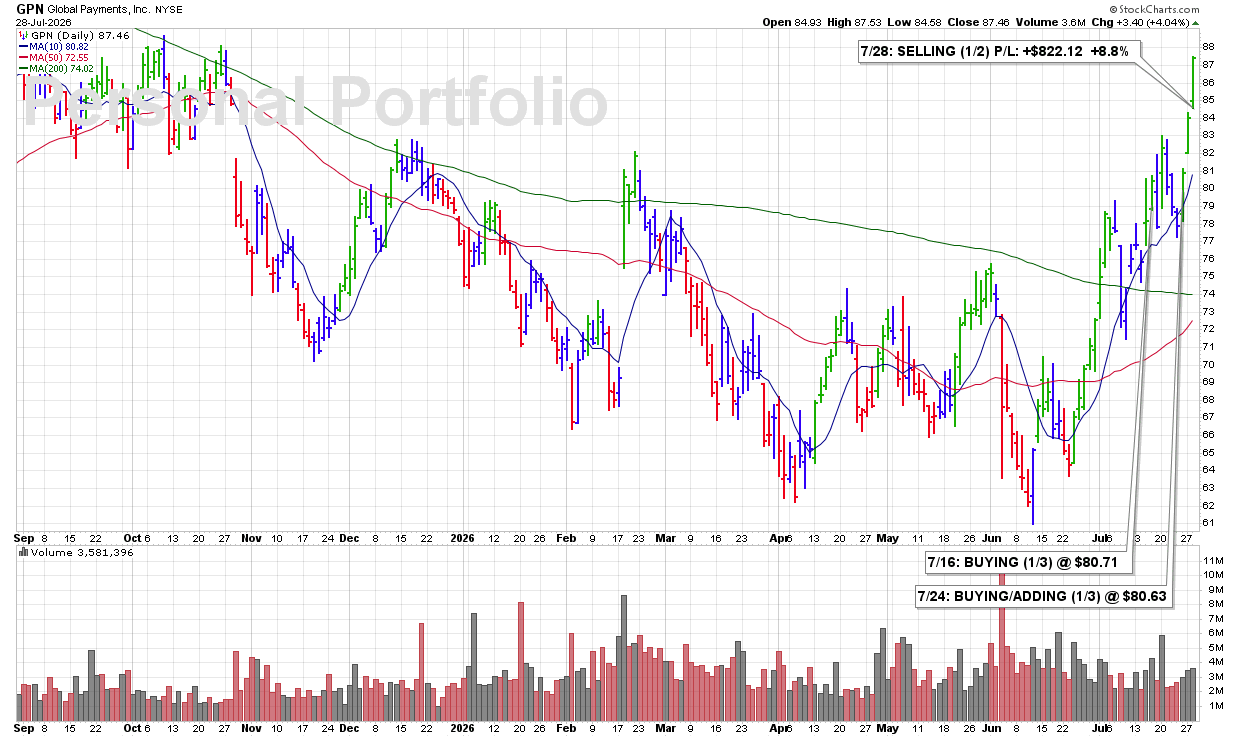
TUE 7/28: GPN – SELLING (1/2) P/L: +$822.12 +8.8%

3:43 PM – Selling half my GPN position here and locking in a solid gain. I have been in a selling mode today because I currently own too many stocks and may be carrying too much exposure in an increasingly shaky market. With my personal trading account at all-time highs—up 20% YTD and 60% YoY—my priority is protecting those gains and reducing unnecessary risk.

James’ Trader’s Tip: Reduce Exposure From a Position of Strength

  • Trimming a profitable position allows you to lock in gains while maintaining some exposure if the stock continues higher.

  • When portfolio exposure becomes excessive, reducing positions can lower both market risk and margin pressure.

  • Protecting an account at all-time highs requires discipline—not complacency.

CLICK/TAP CHART TO ZOOM
Chart services courtesy of stockcharts.com. Annotations by James Taulman.

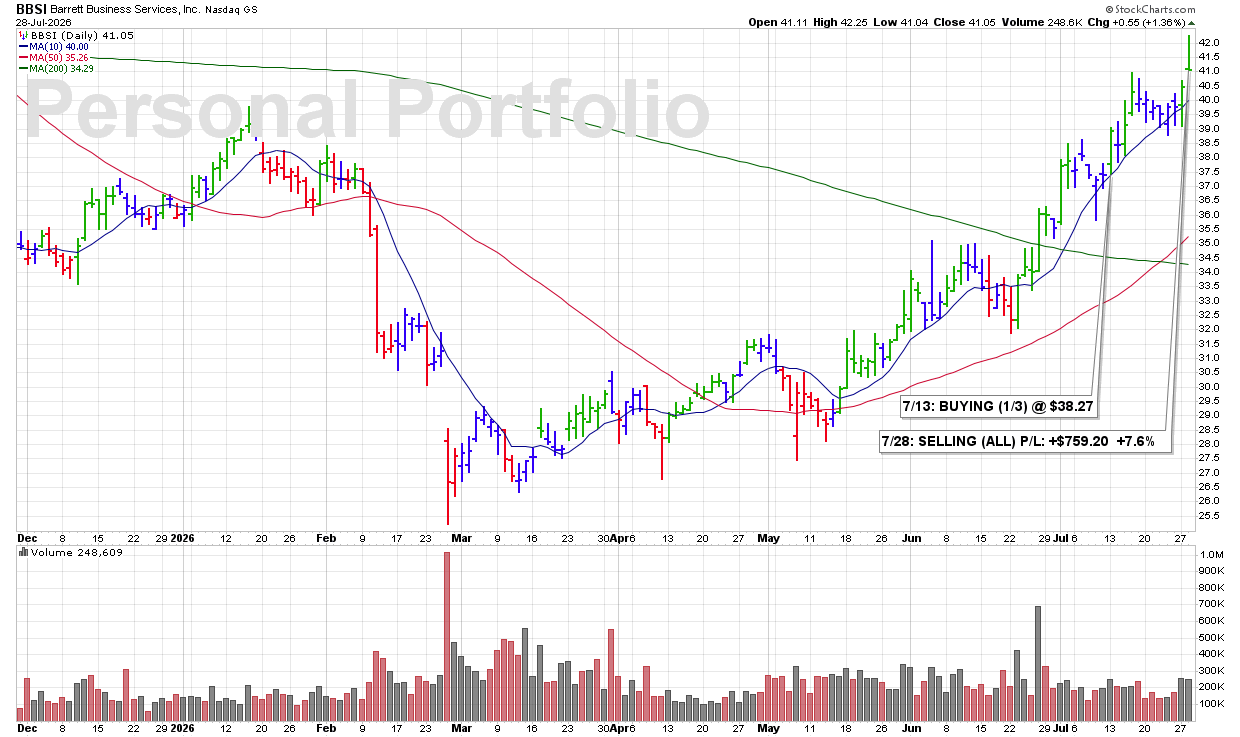
TUE 7/28: BBSI – SELLING (ALL) P/L: +$759.20 +7.6%

3:34 PM – Selling all my BBSI shares this afternoon as the stock reverses from its intraday highs and begins to weaken into the close. I’m taking the opportunity to lock in a solid profit while also reducing my overall margin and market exposure. My account is at all-time highs, and I want to keep it that way.

James’ Trader’s Tip: Protect Profits Before They Evaporate

• Stocks reversing from their intraday highs can signal that buying momentum is fading.

• Taking a respectable profit is often better than hoping for a little more and risking much less.

• Consistent trading is built on protecting gains just as diligently as limiting losses.

CLICK/TAP CHART TO ZOOM
Chart services courtesy of stockcharts.com. Annotations by James Taulman.

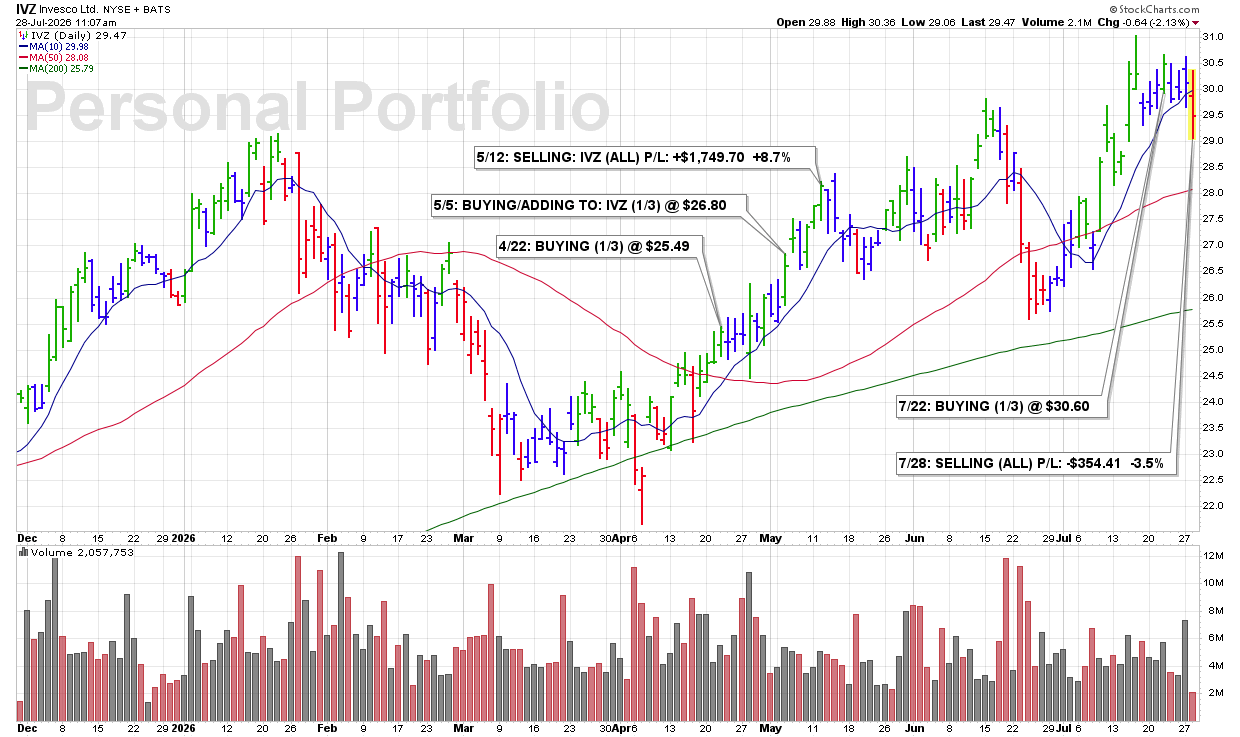
TUE 7/28: IVZ – SELLING (ALL) P/L: -$354.41 -3.5%

7/28 TUE: IVZ – SELLING (ALL) P/L: -$354.41 -3.5%

11:02 AM – Selling all my IVZ shares this morning. The stock has become volatile following earnings, which is both expected and fairly normal. However, I’m simply not willing to assume any additional risk here. My personal trading account is currently sitting at all-time highs, and my priority is protecting those gains rather than hoping for a post-earnings recovery.

James’ Trader’s Tip: There Is Nothing Wrong With Reducing Risk

• Earnings often create unpredictable price swings, regardless of a company’s long-term outlook.

• Protecting capital is just as important as generating returns.

• Sometimes the best decision is to step aside and preserve portfolio strength for the next high-probability opportunity.

CLICK/TAP CHART TO ZOOM
Chart services courtesy of stockcharts.com. Annotations by James Taulman.

TUE 7/28: OII – CALLING A 1ST SELL SIGNAL @ $49.55 +22.8%

10:14 AM – Calling a 1ST SELL SIGNAL this morning as shares sell off sharply on a massive 185% increase in volume. The heavy-volume decline signals strong institutional selling pressure and represents a clear change in the stock’s recent technical character.

ULTRA Trader’s Tip: Heavy Selling Volume Demands Respect

  • A sharp decline on unusually high volume often signals institutional distribution.

  • The greater the volume increase, the more significant the technical warning becomes.

  • Protecting a strong gain begins with responding when a stock’s price-and-volume action changes materially.

CLICK/TAP CHART TO ZOOM
Chart services courtesy of stockcharts.com. Annotations by James Taulman.

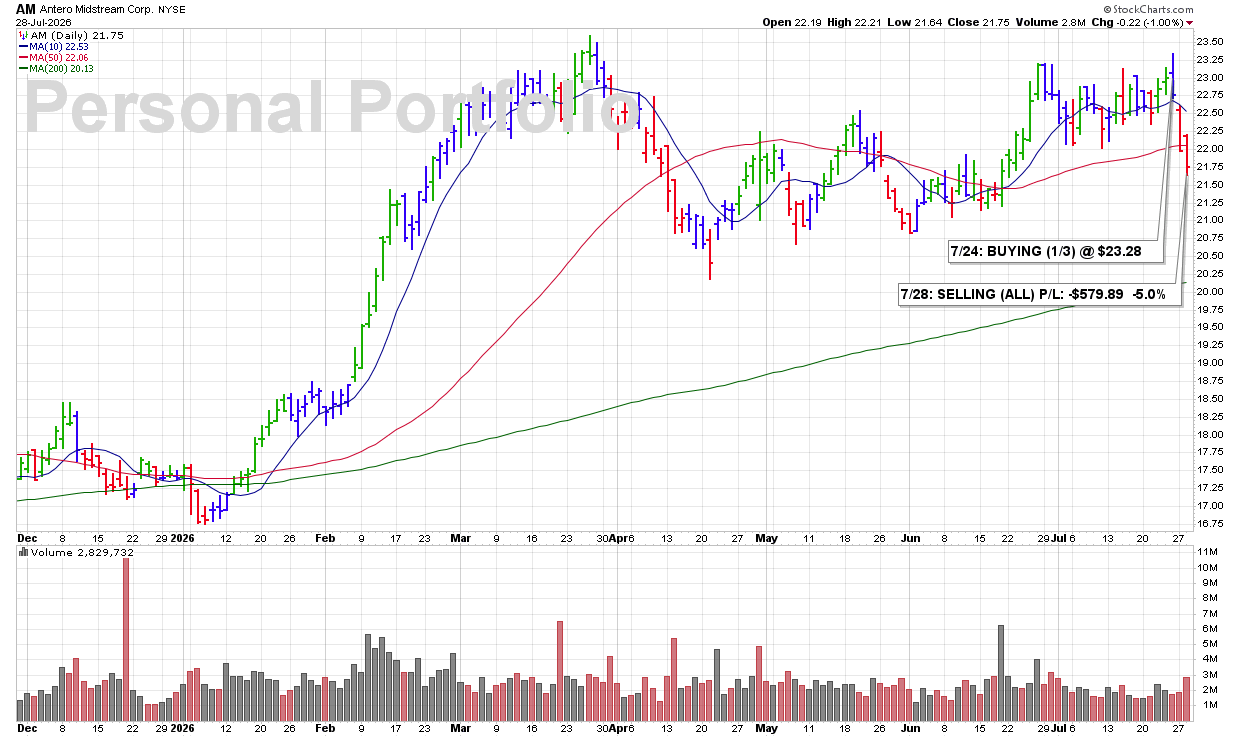
TUE 7/28: AM – SELLING (ALL) P/L: -$579.89 -5.0%

9:40 AM – Selling all my AM shares this morning as the stock continues lower after slipping below the 50 DMA yesterday. That break represents clear technical weakness. I am also freeing up needed capital to add another 1/3 position to FTS, which appears headed toward new highs on above-average volume.

James’ Trader’s Tip: Move Capital Toward Strength

  • A break below the 50 DMA is a meaningful technical violation that should not be ignored.

  • Holding a weakening stock can prevent capital from being deployed into a stronger opportunity.

  • Portfolio management is not only about what you sell—it is also about where that capital can work more effectively.

CLICK/TAP CHART TO ZOOM
Chart services courtesy of stockcharts.com. Annotations by James Taulman.

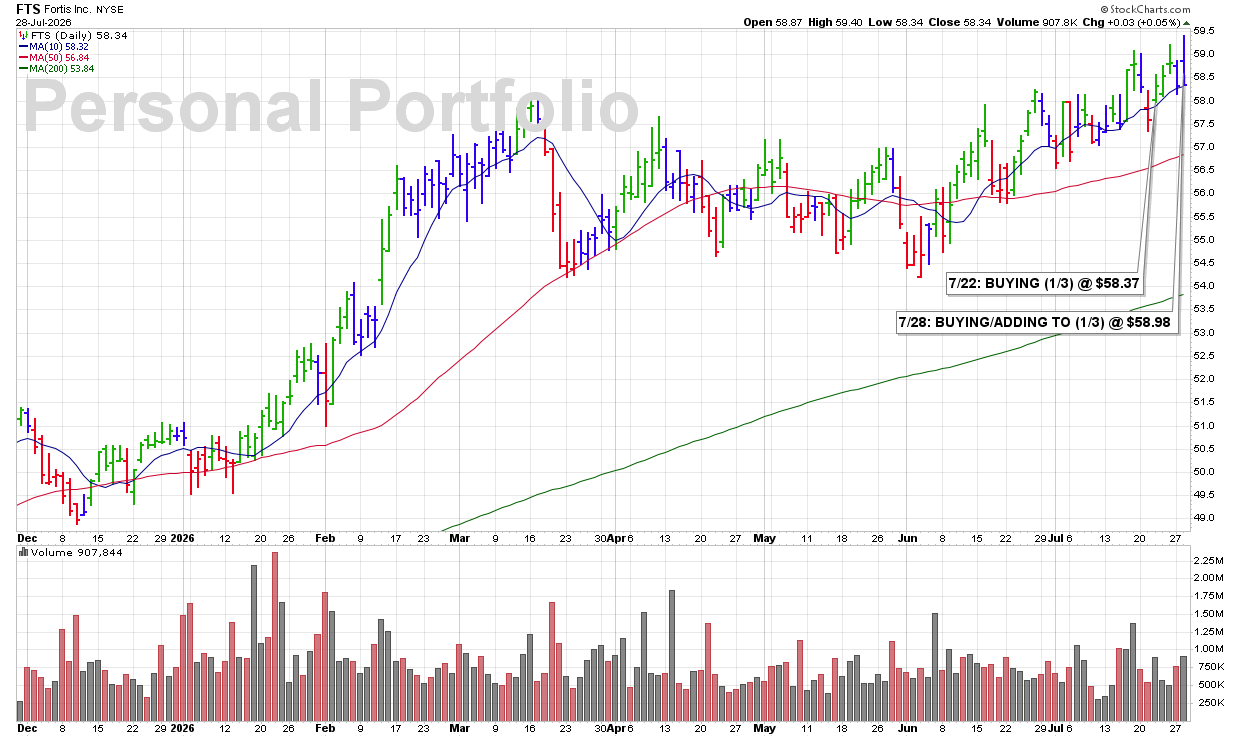
TUE 7/28: FTS – BUYING/ADDING TO (1/3) @ $58.98

9:40 AM – Adding another 1/3 position to FTS as shares advance from the 10 DMA to new highs on more than double their average volume. This powerful combination of price and volume confirms continued institutional demand and technical strength.

James’ Trader’s Tip: Exceptional Volume Strengthens the Signal

  • Volume running at more than twice the daily average signals unusually strong buying demand.

  • New highs reached on heavy volume carry greater technical significance than advances on light trade.

  • Adding in thirds allows us to increase exposure as the stock continues to confirm its strength.

CLICK/TAP CHART TO ZOOM
Chart services courtesy of stockcharts.com. Annotations by James Taulman.

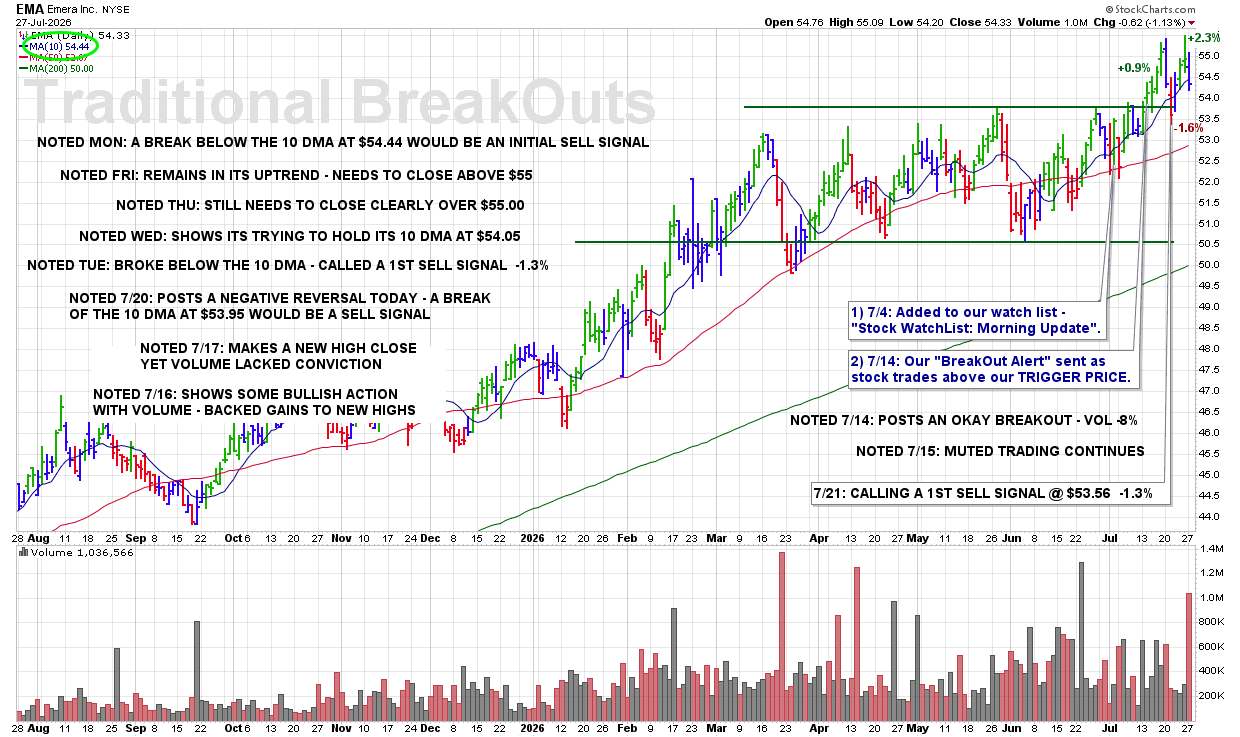
MON 7/27: EMA – A Break Below the 10 DMA at 54.44 Would Be an Initial Sell Signal

8:45 PM – Here is our latest chart update for this recent breakout from our Traditional BreakOuts Watch List

CLICK/TAP CHART TO ZOOM
Chart services courtesy of stockcharts.com. Annotations by James Taulman.

We are currently reporting on this stock as an active holding and continue to monitor the stock closely for any technical SELL SIGNALS.

The focus always remains on price/volume action around key support levels, including the 10 DMA, 50 DMA, and any nearby trendline or ROUND-$ support.

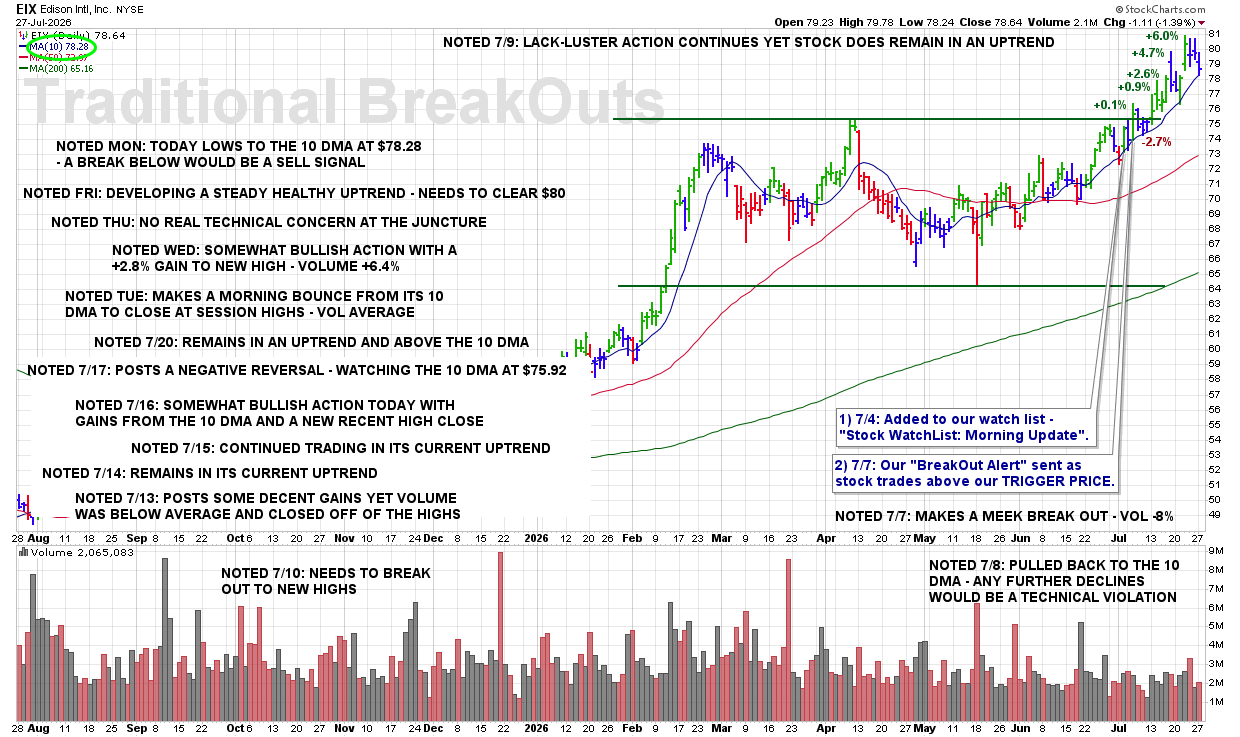
MON 7/27: EIX – Today Lows to the 10 DMA at $78.28 – a Break Below Would Be a Sell Signal

8:40 PM – Here is our latest chart update for this recent breakout from our Traditional BreakOuts Watch List.

CLICK/TAP CHART TO ZOOM
Chart services courtesy of stockcharts.com. Annotations by James Taulman.

We are currently reporting on this stock as an active holding and continue to monitor the stock closely for any technical SELL SIGNALS.

The focus always remains on price/volume action around key support levels, including the 10 DMA, 50 DMA, and any nearby trendline or ROUND-$ support.

MON 7/27: MD – Remained Above Its Recently Reclaimed 10 DMA at $25.81

8:35 PM – Here is our latest chart update for this recent breakout from our Traditional BreakOuts Watch List.

CLICK/TAP CHART TO ZOOM
Chart services courtesy of stockcharts.com. Annotations by James Taulman.

We are currently reporting on this stock as an active holding and continue to monitor the stock closely for any technical SELL SIGNALS.

The focus always remains on price/volume action around key support levels, including the 10 DMA, 50 DMA, and any nearby trendline or ROUND-$ support.

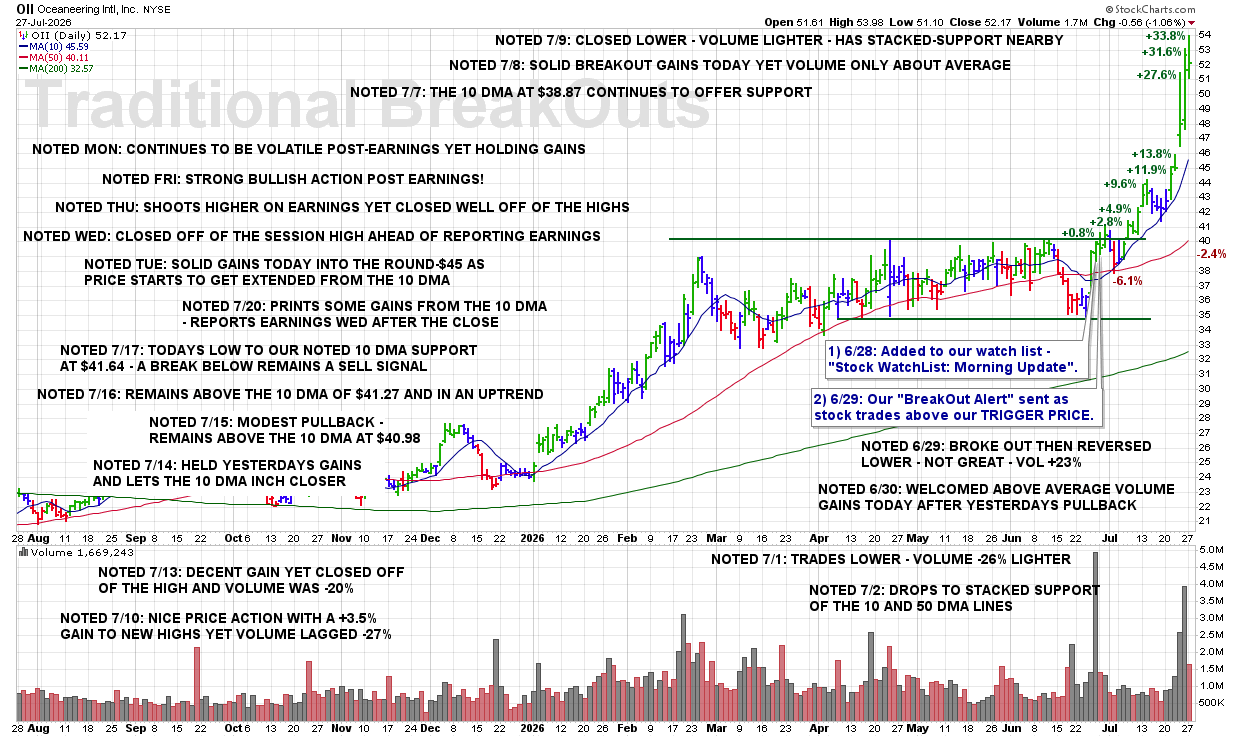
MON 7/27: OII – Continues To Be Volatile Post-Earnings Yet Holding Gains

8:30 PM – Here is our latest chart update for this recent breakout from our Traditional BreakOuts Watch List.

CLICK/TAP CHART TO ZOOM
Chart services courtesy of stockcharts.com. Annotations by James Taulman.

We are currently reporting on this stock as an active holding and continue to monitor the stock closely for any technical SELL SIGNALS.

The focus always remains on price/volume action around key support levels, including the 10 DMA, 50 DMA, and any nearby trendline or ROUND-$ support.

MON 7/27: CNP – Reports Earnings Tomorrow After the Close

8:25 PM – Here is our latest chart update for this recent breakout from our Traditional BreakOuts Watch List.

CLICK/TAP CHART TO ZOOM
Chart services courtesy of stockcharts.com. Annotations by James Taulman.

We are currently reporting on this stock as an active holding and continue to monitor the stock closely for any technical SELL SIGNALS.

The focus always remains on price/volume action around key support levels, including the 10 DMA, 50 DMA, and any nearby trendline or ROUND-$ support.

MON 7/27: ASND – Makes for a Great Example of 10 DMA Resistance

8:20 PM – Here is our latest chart update for this recent breakout from our Traditional BreakOuts Watch List.

CLICK/TAP CHART TO ZOOM
Chart services courtesy of stockcharts.com. Annotations by James Taulman.

We are currently reporting on this stock as an active holding and continue to monitor the stock closely for any technical SELL SIGNALS.

The focus always remains on price/volume action around key support levels, including the 10 DMA, 50 DMA, and any nearby trendline or ROUND-$ support.

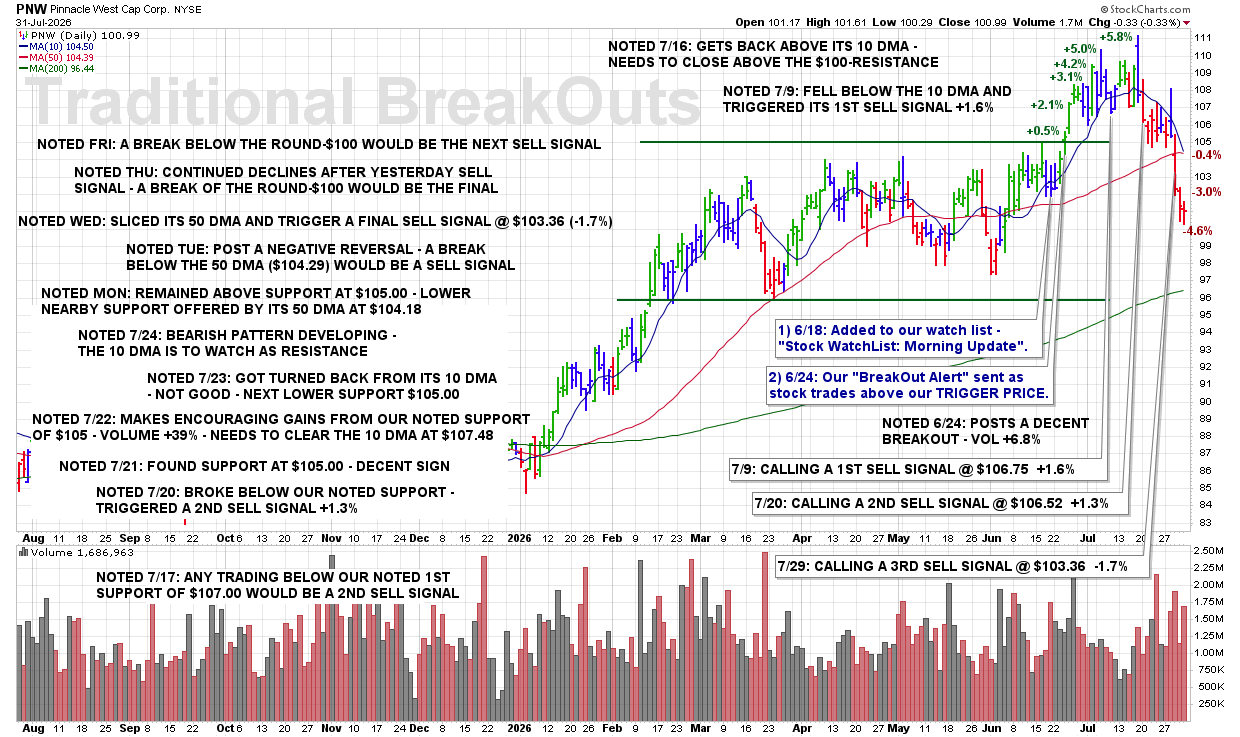
MON 7/27: PNW – Remained Above Support at $105.00 – Lower Nearby Support Offered by Its 50 DMA at $104.18

8:15 PM – Here is our latest chart update for this recent breakout from our Traditional BreakOuts Watch List.

CLICK/TAP CHART TO ZOOM
Chart services courtesy of stockcharts.com. Annotations by James Taulman.

We are currently reporting on this stock as an active holding and continue to monitor the stock closely for any technical SELL SIGNALS.

The focus always remains on price/volume action around key support levels, including the 10 DMA, 50 DMA, and any nearby trendline or ROUND-$ support.